Publisher’s version / Version de l'éditeur:
Canadian Journal of Civil Engineering, 34, May 5, pp. 608-621, 2007-05-01
READ THESE TERMS AND CONDITIONS CAREFULLY BEFORE USING THIS WEBSITE. https://nrc-publications.canada.ca/eng/copyright
Vous avez des questions? Nous pouvons vous aider. Pour communiquer directement avec un auteur, consultez la première page de la revue dans laquelle son article a été publié afin de trouver ses coordonnées. Si vous n’arrivez pas à les repérer, communiquez avec nous à [email protected].
Questions? Contact the NRC Publications Archive team at
[email protected]. If you wish to email the authors directly, please see the first page of the publication for their contact information.
NRC Publications Archive
Archives des publications du CNRC
This publication could be one of several versions: author’s original, accepted manuscript or the publisher’s version. / La version de cette publication peut être l’une des suivantes : la version prépublication de l’auteur, la version acceptée du manuscrit ou la version de l’éditeur.
For the publisher’s version, please access the DOI link below./ Pour consulter la version de l’éditeur, utilisez le lien DOI ci-dessous.
https://doi.org/10.1139/L06-162
Access and use of this website and the material on it are subject to the Terms and Conditions set forth at
Factors contributing to the failure of asbestos cement water mains
Hu, Y.; Hubble, D. W.
https://publications-cnrc.canada.ca/fra/droits
L’accès à ce site Web et l’utilisation de son contenu sont assujettis aux conditions présentées dans le site LISEZ CES CONDITIONS ATTENTIVEMENT AVANT D’UTILISER CE SITE WEB.
NRC Publications Record / Notice d'Archives des publications de CNRC:
https://nrc-publications.canada.ca/eng/view/object/?id=a9b16786-8e97-4eef-b022-a9957672c4f6 https://publications-cnrc.canada.ca/fra/voir/objet/?id=a9b16786-8e97-4eef-b022-a9957672c4f6Factors contributing to the failure of asbestos
cement water mains
Y. Hu and D.W. Hubble
Abstract: Asbestos cement (AC) water mains were installed extensively in North America, Europe, and Australia from
the late 1920s to the early 1980s and still form a significant component of water distribution networks of many cities. These water mains are ageing and some water systems have experienced a high breakage rate in AC mains in recent years. It is essential that a clear understanding be developed of the factors contributing to their failure to ensure that municipalities and water authorities can manage their AC water-main assets. In this paper, the historical failure data of AC water mains from the City of Regina were collected and correlated with their corresponding environmental setting, including soil type, water quality, climate, and construction and maintenance practices. The predominant factors that influence the AC pipe breaks were identified. It was observed that pipe age, diameter, climate, clay soil, and construc-tion and maintenance methods all influence the failure of AC water mains in the city, with climate and clay soil condi-tions being the two critical factors. Some chemical attack from the conveyed water and soil pore water may have occurred and detrimentally affected the structural integrity of the AC water mains.
Key words:asbestos cement pipes, water mains, pipe failure, clay soil, climate.
Résumé : Des conduites principales en amiante-ciment (AC) ont été installées à grande échelle en Amérique du Nord,
en Europe et en Australie à partir des années 1920 jusqu’au début des années 1980 et elles forment encore une part importante des réseaux de distribution d’eau de plusieurs villes. Ces conduites principales vieillissent et certains systèmes de distribution d’eau ont subi de nombreux bris aux cours des dernières années. Il est essentiel de bien comprendre les facteurs contribuant à leur défaillance afin d’assurer que les municipalités et les agences responsable de l’eau peuvent gérer leurs conduites principales en AC. Dans cet article, les données historiques de défaillance des conduites principales en AC de la ville de Régina ont été colligées et corrélées en tenant compte de leur environnement respectif, incluant le type de sol, la qualité de l’eau, le climat ainsi que les pratiques de construction–maintenance. Les facteurs prédominants influençant les bris des conduites AC ont été identifiés. Il a été remarqué que l’âge des conduites, leur diamètre, le climat, le sol argileux et les méthodes de construction–maintenance influencent tous la défaillance des conduites principales AC dans la ville; le climat et les conditions de sol argileux sont les deux facteurs critiques. Certaines attaques chimi-ques de l’eau transportée et de l’eau interstitielle ont peut-être eu lieu et ont possiblement affecté l’intégrité structurale des conduites d’eau principales en AC.
Mots-clés :conduite en amiante-ciment, conduite principale, rupture des conduites, sol argileux, climat.
[Traduit par la Rédaction] Hu and Hubble 621
Introduction
Asbestos cement (AC) water mains were installed exten-sively in North America, Europe, and Australia from the late 1920s to the early 1980s and still form a significant compo-nent of the water distribution systems of many cities. These water mains are ageing and some water distribution systems
have experienced a high breakage rate of their AC mains in recent years. Some municipalities and water authorities replace AC water mains whenever their performance and condition warrant repairs. This may not be an option for many utilities and municipalities because of their large inventories of AC water mains and funding constraints. To ensure that the water authorities can manage their AC water-main assets and provide an adequate supply of safe water in a cost-effective, reliable, and sustainable manner, it is essential that a clear under-standing be developed of AC water-main failure conditions and the factors contributing to their failure. Such an under-standing may help municipalities and water authorities take appropriate measures to mitigate the effect of the factors and to extend the service life of the AC water mains.
Like the failure of water mains made with other materials, the failure of AC water mains is influenced by a number of factors. These factors may be grouped into three general categories: (a) physical characteristics of the pipes them-selves (e.g., strength and modulus of elasticity); (b) the
envi-Received 5 July 2006. Revision accepted 13 November 2006. Published on the NRC Research Press Web site at cjce.nrc.ca on 15 June 2007.
Y. Hu1and D.W. Hubble. Centre for Sustainable
Infrastructure Research, Institute for Research in Construction, National Research Council Canada, Suite 301, 6 Research Drive, Regina, SK S4S 7J7, Canada.
Written discussion of this article is welcomed and will be received by the Editor until 30 September 2007.
ronments in which the pipes were laid (e.g., climate, soil type and groundwater properties); and (c) operational char-acteristics (e.g., conveyed water quality and procedures for operation, maintenance, repair, and replacement) (NRCC 2002; Rajani and Kleiner 2001). The combination of these factors determines the failure processes and modes of AC water mains. However, the role played by each factor may vary from water main to water main owing to site-specific condi-tions.
Corrosion caused by chemical attack from conveyed water and surrounding soil environment has been a concern since the early 1980s, and extensive studies have been conducted to identify the factors that lead to corrosion of AC water mains. Nebesar (1983) summarized the research in this area until the early 1980s and described a number of chemical agents that can attack AC water mains from the inside. These agents include acids, sulphates, magnesium salts, alkaline hydroxides, ammonia, and soft water. Some organic com-pounds can also damage AC pipe materials. The factors affecting external chemical attack of AC pipes are similar to those influencing internal attack, i.e., pH, alkalinity, and sulphates contained in the soils or groundwater can damage AC pipe materials (Jarvis 1998). The chemical processes either leach out components of the cement material or pene-trate the pipe wall to form products that weaken the cement matrix (Mordak and Wheeler 1988). Pinholes on pipe walls are indicators of chemical attack.
Site-specific physical conditions will also influence the failure of AC water mains. For example, Kettler and Goulter (1985) observed that the condition of AC water mains wors-ened with pipe age and a linear relationship was identified between the breakage rate and the pipe age. It was also noted by Guan (1995) and Mordak and Wheeler (1988), among others, that the breakage rate of AC pipe was influ-enced by pipe diameter, whereby a lower breakage rate was observed in larger pipe diameters. This low rate was attrib-uted to the thicker wall and higher bending inertia associated with larger diameter pipes (Mordak and Wheeler 1988).
The AC water mains may also fail because of other site-specific operational, environmental, and physical factors. It was observed by Mordak and Wheeler (1988) that the tem-poral distribution of failures through the year occurred fairly randomly in areas with coarse-grained cohesionless (i.e., sand or gravel) soils, whereas most failures occurred during the dry summer months in areas with clay soils. Clay soils were also associated with a high incidence of circumferential frac-tures that were commonly related to bending stresses (Mordak and Wheeler 1988). Construction and repair methods may also contribute to the failure of AC water mains, e.g., uneven support due to poor compaction of bedding materials may contribute to bending failures of the pipes (Mavin 1996; Guan 1995). Similar to the breakage of metallic pipes, AC pipe breakage is more likely to occur when the environmental and operational stresses act upon pipes whose structural integrity has been compromised by corrosion, degradation, inadequate installation, or manufacturing defects (Rajani and Kleiner 2001).
In this paper, the factors that contribute to the failure of AC water mains in the City of Regina are analyzed. Historical failure data were collected and correlated with their
corre-sponding environmental setting, including soil type, water quality, climate, and construction and maintenance practices. As a result of the analysis, the predominant factors that in-fluence AC pipe breaks in the City of Regina are identified. The factors thus identified here will be further investigated and modeled to help understand the deterioration and failure processes for AC water mains and to improve the manage-ment of these assets.
Asbestos cement pipes in Regina
History
Asbestos cement pipe was adopted for use in Regina, Saskatchewan, Canada, in the mid-1940s. Since it was con-sidered by the city to have better performance than cast iron (CI) pipe, particularly in terms of its resistance to chemical attack, AC pipe was used in new subdivisions and to replace the failed CI pipes until the mid-1980s. Asbestos cement is currently the major material in the City of Regina water dis-tribution system and has a total length of 531 km, represent-ing about 65% of the system. The next two major pipe materials are polyvinyl chloride (PVC) and CI, about 29% and 4% in length, respectively. The rest (2%) of the pipe materials are reinforced concrete, high density polyethylene, and steel. The typical pipe burial depth is around 2.4 to 3 m.
Figure 1 shows the length of AC pipes installed each year and their cumulative length (inventory in a given year). The AC water mains were first installed in Regina in 1945, and the annual installation rate increased rapidly to an average of 20 km/year from 1952 until the early 1980s. The highest annual installation length was 42.8 km in 1976. After that, the installation length was reduced gradually to zero in 1988. Most AC water mains currently in service have ages ranging from 25 to 50 years. It should be noted that the annual installation lengths may not be accurate (i.e., they may be lower than the actual installation lengths), especially for the earlier period, because of water-main replacement. Some AC water mains have been replaced during repair operations and their records were removed from the database of the City. The annual installation lengths shown in this figure represent the installed AC water mains that are still in use.
The AC pipe sizes used in Regina include 100, 150, 200, 250, 300, and 400 mm diameters. The 150 and 200 mm diameter pipes comprise 87% of the AC pipes in use. There are only a few sections of 100 and 400 mm diameter pipes. The percentage of each pipe size over the total AC pipe length is shown in Fig. 2.
Data collection
The information used in this research was acquired mainly from the Engineering and Works Department of the City of Regina. The data recorded in the water-main repair reports include leak location, leak report date and repair date, pipe material, size, leak type, repair material and length, and service connection information. The installation year information for each AC water main was extracted from a geographical information system database that contains all current in-service water mains. However, since the mid-1980s, some AC water mains have been replaced with PVC pipes and the
installa-tion year informainstalla-tion for the original AC mains was not available.
Water quality data were obtained from the annual reports by the Buffalo Pound Water Treatment Plant, which has been the primary water supply source since 1954. For a large part of the year, all water supplied to the city comes from Buffalo Pound Lake. The secondary source of water, which is now used as sparingly as possible during periods of high water demand, has been pumped from a number of large wells located around the city. Since the amount of groundwater used during any given year was strictly related to the sum-mer demand and has been reduced to less than 1% of the total annual volume supplied since 1999, only the water quality data from Buffalo Pound Water Treatment Plant were used to represent the quality of the water conveyed by AC pipes.
Climate (temperature and precipitation) data were obtained from Environment Canada and were recorded at the Regina International Airport in the western part of the city.
Breakage pattern of asbestos cement water
mains
The terms “failure” and “break” are considered here to be identical and used interchangeably in this paper. A failure or break is taken to correspond to an entry on a water-main repair sheet and constitutes a single repair event.
Seasonal and annual breakage
Figure 3 shows two sets of breakage rate data for AC water mains from 1980 to 2004: one for annual breakage rate and another one for winter season breakage rate in breaks per kilometre. Annual breakage rate is defined as the ratio of the total breaks in a year (from January to December of the year) divided by the total length of AC water mains at the end of the year, while the winter season breakage rate in a year is the ratio of the total breaks in the winter season (from November of the previous year to March of the year)
Fig. 2. Percentage of each pipe size over the total asbestos cement (AC) pipe length.
over the total length of AC water mains at the end of the season.
The plot of the annual breakage rates indicates that the breakage rates vary from year to year, with break peaks fol-lowed by one or more years of low breakage rates. The two highest annual rate peaks occurred in the last 5 years, one in 2001 and the other in 2003. The general trend toward increased breakage rates indicates that the condition of the AC water-main network of the city is deteriorating. Although the winter-season breakage-rate data show a general trend of breakage increase similar to that of the annual one, their fluctuations are much smaller and their peaks differ from those of the annual ones in some years.
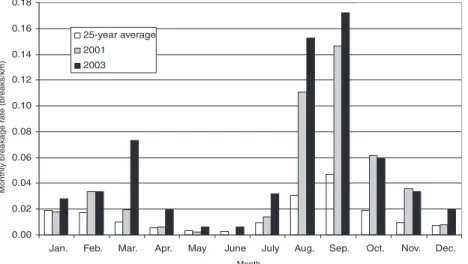
Monthly breakage
The monthly breakage rates of AC water mains in Regina are shown in Fig. 4. There are three curves, which represent the monthly breakage rates for 2001, 2003, and the average of the monthly rates for the 25-year period from 1980 to 2004, respectively. The monthly break data for 2001 and 2003 are included for comparison because of the high break-age rates in these 2 years. Figure 4 shows that increased monthly breakage rates occur late in the summer season. The monthly breakage-rate data in Fig. 4 suggest that there is a small second peak in water-main breaks during the winter season, especially in the abnormal 2 years. The high-est breakage rate of water mains occurred in September.
Spatial distribution
Figure 5 presents the breakage distribution of the AC water mains in the city area during a one-year period in 2003. It can be seen from Fig. 5 that the water-main breakage was not evenly distributed within the city. The breakage of AC pipe was most serious in the southern area (the Whitmore Park–Hillsdale (W–H) subdivision). Other areas that have a high concentration of AC pipe breakage include the central, central west, and west parts of the city. These areas were the earliest ones constructed using AC pipes. The southeast and
northwest areas were developed since the 1980s and PVC pipes were used.
Failure modes
All AC pipe breaks were divided into five categories: longi-tudinal, circumferential, hole, joint, and other. The terms, circumferential and longitudinal, indicate the orientation of a crack in the pipe, with circumferential being across the pipe and longitudinal along its length. Circumferential breaks are, typically, the result of bending stress (beam failure) due to soil differential movement or inadequate bedding support. Internal pressure and external loads (soil cover, live loads caused by traffic, and frost loads by frozen soils) are possible causes of longitudinal breaks. Holes include blowouts and pinhole leaks. Although blowouts and pinhole leaks are both primarily due to chemical attack, their failure modes are dif-ferent. A blowout failure requires internal pressure loading, whereas pinhole leaks constitute a failure due to chemical attack only. Joint failure includes joint leaking, collar split-ting, and joint disconnection. A few breaks were character-ized as “other”, which include everything from subsequent leakage of clamped repair location to construction damage. Table 1 lists the different failure modes and their corre-sponding percentages. Among the 2288 breaks from 1980 to 2004, circumferential breaks comprise the predominant failure mode (91.4%).
Pipe size
The relative number of pipe breaks for different pipe sizes (150, 200, 250 mm and other diameters) was also analyzed. Table 2 shows that most breaks occurred in the 150 mm diameter pipes and more than 94% of the breaks were in the 150 and 200 mm diameter pipes. The percentage of 150, 200, and 250 mm diameter pipe sizes in the current inven-tory of the City of Regina is 62.9%, 23.7%, and 11.9%, respectively (Fig. 2). Based on the number of breaks for each pipe size and the total length of each pipe size in the current inventory, Table 2 gives the average number of breaks per unit length per year for AC water mains. The average
breakage rate decreases with increased pipe diameter, which agrees with the observations presented by previous researchers (Guan 1995; Mordak and Wheeler 1988).
Analysis of contributing factors
In the previous section, the breaks in AC water mains in the City of Regina were analyzed in terms of their yearly, monthly, spatial, and pipe size patterns, and the breakage patterns are summarized accordingly. These breakage pat-terns, along with other patterns identified in a review of the repair records and during field observations of repairs in 2004 and 2005, are further explored and analyzed in this section to identify the contributing factors.
Pipe age
For a given set of circumstances, it is expected that break-age rate would increase with pipe break-age because of the
accu-mulated damages caused by the physical, environmental, and operational conditions. Figure 6 presents the average pipe breakage rates for four vintage groups for both the City of Regina as a whole and for the Whitmore Park–Hillsdale (W–H) subdivision only. The general trend is that the older the pipe age, the higher the pipe breakage rate. The positive relationship between pipe age and pipe breakage rate is cor-roborated by the observation in Fig. 3, which indicates a trend of increasing breakage rate with time. The W–H area had a breakage rate more than twice that of the City as a whole for the 1955–1964 age group.
The relatively high breakage rate for pipes installed from 1975 to 1984 is not clearly understood and needs to be fur-ther explored. The current investigation does not take into account the possible effects of differences in manufacturing, construction and operational conditions, if any.
Chemical attack
Chemical attack is generally a concern for most buried pipes because of the complex environments a pipe may encounter during its service life. The chemical quality of conveyed water and the geochemistry of the groundwater and soils around the pipes may have the potential to attack the pipe and cause either reduction in thickness or loss of strength. The American Society for Testing and Materials (ASTM) and the American Water Works Association (AWWA) standards consider four factors, which cause environments that are aggressive to AC pipes, including internal and exter-nal water, exterexter-nal soil conditions, and the soluble sulphate content of water and soils (ASTM 1998; AWWA 2003). The effect of these factors on the structural integrity of AC water mains in Regina is discussed below.
Internal water quality
Asbestos cement pipes are known to deteriorate when conveying certain aggressive waters. Soft and acidic waters attack AC pipes through the leaching of lime and calcium silicate hydrates from pipe walls into the surrounding soil. Sulphates react with calcium silicate hydrate, the main strength-giving mineral of the cement matrix, to form a product that has a much lower strength. Also, sulphates can react with various minerals in the cement to form sulphate minerals of
Fig. 5. Spatial distribution of asbestos cement (AC) water-main
breaks in 2003.
greater volume, causing swelling and the subsequent disinte-gration of the cement matrix (Nebesar 1983).
The aggressiveness of conveyed water to AC pipe can be quantified using a water aggressiveness index, AI (AWWA 2003):
[1] AI = pH + log(A H)
where pH is the pH of the water, A is the total alkalinity in milligrams per litre as CaCO3, and H is the calcium hardness
in milligrams per litre as CaCO3. When • AI ≤ 10, water is considered very aggressive;
• 10 < AI < 12, water is considered moderately aggressive; and
• AI ≥ 12, water is considered non-aggressive.
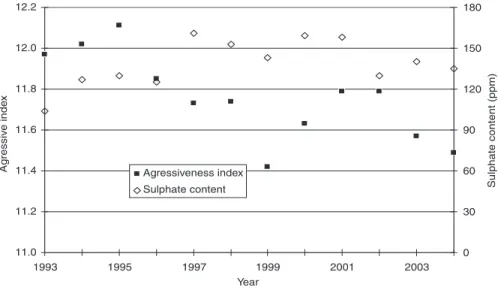
The water quality data for the city were obtained, and its AI was calculated and plotted in Fig. 7 for the period of 1993 to 2004. The AI ranges from 11.4 to 12.1 with an aver-age of 11.7, representing a non-aggressive to moderately aggressive environment to AC pipes for that time period.
Also shown in Fig. 7 are the soluble sulphate content values for the water, which have an average value of 140 ppm over the 1993 to 2004 time period and a maximum value of 161 ppm in 1997. The soluble sulphate content values
repre-sent a non-aggressive to mildly aggressive environment to AC pipes according to the two standards.
Both parameters for evaluating the aggressiveness of the water conveyed inside the pipes are either within the non-aggressive or moderately non-aggressive range. Thus, it is expected that the conveyed water may have a small effect on the AC pipes.
External chemical attack
The AC pipe may also be subjected to external damage caused by aggressive soil environments. The ASTM and AWWA standards identified two aggressive soil environments: acidic and sulphate (ASTM 1998 and AWWA 2003).
Soils that are acidic can damage AC pipes through the leaching of lime and calcium silicate hydrates from external pipe surfaces into the surrounding soil. Soils with sulphates also react with calcium silicate hydrate and other minerals in the cement, and therefore cause either reduced strength or disintegrated cement matrix (Jarvis 1998).
The pH values of soils in Regina range from 7.2 to 7.8 (Ellis 1965), indicating a non-acidic soil environment. Sul-phate content varies with location in the City of Regina, but an average value of 1500 to 2000 ppm, with some places having values of 5000 to 10 000 ppm, has been reported
Failure modes
Longitudinal Circumferential Hole Joint Other Total
No. of breaks 19 2092 15 123 39 2288
Percentage of total breaks (%) 0.8 91.4 0.7 5.4 1.7 100
Table 1. Asbestos cement failure modes.
Diameter
150 mm 200 mm 250 mm Other* Total
No. of breaks 1848 307 56 77 2288
Percentage of total breaks (%) 80.8 13.4 2.4 3.4 100 Average breakage rate (breaks/km/year) 0.219 0.097 0.037
*Other includes 100, 300, and 400 mm diameter pipes and pipes without recorded sizes.
Table 2. Number of breaks of various diameter pipes (1980–2004).
(Chang2). These sulphate content ranges represent a
gener-ally mildly aggressive environment with a slightly moder-ately aggressive soil environment to AC pipes in areas with sulphate content greater than 2000 ppm.
In general, the internal and external factors discussed above indicate a non-aggressive to mildly aggressive chemical environment, although some values are in the category of moderately aggressive to AC pipe. It is possible that some form of chemical attack may have occurred to the AC pipes and the structural integrity of the pipes would thus have been compromised. The small percentage (0.7%) of failures pri-marily due to chemical attack (e.g., holes as observed in Ta-ble 1) corroborates this observation. The decreasing rate of pipe breakage with increasing pipe diameter (Table 2) may also be related to the higher resistance to chemical attack as-sociated with a thicker wall because it takes a longer time for the chemicals to penetrate the thicker wall. As well, other failures may be partially attributed to the chemical at-tack because the failures may have not occurred if the struc-tural integrity of the pipes had not been compromised by such deterioration.
Regina clay
The soil in Regina is a montmorillonite type clay (Regina clay), with montmorillonite making up approximately 53% of its mineralogical composition (Fredlund 1976). With the addition of water, this clay mineral can experience a 25% to 50% expansion in soils that contain various other minerals and organic matter (Keller 1996). Unfortunately, a volume increase of only 3% can potentially damage light structures with shallow foundation and requires special design consid-erations (Brown 1984). As is described in the next section, the soil water content in Regina may fluctuate significantly: the water content is commonly close to the plastic limit of 25% for the soil (Fredlund 1976). However, under extremely dry conditions, the water content can drop to less than 10% and, under extremely wet conditions, it can exceed 50% near ground surface. The high potential volume change, coupled
with the climate conditions in Regina as discussed in the next section, indicates that the soil has the potential for con-siderable swelling and shrinking.
The resulting changes in soil volume can induce soil move-ment that, in turn, can cause the developmove-ment of stresses in buried pipes. Effects include
• Uneven support of the pipe (non-uniform bedding sup-port), causing it to be supported only at certain points along its length. When such a situation arises, the pipe acts as a beam. Axial bending stress in the pipe can be produced because of the bending moments thus created. • Soil movement in one area relative to another, causing one
part of a pipe section to move with respect to another part, or one pipe section with respect to the next pipe (differen-tial movement), thus inducing not only high bending moments but also shearing forces.
Since non-uniform soil bedding support or differential soil movement is typically related to longitudinal bending or beam action, failures induced by the stresses generated by these effects would be expected to be most common during periods of large change in soil moisture content. The high incidence of circumferential failures (Table 1) is consistent with such external loading that impose bending stresses on the pipes. The decreasing tendency of pipe breakage with increasing pipe diameter (Table 2) may also be related to the longitudinal bending borne by the AC pipes: a large diameter pipe with a larger moment of inertia will have smaller bending stresses on the pipe, and therefore will have less possibility of circum-ferential failure.
Climate
Mordak and Wheeler (1988) observed that climate was the primary contributing factor behind the annual failure pattern and monthly failure pattern of AC water mains in-stalled in clay soils. Climatic factors are also analyzed here with two climate indices, rainfall deficit and freezing index, which are explored for their relationship with the breakage rate of AC water mains.
Fig. 7. Aggressiveness index and sulphate content values for the period of 1993–2004.
Rainfall deficit
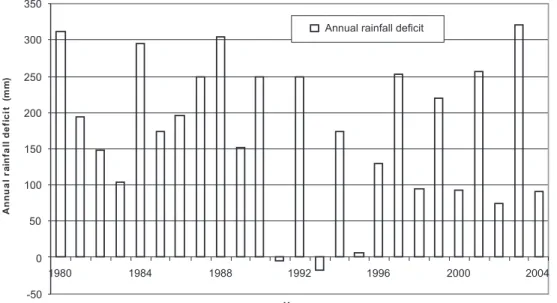
Rainfall deficit, which is a surrogate of soil moisture level, refers to the difference between the moisture that might potentially be used in processes of evaporation and transpi-ration and the amount received in the form of precipitation. The evaporation and transpiration are affected by many fac-tors such as temperature, wind movement, solar radiation received by the leaf surfaces, and the depth and spread of the root system. Thornthwaite developed a formula for cal-culating potential evapo-transpiration from measured values of mean temperature and length of the day (Hamilton 1966; Withers and Vipond 1980). This method is applied here to calculate the annual rain deficit from 1980 to 2004. The cal-culated annual rainfall deficit and average monthly rainfall deficit for the 25 year period are shown in Figs. 8 and 9, respectively. Also included in Fig. 9 are the monthly rainfall deficits for 2001 and 2003.
Figures 8 and 9 shows that, for this period, the annual rainfall deficit varies from –16 to 320 mm, with an average of 172 mm. The months of July and August had the greatest rainfall deficit (except for July 2001). The total rainfall deficits for 2001 and 2003 were 255 and 320 mm, respec-tively, much higher than the average annual rainfall deficit. In 2001, the rainfall deficit in July was negative, followed by extremely high rainfall deficit in August, showing a particularly abnormal temperature and precipitation distribution pattern for that year.
As discussed in the previous section, the Regina clay soil has a very high swelling or shrinkage potential upon moisture change. The high potential volume change, coupled with the large fluctuations in rainfall deficits, may have contributed significantly to the pipe breakage pattern, as shown in Fig. 3. A comparison between Figs. 3 and 8 reveals that almost every annual pipe breakage rate peak in Fig. 3 (1984, 1988, 1994, 1997, 2001 and 2003) corresponds to a rainfall deficit peak in Fig. 8, indicating a strong effect of rainfall deficit on pipe breakage rate. The quantitative analysis of the effect is performed in the next sections.
Freezing index
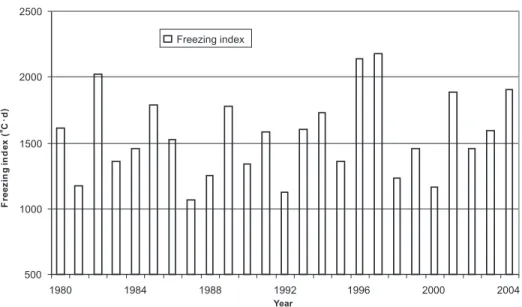
Figure 4 shows that a second peak in pipe breaks occurred during the coldest period of the year for the 25-year average and the abnormal 2 years. This phenomenon has been observed for metallic pipes by many researchers, e.g., Rajani and Zhan (1996) and Selvadurai and Shinde (1993), among others. It has been attributed to increased earth loads on the buried pipes because of freezing and expansion of the water in the ground. The process involves not only the water near the freezing front (0 °C isotherm) but also the moisture around the front through migration toward the freezing front (Shah and Razaqpur 1993).
Historical temperature data analysis for the Regina area indicates that the mean monthly temperature is below 0 °C for 5 months (November, December, January, February and March) of the year. A measure of the severity of these 5 months of the winter season is the freezing index, which is the cumulative average daily temperature below 0 °C during these 5 months. The freezing indices for the winter seasons from 1980 to 2004 were calculated based on the temperature data from Environmental Canada and are shown in Fig. 10. The comparison of the pipe breakage pattern for the winter seasons from 1980 to 2004 (Fig. 3) with that of the freezing index for the same period, as shown in Fig. 10, indicates that every pipe break peak in Fig. 3 (1982, 1985, 1989, 1994, 1996, 1997, 2001 and 2004, except for 2002 and 2003) cor-responds to a freezing index peak in Fig. 10, and therefore indicates a strong effect of cold temperature on AC pipe breakage. The high breakage rate in the 2002 winter season may be attributed to the high pipe break number in the sum-mer season of 2002 (Fig. 3). The crews were busy with more serious break repairs during the summer season and some less serious breaks were left unrepaired until early in the winter season. The extreme dry condition in the 2003 summer season, as shown in Figs. 8 and 9, may have resulted in the high pipe breakage rate in the 2003 winter season. As explained by Kleiner and Rajani (2002), a dry soil (expected after an extreme dry season) will have low latent heat
capacity, and therefore will lead to deeper frost penetration and higher frost load on the pipes. The relationship between the freezing index and the pipe breakage rate in Regina is discussed further in the next sections.
Break clustering
The analysis in the previous sections indicates that the factors, such as pipe age, water quality, soil properties, and climate, may influence the failures of AC pipes in Regina. It was observed by Goulter and Kazemi (1988) that failures themselves may also induce new failures, both in space and time. They called this phenomenon of pipe breaks spatial and temporal clustering and developed a model whereby the first break in such a cluster is considered to be an independent break and subsequent adjacent breaks are dependent breaks. As shown in Fig. 5, the spatial pattern of water-main break-age in the city was not evenly distributed and breaks tended to form clusters. Their approach was applied to the Regina breakage data for temporal and spatial clustering analysis.
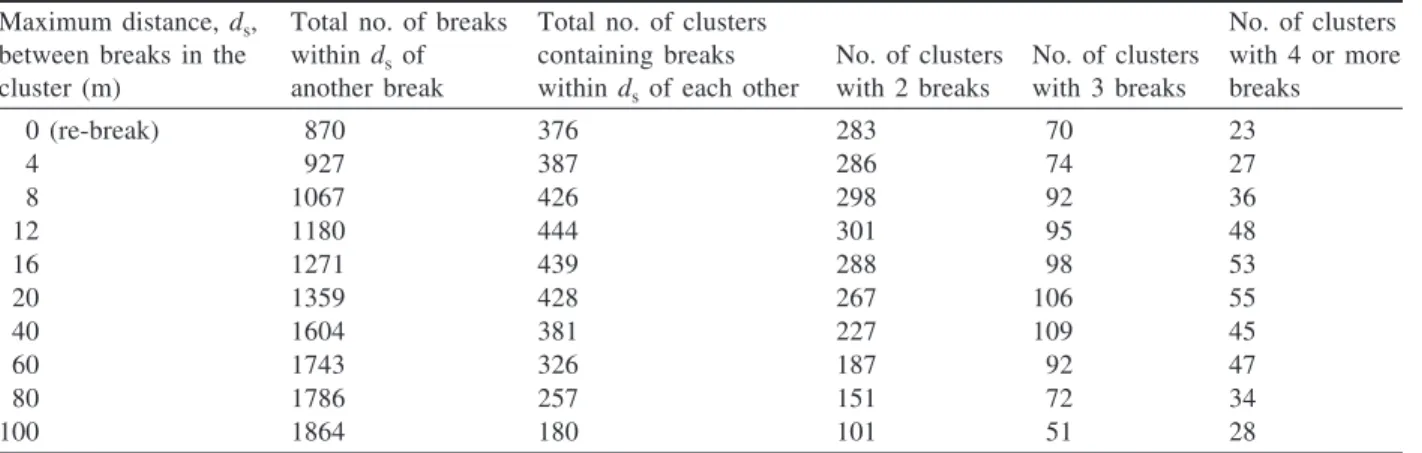
Table 3 lists the number of breaks within a specified distance,
ds, of an earlier break, accounting for clusters with two, three, four, or more breaks. A distance of ds= 0 represents a
re-break at the same location. The table shows that re-breaks (ds = 0) are a significant problem in the water-main system
of Regina. In the 25 year period (from 1980 to 2004), AC pipes had 283 clusters with 2 breaks (i.e., 283 re-breaks), 70 clusters with 3 breaks (i.e., 140 re-breaks), and 21 clusters with 4 or more breaks (21 clusters with four breaks and 2 clusters with 5 breaks in this case; i.e., 71 re-breaks) at the same location. The total number of re-breaks (283+140+71) constitutes 21.6% of the total breaks. The high incidence of re-breaks suggests that the occurrence of a first break is a strong indicator of an increased potential for further breaks at the same location as the first break. The primary cause of the increased number of subsequent breaks after an initial break is believed to be related to disturbances to the sur-rounding soil, as a result of the failure itself and the repair process (Goulter and Kazemi 1988). The re-breaks may be affected by the leakage of water from first breaks. Such leakage can cause erosion of bedding material or change the
Fig. 10. Freezing indices for winter seasons from 1980 to 2004.
moisture condition in the surrounding environment, thus causing differences in the way the soil expands or contracts relative to the “undisturbed” condition. Also, adjacent pipe sections may be affected by compaction vibration forces during the compaction of backfill for the repair of first breaks. Moreover, any repairs in the winter season are diffi-cult to do and may expose the surrounding soils to the freez-ing temperatures. This point will be further explored in the following section of this paper.
Table 3 also shows that with an increase in distance, ds,
between breaks in a cluster (i.e., the farthest distance from the initial breaks), the total number of breaks included is increased, but the number of clusters may decrease because some clusters that were originally independent but close to each other merged to form one cluster with a larger number of breaks. The ratio of the change in number of breaks with the change in spatial interval, which is called the “marginal-spatial-breakage rate” by Goulter and Kazemi (1988), is an important indicator of the spatial clustering of pipe break-age. A decreasing-marginal-spatial breakage rate indicates that the spatial distribution of pipe breakage is clustered, while a constant rate represents an evenly distributed pipe breakage pattern. The marginal-spatial-breakage rate, RS
s d, is defined as [2] RS TSF TSF s s s d d d = − − 2 1 2 1
where TSF1 is the total number of breaks within ds
1 of
another failure; TSF2 is the total number of breaks within
ds
2of another failure; and ds1and ds2 are the smaller and
larger distances between breaks, respectively.
Figure 11 shows the marginal-spatial-breakage rates versus maximum distance ds for the city, as a whole and for the W–H area alone (RSdsvalue is plotted at the midpoint of the
interval between ds
1 and ds2). From this figure, it can be
seen that a generally decreasing marginal-spatial-breakage rate with spatial interval is observed for the city as a whole. The decreasing-marginal-spatial breakage rate reveals a spatial clustering, indicating that an initial break leads to not only subsequent breaks at the same location but also more breaks in the vicinity of the initial break. The same reasons as detailed in the previous paragraphs may explain this phe-nomenon as well, i.e., water leakage, activities of heavy machines, difficult winter repairs, and freezing weather effect.
The closer to the first break, the more significant these effects may become. Compared with the marginal-spatial-breakage rate pattern in the city wide, a much smaller fluctu-ation in marginal-spatial-breakage rate was observed in the W–H subdivision, indicating that the spatial distribution of pipe breakage in this area is relatively homogeneous.
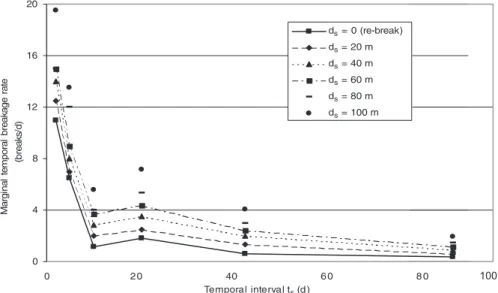
As seen from the previous sections, the marginal-spatial-breakage rate is an indicator of pipe marginal-spatial-breakage clustering in space, but it does not include the time factor; therefore, it cannot distinguish among the different effects of two earlier breaks (e.g., one that occurred in 1980 and another in 2003), on the third break (e.g., in 2004), all at the same location. For this purpose, the concept of temporal clustering is intro-duced and analyzed. Table 4 shows the number of pipe breaks with time (ts) for a specified maximum distance (ds). From Table 4, it is noted that almost half of the breaks (62/129) within the first 7 d are re-breaks and that even at 120 d about one-third (137/513) of the all the breaks are re-breaks, indi-cating a strong temporal effect of first breaks on subsequent breaks.
The strong temporal clustering for pipe breaks in Regina can also be observed from the trend of marginal-temporal-breakage rate versus temporal interval. Marginal-temporal-breakage rate is defined as follows (Goulter and Kazemi 1988): [3] RT TTF TTF s s s s s s t d d d t t = − − 2 1 2 1 Maximum distance, ds, between breaks in the cluster (m)
Total no. of breaks within dsof another break
Total no. of clusters containing breaks within dsof each other
No. of clusters with 2 breaks No. of clusters with 3 breaks No. of clusters with 4 or more breaks 0 (re-break) 870 376 283 70 23 4 927 387 286 74 27 8 1067 426 298 92 36 12 1180 444 301 95 48 16 1271 439 288 98 53 20 1359 428 267 106 55 40 1604 381 227 109 45 60 1743 326 187 92 47 80 1786 257 151 72 34 100 1864 180 101 51 28
Table 3. Spatial clusters of breaks.
where TTF s
1
d
is total number of breaks within ts
1 and ds of
another failure; TTF s
2
d
= total number of breaks within ts2 and ds of another failure; ts
1 and ts2 are the shorter and
longer temporal intervals between breaks, respectively. The increment of the number of breaks with an increase in tem-poral interval between breaks is indicated by RT ss
t d
. Figure 12 shows the marginal-temporal-breakage rates versus temporal interval for different dsvalues for the entire city (the W–H area has a marginal-temporal-breakage rate pattern similar to that of the entire city, but is not shown here). The figure shows that the marginal-temporal-breakage rate decreases with an increase in time, especially in the first two weeks, indicating a strong temporal clustering character-istic of the pipe breakage pattern in Regina. The temporal clustering of pipes is also a strong indication that the occur-rence of a break greatly increases the chance of subsequent breaks within a relatively short time following the first break. The pipe can be weakened by the break itself, whereas the pipe bedding is often disturbed by water leaking from the previous break and by physical disturbance during the repair process (Goulter and Kazemi 1988).
It should be noted that the clustering effects and re-break percentages presented above are conservative. The data used have included only those breaks that occurred in the system from 1980 to 2004. There may be breaks that should be cate-gorized as re-breaks because of the previous breaks at the same locations that occurred prior to 1980. Therefore, it is
expected that the clustering effects and re-break percentages are even more serious than they appear in these results.
Construction specification and repair practices Construction specifications
Construction specifications are an important factor influ-encing the condition and performance of AC water mains. One indicator of the effect of construction specifications on the working environment of buried pipes is the subsidence after trench reinstatement. A report for the City shows that the 24 trench reinstatement sites constructed from 1986 to 1991 had subsided by 5 to 150 mm in 1992 (Clifton Associ-ates 1992). Construction practices, such as inadequate com-paction during backfill were identified as primary reasons for the problem. However, construction specifications also contributed significantly to the subsidence. The report indi-cated that 50 to 60 mm of subsidence per metre of clay or granular backfill could be expected with the construction specifications used at that time. The subsidence differential between the backfill and the surrounding native soils pro-duces shear and bending loads on the buried pipes due to different soil movement and uneven bedding. The City of Regina has changed its specifications to prevent this prob-lem, e.g., lift thickness was specified to be a maximum of 150 mm for all backfill materials (native and granular) in its 2004 edition, compared with a maximum 300 mm thickness
Total no. of breaks for:
Maximum time between breaks ts(d)
Maximum distance between breaks, ds, (m) 1 3 7 14 28 60 120
0 (re-break) 14 36 62 70 95 114 137 20 24 49 77 91 126 168 205 40 28 56 88 108 157 221 276 60 28 58 94 120 181 258 326 80 30 60 108 136 211 305 391 100 36 75 129 168 268 398 513
Table 4. Temporal clusters of breaks.
for native backfill in its 1989 edition and 450 mm for granu-lar backfill in its 1990 edition.
The data also indicated that some repairs (5.1%) were required in pipes adjacent to other structures such as gate valves and hydrants. This may have been due to differential settlement between the pipes and the appurtenant structures to which the pipes were rigidly connected. The appurtenant structures are generally blocked with wood, brick, or con-crete anchors, and therefore have a relatively solid bedding. However, the bedding conditions for the AC water mains connected to the structures can vary significantly along their length. The part of the water main connecting to the valves and hydrant is almost fixed, whereas the remainder of the water main is supported by clay, sand, or gravel materials.3
These bedding materials were generally not well compacted (because of concerns about damage to the water main) and had the potential for substantial settlement.
Repair practices
Improper construction and the effects of repair are also important factors when the water-main conditions are assessed. It was found from the records that, among the re-breaks, about 40% were previously repaired (including the first repair and subsequent re-repairs) during the winter months (November to March inclusive) when the average monthly temperature is below 0 °C. This is a high percentage con-sidering the fact that this is only a 5 month period of the year and most breaks occur during the summer season. The high number of repairs done in winter needing to be re-repaired may be because the quality of the repairs, the back-fill materials, and the compaction efforts were significantly compromised by the freezing weather conditions, producing a poor environment for the repaired and adjacent AC pipes.
Discussion
From the analysis of the AC water-main breakage pattern in Regina, different factors are identified that may contribute to the observed pattern of pipe failures. Some of the factors were static, such as soil type. Other factors were dynamic, such as temperature and soil moisture. Static factors can be associated with steady, continuous deterioration process. While the effect of dynamic factors tends to average out in the long run, it may induce the fluctuation of pipe failures within a short term, such as for the annual pipe break peaks observed in 2001 and 2003 (Fig. 3).
A water-main-renewal-planning (WARP) software tool was developed by National Research Council Canada (Rajani and Kleiner 2001). In this tool, a multi-variate exponential model
is used to simulate various dynamic or time-dependent factors contributing to the main breaks and to predict water-main breaks based on historical break data. In this study, this software was run to examine some of the factors identi-fied in previous sections and to determine if the model used in the package is appropriate for the analysis of AC pipe fail-ures. The factors examined included
• Background ageing, expressed in terms of the increase of breakage rates over time. This is a surrogate measure of the static factors (e.g., pipe material, diameter, soil type, etc.) affecting the deterioration of the pipe in a steady, continuous manner.
• Freezing index (FI) from daily temperature, a surrogate measure for the severity of a winter in a given year. • Rainfall deficit (RD) from daily temperature and
precipi-tation, a surrogate measure for soil moisture level. Two types of RD values are used. One is cumulative RD, which depicts the average soil moisture during any given year. The other is a snapshot RD, which depicts the rainfall def-icit at the beginning of the freezing season.
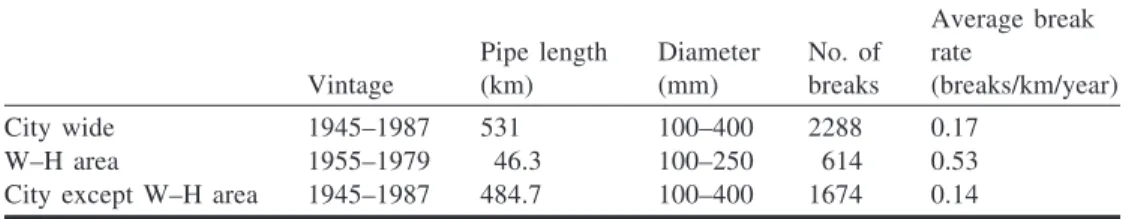
Three data groups were established: City wide, W–H sub-division, and City except W–H subdivision. The W–H subdi-vision was analyzed to identify the possible factors specific to this area because this area has a much higher breakage rate than that of the city as a whole, as shown in Fig. 5. Figure 11 also indicates that the marginal-spatial-breakage rate pattern is also different from the city as a whole. The vintage, lengths, diameter, and number of breaks within each of the data groups are summarized in Table 5.
The historical breakage analysis for different combina-tions of factors was performed and the results are shown in Fig. 13 and Table 6. Figure 13 shows the case with all the factors being included (City wide). It can be seen from this figure that
• the smooth curve, which represents the background ageing with an initial breakage rate of 0.056 breaks/km (in 1980) and an ageing rate of 0.074 or approximate 7.4%, represented the general trend of the water-main breaks in Regina.
• the most striking is the high value of the coefficient for the cumulative RD (0.518). This is a clear indication that moisture depletion has a high impact on pipe breakage rates in the highly swelling and (or) shrinking soils of Regina. It is consistent with the strong climate influence on AC water-main breaks as discussed in the previous analysis.
• a relatively small value of the coefficient for FI (0.009) suggests a minor impact of the winter temperature on the
Vintage Pipe length (km) Diameter (mm) No. of breaks Average break rate (breaks/km/year) City wide 1945–1987 531 100–400 2288 0.17 W–H area 1955–1979 46.3 100–250 614 0.53 City except W–H area 1945–1987 484.7 100–400 1674 0.14
Table 5. Principal characteristics of the data groups for WARP analysis.
3Although construction specifications as early as 1959 stipulated that pipe be bedded on a layer of sand covering the bottom of the trench to
a depth of about 100 mm and bring up the sides of the pipe to at least half its diameter, it was observed during field investigation that speci-fications were not strictly implemented, and in some cases no sand was found when the trench was re-excavated for repair.
observed breakage rate. This is contradictory to the strong freezing temperature effect observed in the previous analysis. The reason for this contradiction may be because of the factor that the total number of pipe breaks for all the winter seasons for the 25 year period was about 34% of the total breaks in the city for this period. The relatively small percentage of pipe breaks in the winter seasons provided a relatively small weight when the correspond-ing annual breaks were used to correlate with the freezcorrespond-ing index of the winter seasons.
• the high value of the coefficient for the snapshot RD (–0.448) (although it is counter-intuitive negative) may indicate that the moisture that is locked in the soil during the winter months plays a major role in pipe breakage. This factor, coupled with the FI, may have contributed to the second peak of the average pipe breakage curve during the winter season, as observed in Fig. 4.
• the quality of the model “fit” in the break history analysis (adjusted coefficient of determination, ra2= 0.774) is quite
high for this type of analysis.
The influence of each of the factors on the pipe breakage rate in the W–H subdivision was also analyzed and the coefficients corresponding to the contributing factors are listed in Table 6. The table suggests that W–H subdivision has a higher initial breakage rate and a higher ageing rate than the rest of Regina. A much higher FI in this area was also noted, which may be attributed to the higher percentage of breaks (42%) in the winter seasons in this area. The higher adjusted coefficient of determination (ra2), which is an indication of a
better quality of model fit, may suggest that the population
of pipes in W–H area, as well as the causes for breaks are rather homogeneous compared with the entire City of Regina. It may be one of the reasons behind the relatively homoge-neous spatial distribution of pipe breakage in this area as pointed out in the analysis of the marginal-spatial-breakage rate pattern for this area.
The analysis of historical break data by the software tool serves two purposes. First, it confirms quantitatively the pre-vious observation and analysis that climate (precipitation) strongly influences the pipe breaks in Regina. Secondly, the good capture of the breakage pattern by the software tool for the Regina data indicates that it may be a good tool for short-term operational forecasting and long-term renewal planning of the AC water-mains in Regina.
Summary and conclusions
The historical failure data for asbestos cement water mains in the City of Regina were collected and analyzed for the time period from 1980 to 2004 to assess the failure charac-teristics and identify the factors that significantly influence the breakage of these water mains. Two different approaches were used in the analysis: one based on the influence of external factors, such as soil, water quality, and climate; and the other on the influence of pipe failures themselves, such as temporal and spatial dependence of subsequent breaks on the initial break.
The analysis of the historical failure data suggests that the condition of the AC water mains in the City of Regina is deteriorating, with the number of failures increasing
annu-Fig. 13. Background ageing and year-to-year variations in water-main breaks.
Coefficients City wide W–H area City except W–H area
Breaks/km 0.056 0.122 0.042
Ageing rate for old pipe 0.074 0.092 0.068 Rainfall deficit (RD) – cumulative 0.518 0.435 0.509 Rainfall deficit (RD) – snapshot –0.448 –0.534 –0.398 Freezing index (FI) 0.009 0.112 –0.055 Adjusted coefficient of determination (ra2) 0.774 0.892 0.620 Table 6. Coefficients for Regina water-main breakage data.
ally. In the years 2001 and 2003, the city recorded the two highest water-main break numbers in its history. Even if these 2 years are excluded, the general trend of increase in AC water-main breakage in the last decade is still quite apparent.
The primary causes of the AC water-main break patterns are considered to be related to the properties of Regina clay and the effect of its climate. Regina clay has a very high swelling and shrinkage potential upon moisture change. During the summer season, especially July, August and September, rainfall in Regina is insufficient to offset water losses to evapo-transpiration that leads to losses in soil moisture. The moisture losses will result in shrinkage of the clay soils and, thus, soil movement, which, in turn, induces additional stress on water mains. Differential soil movement is indicated to be the primary cause of the high incidence of circumfer-ential failures and the large proportion of failures on small diameter mains. Stresses due to frost penetration have also an effect on water-main breakage in the winter season and may have contributed to the relatively high pipe breakage in the winter period of some years.
For the conveyed water and soil pore water, the water aggressiveness indices ranged from moderately aggressive to non-aggressive to AC pipes. It is possible that some chemical attack may have occurred and detrimentally affected the struc-tural integrity of the AC water mains.
Based on the historical data, the occurrence of an initial failure increases the potential for further failures in the pipe in an immediately adjacent location and most subsequent failures will occur within a relatively short time following the first failure. This is probably because of the disturbances occurring in the surrounding soil as a result of the first failure itself and the subsequent repair operations.
Construction specifications and repair practices were also found to be important factors when the pipe failure historical patterns in Regina were analyzed. These factors may influ-ence the pipe failure patterns themselves, and the effect may become more severe when combined with particular soil and climate factors. The fact that a larger number of failures occurring in winter months were re-repaired also suggests that particular attention should be given to bedding replace-ment practice in those months.
Acknowledgements
The authors acknowledge the help offered by Mr. Shawn Koroluk, Mr. Stan Baldry, Mr. Dewey Posehn, Mr. Brian Scherle, Mr. Roberto Figueroa, and Mr. Troy Freniere of the City of Regina Engineering and Works Department, Mr. Dan Conrad of the Buffalo Pound Water Treatment Plant, during the data collection. Thanks also go to Drs. Jon Makar, Yehuda Kleiner and Balvant Rajani of NRCC for their comments and suggestions.
References
ASTM. 1998. Standard test methods for asbestos-cement pipe. ASTM C500-98, American Society for Testing and Materials (ASTM), Philadelphia, Pa.
AWWA. 2003. Standard for asbestos cement distribution pipe 4” through 16” for water and other liquids. AWWA C400-03, American Water Works Association (AWWA), Dever, Colo. Brown, R.W. 1984. Residential foundations. Van Nostrand Reinhold,
New York, N.Y.
Clifton Associates Ltd. 1992. Geotechnical report: trench reinstate-ment study in City of Regina. Clifton Associates Ltd., Regina, Sask.
Ellis, J.G. 1965. The Soils of the Regina map area: 72I Saskatchewan. Modern Press, Saskatoon, Sask.
Fredlund, D.G. 1976. Engineering properties of expansive clays. In Shallow Foundations on Expansive Soils: Design, Construction and Performance: Proceedings of a Seminar, Regina, Sask., 27–28 October 1976. pp. 3–64.
Goulter, I.C., and Kazemi, A. 1988. Spatial and temporal group-ings of water main pipe breakage in Winnipeg. Canadian Journal of Civil Engineering, 15: 91–97.
Guan, X. 1995. Condition and replacement of Regina’s water distribution system. M.Sc. thesis, The University of Regina, Regina, Sask.
Hamilton, J.J. 1966. Soil moisture depletion calculations for Winnipeg, 1960–1963. Technical Paper No. 229, Division of Building Research, National Research Council Canada, Ottawa, Ont. Jarvis, B. 1998. Asbestos-cement pipe corrosion—interim report.
Customer Services Division, Water Corporation, Western Australia, Australia.
Keller, E.A. 1996. Environmental geology. Prentice Hall, Upper Saddle River, N.J.
Kettler, A.J., and Goulter, I.C. 1985. An analysis of pipe breakage in urban water distribution networks. Canadian Journal of Civil Engineering, 12: 286–293.
Kleiner, Y., and Rajani, B.B. 2002. Forecasting variations and trends in water-main breaks. Journal of Infrastructure Systems, ASCE,
8: 122–131.
Mavin, K. 1996. Predicting the failure performance of individual water mains. Research Report No. 114, Urban Water Research Association of Australia, Melbourne, Vic., Australia.
Mordak, J., and Wheeler, J. 1988. Deterioration of asbestos cement water mains. Final report to the Department of the Environment, Water Research Center, Wiltshire, UK.
Nebesar, B. 1983. Asbestos/cement pipe corrosion: part 2—review of recent work on the causes of pipe degradation and on possible improvements. CANMET Report 83-17E, Canada Centre for Mineral and Energy Technology, Energy, Mines and Resources, Ottawa, Ont.
NRCC. 2002. Deterioration and inspection of water distribution systems– best practice. National Research Council Canada, Ottawa, Ont.
Rajani, B.B., and Kleiner, Y. 2001. Comprehensive review of struc-tural deterioration of water mains: physically based models. Urban Water, 3: 151–164.
Rajani, B.B., and Zhan, C. 1996. On the estimation of frost loads. Canadian Geotechnical Journal, 33: 629–641.
Selvadurai, A.P.S., and Shinde, S.B. 1993. Frost heave induced mechanics of buried pipelines. Journal of Geotechnical Engi-neering, 119: 1929–1951.
Shah, K.R., and Razaqpur, A.G. 1993. A two-dimensional frost-heave model for buried pipelines. International Journal for Numerical Methods in Engineering, 36: 2545–2566.
Withers, B., and Vipond, S. 1980. Irrigation: design and practice. 2nd ed. Cornell University Press, Ithaca, N.Y.