Biomass Torrefaction Models: 1. Volatile
and Solid Product Evolution Kinetics
The MIT Faculty has made this article openly available. Please share
how this access benefits you. Your story matters.
Citation Bates, Richard B., and Ahmed F. Ghoniem. “Biomass Torrefaction: Modeling of Volatile and Solid Product Evolution Kinetics.”
Bioresource Technology 124 (November 2012): 460–469. As Published http://dx.doi.org/10.1016/j.biortech.2012.07.018
Publisher Elsevier
Version Author's final manuscript
Citable link http://hdl.handle.net/1721.1/103941
Terms of Use Creative Commons Attribution-NonCommercial-NoDerivs License Detailed Terms http://creativecommons.org/licenses/by-nc-nd/4.0/
Biomass Torrefaction Models: 1. Volatile and Solid Product Evolution Kinetics Richard Bates, Ahmed Ghoniem
Department of Mechanical Engineering, Massachusetts Institute of Technology, Cambridge, MA 02139-4307, USA
ABSTRACT:
Torrefaction is a mild pyrolysis pre-treatment applied to raw biomass which results in a more coal-like product. No published models exist to comprehensively describe the mass, energy and species balance of torrefaction. This paper concerns the development of a model to describe the evolution of solid and volatile product composition during torrefaction conditions between 200-300 ○C. Coupled to an existing two-step solid mass loss kinetic model, the model describes the volatile release kinetics in terms of the actual chemical species, permitting solid product composition to be estimated by species conservation. Volatiles released during the first stage include highly oxygenated species such as water, acetic acid, and carbon dioxide, while volatiles released during the second stage are composed primarily of lactic acid, methanol, and acetic acid. This model enabled further development of a model to describe reaction energy balance and heat release dynamics.
Keywords: Biomass, torrefaction, pyrolysis, kinetics, volatiles Highlights:
Model developed to describe evolution of volatiles during willow torrefaction
Composition of volatiles defined in terms of nine identifiable chemicals
Solid residue composition defined in terms of carbon, hydrogen and oxygen content
Coupled to solid mass loss kinetic rate equations
Corresponding Author: Richard Bates Email: [email protected]
1. Introduction
Torrefaction is a thermochemical pretreatment process which improves biomass utilization characteristics such as gravimetric heating value, grindability as measured by the grinding energy per unit heating value, and hydrophobicity. During torrefaction, biomass is treated at temperatures between 200- 300 ○C, in an inert atmosphere for a period usually between 15-60 minutes.
The relevant process parameters during torrefaction include the temperature, reaction time, heating rate, feedstock, and particle size. The chemical characteristics – including ultimate analysis- of biomass torrefied under numerous combinations of temperature, reaction time, and feedstock have been investigated experimentally by (Prins, 2005; Arias et al., 2008; Bridgeman et al., 2008; Almeida et al., 2010; Medic et al., 2011). Typically, the torrefied product retains 80-95% of the energy and 70-90% of the mass of the original raw biomass. The remaining 10-30% of the mass is released in the form of gaseous species. (Prins, 2005; van der Stelt, 2011) have analyzed the evolution of volatile species released during torrefaction utilizing gas
chromatography (GC) and high performance liquid chromatography (HPLC).
While experimental work on torrefaction is active, few models exist to comprehensively describe the evolution of the volatile products or solid composition and energy balance over a range of conditions. To address this need, we have developed a series of models to assist the study of torrefaction in the following steps:
1. The development of a kinetic model to describe the release of volatiles and the resulting change in composition of the solid product.
2. The development of a thermochemical model to estimate product properties (e.g. specific heat and heat of formation) and reaction energy balance based on the changes in chemical
composition predicted by the volatile release model.
3. Coupling of this thermochemical model to a single particle heat and mass transfer model of torrefaction to study process conditions and particle size effects.
This paper describes the kinetic model of solid and volatile product evolution, which was used as the basis for the subsequent models. Model predictions of solid and volatile product characteristics were compared with published experimental data. Models for the
thermochemistry and single particle torrefaction will be published in follow up articles.
Models for the evolution of the solid product have been developed based on experimental characterization under specific torrefaction conditions and feedstocks. One kinetic model
proposed and validated by (Prins, 2005) describes the solid mass loss of willow during
torrefaction. Following the characterization of torrefied corn stover, (Medic et al., 2011) fitted quadratic regressions relating process parameters (such as initial moisture content, temperature, and residence time) to solid product energy and mass yield. Based on eucalyptus torrefaction experiments (Almeida et al., 2010) showed that solid mass loss can be used as a quantitative indicator of the extent of torrefaction. Several linear regressions were developed relating the mass loss to solid product characteristics (energy yield, heating value, and chemical
composition). These empirical regressions lack generality, nor do they describe the composition of the volatile species.
A detailed multi-step chemical kinetic model of pyrolysis has been developed by (Ranzi et al., 2008); however, its validity under torrefaction conditions, which is associated with slow heating rates and lower temperatures, is unknown. (Neves et al., 2011) developed an empirical
model for biomass pyrolysis products based on fitting of trends of experimental data between (200-1000 ○C). However, of the seven modeled volatile constituents, some pyrolysis products (i.e "tar" and "CxHy")are not defined as readily identifiable chemicals.
2. Model
2.1. Approach
The present approach to model development built upon the existing mass loss kinetics model for torrefaction published in (Prins, 2005). This kinetics model enables accurate prediction of the solid mass balance during torrefaction under kinetically limited conditions in the absence of transport limitations. Within the kinetic mechanism, solid and volatile products are lumped into pseudo components (i.e A,B,C,V1,V2); however, their composition in terms of actual chemical species and the enthalpy of reaction for each step has not been estimated or modeled previously.
Separate volatile composition experiments using HPLC also by (Prins, 2005) reported the cumulative yield of nine chemical species including acetic acid, water, formic acid, methanol, lactic acid, furfural, hydroxyacetone (acetol), carbon dioxide and carbon monoxide which were generated during willow torrefaction under five torrefaction conditions.
The present approach to developing a robust species and energy balance was comprised of three steps:
(1) The identification and analysis of an appropriate solid mass loss kinetics mechanism and parameters for torrefaction from the literature (Section 2.2),
(2) Application of fitting techniques to published experimental data to enable the formulation of a volatile composition model describing the volatile pseudo components (V1 and V2) in terms of nine major chemical species (acetic acid, water, formic acid, etc.) (Section 2.3); and,
(3) The application of species conservation to enable formulation of a solid composition model describing the ultimate analysis of the solid product and its constituent pseudo components, B and C (Section 2.4),
In this way, the complete species balance of torrefaction is represented by a system of ordinary differential equations coupled to the existing two step solid mass loss kinetic rate equations.
2.2. Solid mass loss kinetics model
Identification of an appropriate solid mass loss kinetic mechanism and parameters are crucial to modeling the overall mass balance of torrefaction. Without an accurate model for the mass balance of the process, attempts to model the species or energy balance will be severely limited.
2.2.1. Two step kinetic mechanism
Prins showed that a competitive, two stage, first order mechanism accurately modeled the solid mass loss profiles during kinetically controlled torrefaction conditions of willow:
where A is the raw biomass (willow), B is a solid intermediate reaction product, C is a residual solid product, and V1 and V2 represent volatiles. This kinetic mechanism was originally
proposed by (Di Blasi and Lanzetta, 1997) to describe pure hemicellulose decomposition. Prins’
A B V2 V1 C 𝑘1 𝑘2 𝑘𝑉2 𝑘𝑉1
and Di Blasi’s two-step mechanism contains five pseudo components (A, B, C, V1, and V2). The four Arrhenius kinetic parameters (k1, k2, kV1, kV2) were fitted to experimentally measured mass loss curve data. At any moment in time, the mass of the solid product is described by the sum of masses of A, B, and C, while the total mass of volatiles is provided by the sum of V1 and V2. The set of five differential rate equations which describes the evolution of these pseudo components is: 𝑟𝐴= 𝑑𝑚𝐴 𝑑𝑡 = − 𝑘1+ 𝑘𝑉1 ∗ 𝑚𝐴 (1) 𝑟𝐵 =𝑑𝑚𝐵 𝑑𝑡 = 𝑘1 ∗ 𝑚𝐴− (𝑘2+ 𝑘𝑉2) ∗ 𝑚𝐵 (2) 𝑟𝐶 =𝑑𝑚𝐶 𝑑𝑡 = 𝑘2 ∗ 𝑚𝐵 (3) 𝑟𝑉1= 𝑑𝑚𝑉1 𝑑𝑡 = 𝑘𝑉1 ∗ 𝑚𝐴 (4) 𝑟𝑉2𝑑𝑚𝑉2 𝑑𝑡 = 𝑘𝑉2 ∗ 𝑚𝐵 (5) where 𝑚𝑋 is the mass of pseudo component (X= A,B,C,V1,V2) in (kg), 𝑟𝑋 and 𝑑𝑚𝑑𝑡𝑋 represent the
net mass production rate, (the net rate of change of mass of the pseudo component X) in (kg s-1). The parameters that Prins’ fitted during willow TGA mass loss experiments are:
𝑘1= 2.48 ∗ 104𝑒𝑥𝑝(− 75976 𝑅𝑇) (6)
𝑘𝑉1= 3.23 ∗ 107𝑒𝑥𝑝(− 114214 𝑅𝑇) (7)
𝑘2= 1.1 ∗ 1010𝑒𝑥𝑝(− 151711 𝑅𝑇) (8)
𝑘𝑉2= 1.59 ∗ 1010𝑒𝑥𝑝(− 151711 𝑅𝑇) (9)
Where the preexponential factor has units of s-1, the activation energy has units of J mol-1, 𝑅 is the universal gas constant in J mol-1 K-1, and𝑇 is the particle temperature in K. Integration of these equations requires initial conditions and an assumed reactor temperature profile as a function of time.
As was noted in (Prins, 2005) the first reaction phase (A B+V1) is much faster than the second phase (B C+V2). Solid mass loss kinetic experiments and analyses by (van der Stelt, 2011) also concluded that torrefaction can be modeled in two phases- one which proceeds quickly and one which proceeds slowly. The dynamics of this mechanism are justifiable when one considers the pyrolysis behavior of pure lignocellulose components (hemicellulose, cellulose, and lignin) summarized next.
During TGA mass loss experiments of pure components, hemicellulose has been found to be the most reactive component, pyrolyzing rapidly between 200-300○C while cellulose degrades between 275-350 ○C (Biagini et al., 2006). Lignin is the least reactive and decomposes over the range of 200-600 ○C. Hemicellulose, cellulose, and lignin comprise 17-20%, 53-60%, and 25%, respectively of a hardwood such as willow (Bergman et al., 2005; Bridgeman et al., 2008).
Simulation of the solid mass loss (using the willow kinetic parameters) indicate that the first step concludes within 15-60 minutes, and results in 16-30% solid mass loss for temperatures between 250-300 ○C, respectively. The second step takes up to several hours to reach completion and results in an additional 42-48% mass loss; thus, the mass loss occurring during the fast first stage of torrefaction is primarily attributable to thedecomposition of hemicellulose (with an increasing contribution from cellulose decomposition at higher temperatures). The mass loss during the slow second stage is primarily due to cellulose decomposition, with minor lignin decomposition and the charring of the remaining hemicellulose. This mechanistic understanding of torrefaction in terms of the pyrolysis of its pure lignocellulose components was originally propounded by several authors (Bergman et al., 2005; Prins, 2005; van der Stelt, 2011).
2.3. Volatile composition model
While the solid mass loss kinetics model enables accurate prediction of the amounts of solid and volatile products it lumps solid and volatile products into undefined solid and volatile
pseudocomponents (A, B, C) and (V1,V2), respectively. With the ability to simulate the mass of V1 or V2 present during kinetically controlled conditions, we can formulate (and solve) an inverse problem which relates the simulated yields of V1 and V2 and compositional parameters to the total experimentally measured masses of nine chemical species (water, carbon dioxide, acetic acid, etc.). The experimental data is discussed in section 2.3.1 while the formulation and solution of the inverse problem is discussed in section 2.3.2.
2.3.1. Volatile composition experimental data
In a separate analysis from his mass loss kinetics parameter fitting, Prins reported the composition of the volatiles produced during five different experimental conditions during willow torrefaction (see Table 1) with solid mass yields between 66.7-92.6%. Prins’ experimental conditions as well as the cumulative yields of nine different chemical species collected are reported in Table 1. Batch experiments of 10 grams of biomass with particle diameters between 0.7-2.0 mm accompanied by slow heating rates of 10 C min-1 ensured that the torrefaction was kinetically controlled (Prins, 2005). The condensable volatile products were liquefied in a cold trap at 5○C while non-condensable products were collected in a gas bag. All products were weighed to produce mass balance and the volatiles were analyzed using GC and HPLC.
The temperature at which torrefaction reactions initiate is 200 ○C. Tfinal is the maximum temperature the reactor reaches after the heating period. The heatup period, which occurs
between when the temperature is ramping from 200 ○C to Tfinal, is determined by the heating rate. The total time is the summation of the heatup period and the isothermal period (the time the sample is held at Tfinal). The total time does not include the time to heat the sample from ambient temperature to 200○C, nor does it include the time when the particle is cooled. The solid and volatile mass yields are defined in terms of the percent weight of the initial solid mass, which is taken when the temperature is 200○ C. For example, experiment #5 has a Tfinal of 300○C and heating rate of 10 C min-1. The total torrefaction time (20 minutes) is given by adding the heatup time (10 minutes) to the isothermal time (10 minutes). Specifying whether the total time
includes the heatup time is necessary for comparing experimental results consistently. In order to verify the assumption that the experimentally measured volatiles did not undergo significant intra particle or extra particle secondary reactions, a characteristic time associated with the cracking of condensible volatile products (i.e “tar”) can be calculated from
experimentally measured Arrhenius kinetic data for beech wood (Rath et al., 2002):
𝑡𝑐𝑟𝑎𝑐𝑘 = 1/𝐴𝑒−𝐸 𝑅𝑇 (10)
where A=105.14 (s-1)and E=93.37 (kJ mol-1). Even at 300○C, the characteristic time associated with secondary reactions is 2300 sec which is far longer than the gas residence time within the reactor and sampling systems. Based on this, the products measured by Prins’ can be assumed to
be primary products unaffected by secondary reactions.
It is clear from the results in Table 1 that the amount and composition of the total volatile yields change with torrefaction temperature, residence time, and mass yield. For example in experiment 1, methanol comprises 2.4% of the total volatile yield while in experiment 5
methanol comprises 11% of the total volatile yield. Therefore a volatile composition model must be able to account for the change in composition of the total volatiles.
The overall mass balance during Prins’ volatile compositions experiments ranged from
95-98%. However, the total volatile and solid yields in Table 1 sum to 100%, therefore it will be assumed that any volatiles which leaked (<5% wtinitial) had the same average composition as those directly measured.
2.3.2. Volatile composition model formulation
The formation of pyrolysis products and their subsequent interactions is a complex chemical process and is still not well established. A wide variety of phenomena (including interactions between the lignocellulose components, the catalyzing effects of mineral content, temperature and heating rate effects, and secondary (heterogeneous and homogeneous) reactions can have important effects on volatile yields (Patwardhan et al., 2010; Wang et al., 2011). Nevertheless, it is instructive to understand the pyrolysis products of pure lignocellulosic components in formulating a volatile composition model.
According to (Demirbas, 2007) the condensable products of xylan (hemicellulose) degradation consists primarily of eight products including water, methanol, formic acid, acetic acid, propionic acids, hydroxyacetone (C3H6O2), and 1-hydroxy-2-butanone (C4H8O2).
Kinetically limited, fast pyroylsis of pure (ash free) hemicellulose derived from switchgrass) at 500 ○C results in similar products including carbon dioxide (18.8 %wt), water (15.1% wt), formic acid (8.4%wt), and char (11%wt), hydroxyacetone (3% wt) and other dehydration products including dianhydro xyloses(8%wt) (Patwardhan et al., 2011). Lower temperatures (300 ○C) and the addition of minerals (alkali and alkaline salts) were found to increase char yield significantly.
Kinetically limited fast pyrolysis of pure (ash free) cellulose (microcrystalline powder) at 500 ○C yields different compounds than hemicellulose. The primary products include
levoglucosan (63%wt), formic acid (6.6%), glycoaldehyde (6.7%) and carbon dioxide (3.3%) and char (~5%) (Patwardhan et al., 2010). However, the presence of even small amounts of alkali and alkaline earth metals was found to drastically reduce the yields of levoglucosan and increase the yields of char and low molecular weight species including formic acid, glycoaldehyde (C2H4O2) , and hydroxyacetone (Patwardhan et al., 2010).
Although levoglucosan is one of the primary products of pure cellulose pyrolysis, it is found in smaller quantities during wood pyrolysis. In fact, none is apparent in the volatile composition experiments shown in Table 1. This is perhaps due to levoglucosan’s thermal
instability which experiences subsequent decomposition and reactions to form volatiles including acetic acid, acetone, phenols, and water (Demirbaş, 2000).
A zonal description of the reactions and products of wood pyrolysis was offered by (Güllü and Demirbaş, 2001). Zone A occurs at temperatures below 200 ○C and results in water,
carbon dioxide, formic acid, acetic acid, glyoxal. Zone B occurs at temperatures between 200-260 ○C and results in water, carbon dioxide, formic acid, glyoxal, carbon monoxide. Zone C occurs at temperatures between 260-500 ○C and results in methane, formaldehyde, formic acid, acetic acid, methanol, hydrogen. In Zone D, which occurs above 500 ○C, the final char product is formed.
As discussed above, torrefaction is characterized by the rapid (10-60 minutes)
decomposition of the hemicellulose component during the first stage followed by the slower (60-180 minutes) degradation of the cellulose and lignin components in the second stage. Therefore the volatile products associated with hemicellulose pyrolysis (i.e zone A and B) could be expected to constitute most of V1. The volatiles which comprise V2 could be expected to be similar to cellulose (i.e zone C) pyroylsis products.
Based on this summary, we can assume that the individual chemical compositions of the pseudo components V1 and V2 are comprised by unique mixtures of nine chemicals-
representative of hemicelluloses and cellulose pyrolysis, respectively. This hypothesis can account for the varying composition of volatiles produced during torrefaction: V1 and V2 are produced in varying proportions- depending on the temperature and reaction conditions- and thus both the total yield and average chemical composition of the volatiles will vary with temperature and time.
The chemical compositions of the pseudo components V1 and V2 might be expected to bedependent on temperature. However, given the limited temperature range of the above volatile composition experiments between 230-300 ○C, the individual compositions of V1 and V2 may not change drastically in this range.
To summarize, we propose a simplified volatile composition model where V1 and V2 are individually modeled with a unique chemical composition (of nine species) which does not vary with temperature (between 230-300○C). The composition and yield of the total (experimentally measurable) volatile yield (V1+V2) will vary with temperature and reaction extent. This is a simplification of the complex pathways and reactions which lead to formation of volatiles and does not explicitly account for the above mentioned phenomena of ash catalyzed reactions. Nonetheless, these simplifying assumptions are required to make progress given the limited conditions and availability of volatile composition data for torrefaction.
Formulation of this model requires 18 parameters which are –as yet- unknown. These parameters –which will be referred to as compositional coefficients- are the mass fraction contribution to V1 and V2 ofthe nine volatiles (acetic acid, water, formic acid, etc.). For
its nine compositional coefficients would have a value of 1/9th or 0.111. The approach to deriving these parameters requires three steps:
1) The estimation of the amounts of pseudocomponents V1 and V2 which would be expected during the five volatile composition experiments (see Table 1) through kinetic simulations
2) The formulation of an inverse problem which relates the experimentally measured total volatile yields to the kinetically simulated yields of V1 and V2
3) The solution of optimal set of 18 compositional coefficients through least squares regression
1) Kinetics simulation
In order to model the composition of V1 and V2, knowledge of the relative amounts of V1 and V2 present during the experimental conditions detailed in Table 1 is necessary. Since they are pseudo components, the yields of V1 and V2 are not possible to experimentally measure.
However, since the experimental torrefaction conditions were kinetically controlled, it is possible to independently run a mass loss kinetics simulationunder identical conditions to those in the five experiments. The kinetics simulation represents a solution to the coupled system of ODE’s (equations Error! Reference source not found. through Error! Reference source not found.). By providing appropriate initial conditions and imposing a particle temperature profile
representative of the experimental conditions, the cumulative mass yields of A,B,C,V1,V2 can be solved as a function of time. The simulated V1 and V2 yields under torrefaction conditions which parallel those in experiments #1-5 are shown in Table 1. The total volatile yields 𝑌𝑉𝑡𝑜𝑡 and solid mass yield 𝑌𝑠 can be calculated from the simulated yields of V1 and V2:
𝑌𝑉𝑡𝑜𝑡 = 𝑌𝑉1+ 𝑌𝑉2 (11)
𝑌𝑠 = 1 − 𝑌𝑉𝑡𝑜𝑡 = 𝑌𝐴+ 𝑌𝐵+ 𝑌𝐶 (12)
Where 𝑌𝑥 represents the yield of x (A,B,C,V1, V2, Vtot, S) in units of (kg x / kg initial biomass
dry basis).
The kinetic simulation results indicate that pseudocomponent V1 comprises the vast majority of the total volatile yield under all five experimental conditions. V2 comprises between 3.5-25% of the total volatile yield while V1 comprises between 75-96.5%. Because V2 is associated with volatile release during the slower second stage, higher torrefaction temperatures and longer residence time lead to an increased ratio of V2 relative to V1.
2) Formulation of the inverse problem
Using the two sets of compositional coefficients (nine describing V1 and nine describing V2) allows one to relate 𝑌𝑉1 and 𝑌𝑉2 (from the kinetic simulations) to the experimentally measured
total yields of the nine chemicals. This relation between the kinetically simulated V1 and V2 yields and the nine experimentally measured total chemical volatile yields is summarized in the following system of equations:
𝑌𝑉1𝑛∗ 𝑌𝑥,𝑉1+ 𝑌𝑉2𝑛∗ 𝑌𝑥,𝑉2= 𝑌𝑥𝑛 (13)
Where,
𝑌𝑥,𝑉𝑁 is the mass fraction of pseudocomponent (VN =V1, V2) composed of chemical specie
x=𝑎, 𝑏, … 𝑖, in (kg x/ kg VN)
𝑌𝑥𝑛 is the experimentally measured total yield of volatile species (x =𝑎, 𝑏, … 𝑖) during experiment number (n =1,2,3..5) in terms of the mass fraction of the initial solid mass (kg x/ kg initial
𝑌𝑉𝑁𝑛 is the simulated yield of VN (i.e V1,V2) for experiment n (1,2,..5), in terms of mass
fraction of the initial solid mass (kg VN/ kg initial biomass) (see Table 1). The nine subscripts (a,b,c…i) refer to acetic acid, water, formic acid, methanol, lactic acid, furfural, hydroxyacetone, carbon dioxide and carbon monoxide, respectively.
There were five experiments and each experiment has nine total chemical yields. This represents a system of 45 total equations. However only eighteen unknown parameters - 𝑌𝑎,𝑉1 through 𝑌𝑖,𝑉1 and 𝑌𝑎,𝑉2 through 𝑌𝑖,𝑉2- exist. Therefore the system of equations is
overdetermined and no single solution of the compositional coefficients can satisfy all 45 equations. Mathematically the problem is represented in matrix form by the system:
𝑌𝑉11 𝑌𝑉21 𝑌𝑉12 𝑌𝑉22 𝑌𝑉13 𝑌𝑉23 𝑌𝑉14 𝑌𝑉24 𝑌𝑉15 𝑌𝑉25 𝑌𝑎,𝑉1 𝑌𝑏,𝑉1⋯ 𝑌𝑖,𝑉1 𝑌𝑎,𝑉2 𝑌𝑏,𝑉2⋯ 𝑌𝑖,𝑉2 = 𝑌𝑎1 𝑌𝑎2 𝑌𝑎3 𝑌𝑎4 𝑌𝑎5 𝑌𝑏1 ⋯ 𝑌𝑖1 𝑌𝑏2 ⋯ 𝑌𝑖2 𝑌𝑏3 ⋯ 𝑌𝑖3 𝑌𝑏4 ⋯ 𝑌𝑖4 𝑌𝑏5 ⋯ 𝑌𝑖5
Where the first matrix on the left-hand side has dimensions of 5 rows by 2 columns and is composed of the V1 and V2 yields generated by the kinetics simulation, the second matrix has dimensions of 2 rows by 9 columns and comprises of the 18 unknown compositional
coefficients, and the third matrix has dimensions of 5 rows by 9 columns and consists of the experimentally reported yields of the nine chemical species.
3) Least squares solution
The unknown 18 compositional coefficients were solved iteratively until the least squares solution was found. Additional constraints include:
𝑌𝑥,𝑉1
𝑖 𝑎
𝑌𝑥,𝑉2= 1
𝑖 𝑎
(15)
𝑌𝑥,𝑉1, 𝑌𝑥,𝑉2≥ 0 (16)
These constrain the least squares solution of 18 compositional coefficients to be physically meaningful by ensuring non-negative values. Also, since the compositional coefficients are mass fractions, they are constrained to sum to 1.
2.3.3. Fitted compositional coefficients
The 18 compositional coefficients which comprise the least squares solution are summarized in tabular form in Table 2.
Based on the fitted coefficients, V1 is composed primarily of acetic acid, water, and carbon dioxide. These volatiles are typical of hemicellulose degradation products and are highly similar to the products created in zone A and B (200-260 ○C).
V2 appears to be composed entirely of condensable volatiles including lactic acid, methanol, and acetic acid, water, hydroxyacetone, and formic acid. This bears agreement with the products of Zone C (260- 500 ○C). The presence of formic acid and hydroxyacetone in V2 is evidence of the mineral catalyzed decomposition of levoglucosan from cellulose pyrolysis described in (Patwardhan et al., 2010).
The fitted compositions of pseudo components V1 and V2 support the original
hypothesis/assumption that their compositions are representative of hemicellulose (zone A,B) and cellulose (zone C) pyrolysis products, respectively. Although the fitted compositions are fixed, the yield and composition of the total volatiles (i.e the sum of V1 and V2) varies with time and temperature because the pseudocomponents are produced in varying amounts and
2.3.4. Volatile evolution kinetics (rate equation representation)
A set of rate equations describing the production rate of the nine chemical species (water, acetic acid, etc.) can now be defined. These nine rate equations depend on the production rates of V1 and V2 and the compositional coefficients (𝑌𝑎,𝑉1, 𝑌𝑏,𝑉1,…etc.). They are expressed generally:
𝑑𝑚𝑥
𝑑𝑡 = 𝑟𝑉1𝑌𝑥,𝑉1∗ +𝑟𝑉2𝑌𝑥,𝑉2
(17)
where 𝑑𝑚𝑑𝑡𝑥 represents the volatile matter production rate (in kgx s -1) of chemical specie (x =a,b,…i) and 𝑟𝑉1 and 𝑟𝑉2 are the mass production rate of V1 and V2 in kg s-1 (defined by
equations (4) and (5), respectively).
2.4. Solid product composition model
The composition of A is fixed and known from the ultimate analysis of the raw biomass. The composition of V1 and V2 is fixed and defined by the previously described volatile composition model. Based on the- now known- composition of V1 and V2 is it possible to predict the
evolution of the composition of the remaining solid product based on a simple species balance. In other words, the evolution of the average solid product composition depends only on: -The initial solid product composition (i.e ultimate analysis of raw biomass)
-The amount and composition of the volatiles which have left the solid product (i.e amount and composition of V1,V2).
However, the evolution of the heat release (due to chemical reactions) depends on the composition of products and reactants generated at the instant at which the reactions occur- not on the average composition of products and reactants which exist in a system. This requires more information about the nature of the solid pseudo components (B and C) which are reacting. The
composition of B and C can be determined by additional kinetic analysis and species
conservation. Note that the individual compositions of B and C are only relevant in the context of reaction thermochemistry. They are not necessary to estimating the average composition of the solid product.
In summary, two types of solid product composition are relevant:
1) The average solid product composition described in section 2.4.1
2) The compositions of B,C which are reacting/forming at an instant in time. The kinetic analysis regarding the instantaneous product distribution is described in section 2.4.2. Section 2.4.3 relates these fractional yields to the composition of B and C.
2.4.1. Average solid product composition
Since the solid product is represented by a mixture of A, B and C components, its average composition depends on the time varying concentration and composition of A, B and C. A straightforward approach to track the average carbon, hydrogen, and oxygen content of the solid product is to use a control volume around A, B, and C. Combining control volume conservation laws with the kinetic rate laws, we can relate the rate of change of the carbon, hydrogen, and oxygen content (in kg) of the solid to the composition and formation rates of V1 and V2.
The resulting conservation equations which govern the ultimate analysis of the solid product can be written as follows:
𝑑(𝑚𝑠𝑌𝑗 ,𝑆)
𝑑𝑡 = −𝑟𝑉1𝑌𝑗 ,𝑉1− 𝑟𝑉2𝑌𝑗 ,𝑉2
(18)
𝑌𝑗 ,𝑖 is the mass fraction of elemental species "j" (j=C,H,O,N,Ash) contained in component "i" (e.g. S, V1, V2) and 𝑟𝑉1 and 𝑟𝑉2 are previously defined reaction rates (equations (4) and (5)
respectively), in kg s-1
The twelve rate equations described so far summarized in equations (17) and (18) coupled with the five mass loss kinetic rate equations (1) through (5) completely describe the mass and species balance during torrefaction. The evolution of the composition of volatiles and the solid product is described in terms of actual chemical species. The remaining equations ((23) through (26), are required to describe the compositions of pseudo components B and C which are necessary for the development of a thermochemical model (insert citation to part II).
2.4.2. Instantaneous fractional yields
In the present mass loss kinetics mechanism, the pseudocomponents are produced in two stages each with parallel reactions. In each stage, decomposition occurs first-order with respect to the reactant (A and B for stage 1 and 2, respectively). A quantitative description of the product distribution which is reacting at any instant requires analysis of the instantaneous fractional yields. Based on this product distribution analysis, the composition of B and C at the instant at which they are reacting can then be defined from species balance.
The instantaneous fractional yields depend on the ratio of kinetic rates between 𝑘1 versus 𝑘𝑉1 and 𝑘2 versus 𝑘𝑉2. They are positive, dimensionless, are defined by the formation rate of
product divided by the decomposition rate of the reactant:
𝛽 = 𝑟𝐵,1 −𝑟𝐴,1 = 𝑘1∗ 𝑚𝐴 𝑘1+ 𝑘𝑉1 ∗ 𝑚𝐴 = 𝑘1 𝑘1+ 𝑘𝑉1 (19) 𝜈 = 𝑟𝑉1,1 −𝑟𝐴,1= 𝑘𝑉1∗ 𝑚𝐴 𝑘1+ 𝑘𝑉1 ∗ 𝑚𝐴 = 𝑘𝑉1 𝑘1+ 𝑘𝑉1 (20) 𝛾 = 𝑟𝐶,2 −𝑟 = 𝑘2∗ 𝑚𝐵 𝑘 + 𝑘 ∗ 𝑚 = 𝑘2 𝑘 + 𝑘 (21)
𝜉 = 𝑟𝑉2,2 −𝑟𝐵,2 = 𝑘𝑉2∗ 𝑚𝐵 𝑘2+ 𝑘𝑉2 ∗ 𝑚𝐵 = 𝑘𝑉2 𝑘2+ 𝑘𝑉2 (22) where, 𝑟𝑗 ,𝑁 represents the rate of change of mass (kgj s-1) of pseudocomponent j, (j= A, B,C,V1,V2) in step N (N=1,2) 𝑘N are the Arrhenius rates with units of 1/s. Using the
instantaneous fractional yields we can express the two step kinetic mechanism as:
𝐴 → 𝛽𝐵 + 𝜈𝑉1 (23)
𝐵 → 𝛾𝐶 + 𝜉𝑉2 (24)
Where 𝛽, 𝜈, 𝛾, 𝜉 are the instantaneous fractional yields. They are interpreted in the following way: For each gram of A which is disappearing at any instant, 𝛽 grams of B and 𝜈 grams of V1 are formed. Likewise, 𝛾 and 𝜉 represent the mass fraction of B transforming into C and V2, respectively. By definition, the sum of 𝛽 and 𝜈 and the sum of equals 𝛾 and 𝜉 equals 1. The
overall fractional yield will depend on the temperature history and the extent to which each stage has completed.
Depending on the activation energies of the kinetic parameters, the instantaneous fractional yields can have temperature dependence. In the case of the willow kinetics reported by (Prins, 2005), 𝛾 and 𝜉 are constant due to the equal activation energies of 𝑘2, 𝑘𝑉2 of that step.
The instantaneous fractional yields calculated based on the willow kinetics parameters are shown in Figure 1a as a function of temperature. Each gram of B that reacts is converted into 0.59 g V2 and 0.41 g of C. regardless of temperature.
However, 𝛽 and 𝜈 are temperature dependent due to the unequal activation energies of 𝑘1, 𝑘𝑉1. Although the vast majority of A converts into the intermediate product (B), increasing
amounts of V1 (relative to B) are produced at higher temperatures. For example, at 220 ○C, each gram of A which is reacting forms 0.9 g of B and 0.1 g of V1. However at 300 ○C, A degrades to form only 0.7 g of B and 0.3 g of V1.
The competitive nature of the first step of this kinetic mechanism is representative of the pyrolysis characteristics of pure xylan (hemicellulose) demonstrated in TGA mass loss kinetics experiments by (Di Blasi and Lanzetta, 1997; van der Stelt, 2011). In these experiments, pure xylan was subjected to a 10-70 ○C/min heating rate until reaching a prescribed maximum temperature (between 220-300○C) after which it was held at this temperature for up to 120 minutes. The maximum mass loss (i.e volatile formation) during this xylan pyrolysis exhibited temperature dependence. For example, the final volatile yield of ranged from 42 to 56 %wtinitial
solid after 120 minutes depending on the final temperature (240 to 300 ○C, respectively) (van der Stelt, 2011).. In other words, higher temperatures favor the formation of volatiles (relative to solid product) during hemicellulose pyrolysis.
Cellulose pyrolysis also demonstrates a competitive behavior between volatile and char formation. In TGA experiments of cellulose between 240-300○C in (Cho et al., 2010), the final volatile yield ranged between 70-90%wtinitial (increasing linearly with temperature).
These similarities further support the proposal that the volatile formation which occurring during the first step is primarily (but not solely) attributed to hemicellulose decomposition, with an increasing contribution from cellulose at higher temperatures.
Summarizing the analysis of the kinetics mechanism:
-Torrefaction mass loss can be modeled by a two-stage process where the raw biomass (A) degrades competitively to form an intermediate solid product (B) and volatiles (V1). The remaining solid product (B) slowly and subsequently decomposes to unreactive char product (C) and volatiles (V2),
-The reactions which form solid and volatiles are competitive: the relative availability of reaction pathways (solid to volatiles) exhibits temperature dependence.
2.4.3. Composition of B and C (reactive species balance)
The compositions of pseudo components B and C are necessary in order to estimate the energy balance of each step. Based on an understanding of the decomposition of the pure components, B chemically represents an intermediate solid containing the charred remnants of the hemicellulose decomposition along with depolymerized cellulose and weakly degraded lignin fraction. C represents a final charred product containing completely pyrolyzed hemicellulose and cellulose with a partially decomposed lignin fraction.
From the instantaneous fractional yields defined previously, it is possible to define the composition (ultimate analysis) of B and C. The six unknowns include the carbon, hydrogen, and oxygen content of B and C. Three species conservation equations can be written for each
reaction step resulting in six equations. Rearranging these conservation equations results in the following, which define the composition of B and C as a function of known quantities- the instantaneous fractional yields and the compositions of A, V1, and V2:
𝑌𝑗 ,𝐵 = (𝑌𝑗 ,𝐴− 𝜈 ∗ 𝑌𝑗 ,𝑉1) 𝛽 (25)
𝑌𝑗 ,𝐶 = (𝑌𝑗 ,𝐵− 𝜉 ∗ 𝑌𝑗 ,𝑉2) 𝛾 (26)
where, 𝛽, 𝜈, 𝛾, 𝜉 are the instantaneous fractional yields, and
𝑌𝑗 ,𝑖 denotes the mass fraction (kg j/ kg i) of elemental species j=C,H,O,N,Ash of pseudo component (i= A,B,C,V1,V2) made up by species j on a dry basis.
The composition of A, V1 and V2 are presently modeled as fixed with temperature, but due to temperature dependency of 𝛽 and 𝜈, the composition of B and C will vary with
temperature. Substituting the relative rates, the initial ultimate analysis of willow (𝑌𝑗 ,𝐴 = 0.472,
0.061, 0.451, 0.003,0.13 j=C,H,O,N,Ash ) and the composition of V1,V2 (𝑌𝑗 ,𝑉1 and 𝑌𝑗 ,𝑉2
summarize the instantaneous composition of B and C as a function of temperature, respectively. At 300 ○C (the upper temperature limit for torrefaction), C, which represents char is composed almost entirely of carbon (94%). At the 200 ○C (the lower temperature limit for torrefaction) B has a very similar composition to A (non torrefied willow). In both B and C, as temperature increases the mass fraction of carbon increases while those of hydrogen and oxygen go down.
This trend of reduced hydrogen and oxygen mass fraction in the char with higher peak temperature has been noted in (Neves et al., 2011) which performed a structured collection of pyrolysis product composition data over a range of pyrolysis peak temperatures (200-1000 ○C).
2.5. Model overview and summary
The formulation of a model to describe the changes in volatile and solid composition during torrefaction has been described. These models are represented in rate equations and are coupled to the mass loss kinetics rate equations. Formulation of the model in such a matter enables a dynamic description of the:
1) The mass yields of nine identifiable volatiles (i.e kg of acetic acid)
2) The carbon, hydrogen, oxygen, nitrogen, and ash content of the solid torrefied product
Implementation of the model requires integration of the rate equations which constitute a system of ordinary differential equations. The ultimate analysis of the raw solid biomass is required as an initial condition. The present model results assumed an initial willow ultimate analysis of (47.2%, 6.1%, 45.1%, 0.3%, 0.13%) of carbon, hydrogen, oxygen, nitrogen, and ash respectively on a percent weight, dry basis(Prins, 2005).Additionally, the implementation also requires the temperature profile as a function of time to be designated. The initial solid
At present, the model parameters are feedstock specific: the mass loss kinetics and volatile composition model parameters were derived from Prins' willow torrefaction
experiments. However, the mathematical framework through which model parameters (such as the compositional coefficients) were extracted from the experimental data is feedstock general: similar mass loss kinetics (using TGA) and volatile composition experiments (using GC/HPLC) could be applied to other biomass feedstocks.
3. Results and discussion
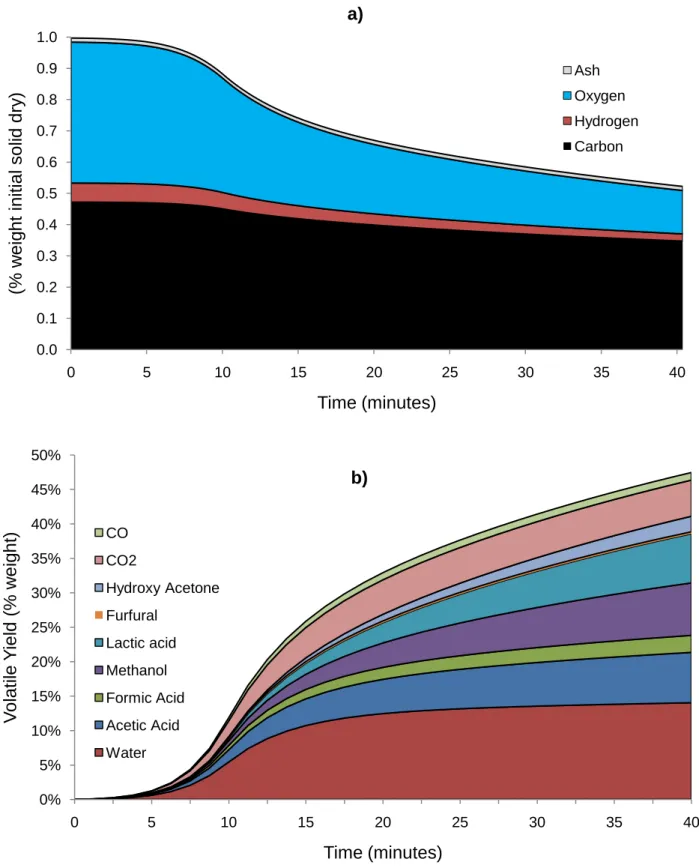
Figure 2 illustrates both the overall (solid mass loss) as well as the volatile product composition with time. This composition profile is in line with the expected de-oxygenation of the solid product that occurs due to the decarboxylation and dehydration reactions (evidenced by the high carbon dioxide and water content present in the volatile products). Also of importance is the relatively high carbon yield in the solid product throughout the process. Initially, the volatile composition is composed mostly of V1- characterized by high water, acetic acid and carbon dioxide content). As the torrefaction proceeds, V2 is produced in greater quantities resulting in increasing yields of lactic acid, methanol, and acetic acid.
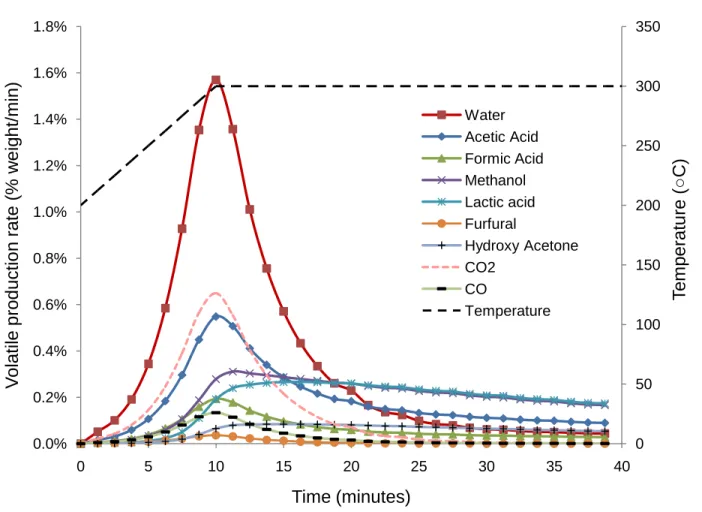
This is also demonstrated by the time derivative of the volatile yields shown in Figure 3. The present results indicate a peak rate of volatile release at approximately 10 minutes which is dominated by water, acetic acid, and carbon dioxide production. From 20 minutes onwards, the volatile release is primarily composed of lactic acid and methanol. These results share
qualitatively similar trends with the FTIR spectra of reed canary grass at 290 ○C published in (Bridgeman et al., 2008) which also demonstrates a single peak in volatile production occurring as the sample reaches the final temperature. Water and carbon dioxide were found to be the
primary volatile constituents during this initial peak in release, agreeing with the present model results.
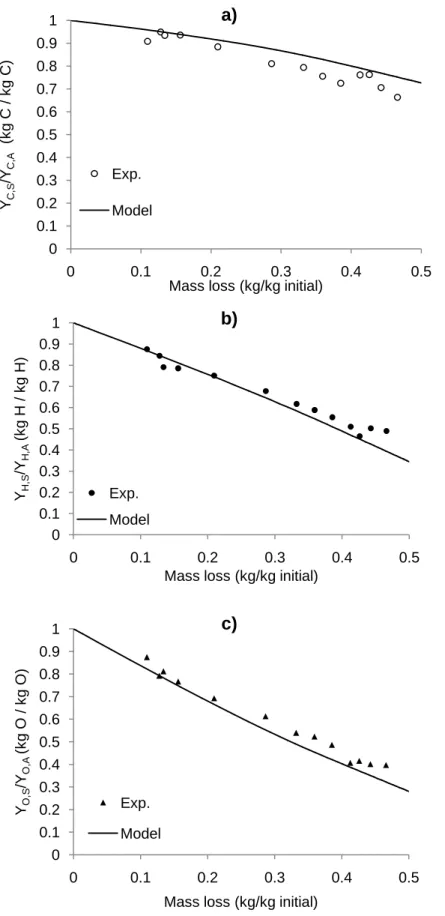
Based on the model results shown in Figure 2 we can calculate the fraction of carbon, hydrogen, and oxygen retained by the solid product versus the mass loss. In Figure 4, model predictions for these quantities are compared with experimental data from (Prins, 2005; Arias et al., 2008; Medic et al., 2011) who measured the initial and final ultimate analyses of torrefied willow, corn stover, and eucalyptus samples, respectively over a range of torrefaction
temperatures between 200-300 ○C and residence times up to 45 minutes.
The model predictions match the experimentally measured data which demonstrate the carbonizing effect of torrefaction on the residual solid product: the retained fraction of carbon is always higher than the retained fractions of oxygen and hydrogen. Despite the model
assumptions of parameters based on willow torrefaction, these results suggest that the present model satisfactorily characterizes the evolution in solid product composition for a variety
feedstocks and torrefaction conditions. The model predictions appears to slightly over predict the carbon yield and under predict the oxygen yield at higher levels of mass loss.
4. Conclusion
A new model of the evolution of volatile and solid product composition is proposed and the parameters for the model have been derived from published solid mass loss kinetic and volatile composition experiments for kinetically limited willow torrefaction experiments between 230-300 ○C.
The model describes the rate of release and composition of volatiles in terms of nine identifiable species enabling the composition of the solid product to be predicted through
element balances. The model predictions of the solid product residue composition and volatile release agree with published experimental results which were not used to derive the parameters.
Acknolwedgements
References
Almeida, G., Brito, J.O., Perre, P., 2010. Alterations in energy properties of eucalyptus wood and bark subjected to torrefaction: The potential of mass loss as a synthetic indicator. Bioresource Technology 101, 9778–9784.
Arias, B., Pevida, C., Fermoso, J., Plaza, M.G., Rubiera, F., Pis, J.J., 2008. Influence of torrefaction on the grindability and reactivity of woody biomass. Fuel Processing Technology 89, 169–175.
Bergman, P.C.A., Boersma, A.R., Kiel, J.H.A., Prins, M.J., Ptasinski, K.J., Janssen, F.J.J.., 2005. Torrefaction for entrained-flow gasification of biomass. Energy Research Center of the Netherlands.
Biagini, E., Barontini, F., Tognotti, L., 2006. Devolatilization of Biomass Fuels and Biomass Components Studied by TG/FTIR Technique. Industrial & Engineering Chemistry Research 45, 4486–4493.
Di Blasi, C., Lanzetta, M., 1997. Intrinsic kinetics of isothermal xylan degradation in inert atmosphere. Journal of Analytical and Applied Pyrolysis 40-41, 287–303.
Bridgeman, T.G., Jones, J.M., Shield, I., Williams, P.T., 2008. Torrefaction of reed canary grass, wheat straw and willow to enhance solid fuel qualities and combustion properties. Fuel 87, 844–856.
Cho, J., Davis, J.M., Huber, G.W., 2010. The Intrinsic Kinetics and Heats of Reactions for Cellulose Pyrolysis and Char Formation. ChemSusChem 3, 1162–1165.
Demirbas, A., 2007. The influence of temperature on the yields of compounds existing in bio-oils obtained from biomass samples via pyrolysis. Fuel Processing Technology 88, 591– 597.
Demirbaş, A., 2000. Mechanisms of liquefaction and pyrolysis reactions of biomass. Energy Conversion and Management 41, 633–646.
Güllü, D., Demirbaş, A., 2001. Biomass to methanol via pyrolysis process. Energy Conversion and Management 42, 1349–1356.
Medic, D., Darr, M., Shah, A., Potter, B., Zimmerman, J., 2011. Effects of torrefaction process parameters on biomass feedstock upgrading. Fuel 91, 147–154.
Neves, D., Thunman, H., Matos, A., Tarelho, L., Gomez-Barea, A., 2011. Characterization and prediction of biomass pyrolysis products. Progress in Energy and Combustion Science 37, 611–630.
Patwardhan, P.R., Brown, R.C., Shanks, B.H., 2011. Product Distribution from the Fast Pyrolysis of Hemicellulose. ChemSusChem 4, 636–643.
Patwardhan, P.R., Satrio, J.A., Brown, R.C., Shanks, B.H., 2010. Influence of inorganic salts on the primary pyrolysis products of cellulose. Bioresource Technology 101, 4646–4655. Prins, M.J., 2005. Thermodynamic analysis of biomass gasification and torrefaction (Ph.D.
thesis).
Ranzi, E., Cuoci, A., Faravelli, T., Frassoldati, A., Migliavacca, G., Pierucci, S., Sommariva, S., 2008. Chemical Kinetics of Biomass Pyrolysis. Energy & Fuels 22, 4292–4300.
Rath, J., Steiner, G., Wolfinger, M.., Staudinger, G., 2002. Tar cracking from fast pyrolysis of large beech wood particles. Journal of Analytical and Applied Pyrolysis 62, 83–92. van der Stelt, M., 2011. Chemistry and reaction kinetics of biowaste torrefaction (Ph.D. thesis). Wang, S., Guo, X., Wang, K., Luo, Z., 2011. Influence of the interaction of components on the
Figure captions
Figure 1 a) Willow torrefaction instantaneous fractional yields (-) versus final temperature(○C). Composition Yj,i of pseudocomponents B and C shown in b) and c), respectively in units of (kg j /kg k dry basis j= C,H,O i=B,C) versus final temperature (○C) as defined by equations (25) and (26).
Figure 2 Modelled solid yield composition a) and volatile yield and composition b) (% weight of initial biomass) versustime (min)
Figure 3 Volatile production rate (%weight initial min-1) versus time (minutes)
Figure 4 Yield of element j retained in solid product per unit mass of element j in initial biomass, 𝑌𝑠,𝑗 𝑌𝐴,𝑗 j= C,H,O for a), b), and c), respectively on a dry ash free basis. Data points from (Prins, 2005; Arias et al., 2008; Medic et al., 2011)
Table titles
Table 1 Willow torrefaction volatile composition experimental conditions and yields. Experimental data from (Prins, 2005). Modelled yields determined using kinetic parameters from (Prins, 2005) shown in equations (6) through (9).
Table 2 Fitted V1 and V2 composition (% mass) through least squares minimization. Calculated carbon, hydrogen, and oxygen content
Tables and Figures
Table 1 Willow torrefaction volatile composition experimental conditions and yields. Experimental data from (Prins, 2005). Modelled yields determined using kinetic parameters from (Prins, 2005) shown in equations (6) through (9).
Experiment # 1 2 3 4 5
Experimental Tfinal (○C) 230 250 270 280 300
conditions Heating rate (○C min-1) 10 10 10 10 10
Heatup period (min) 3 5 7 8 10
Isothermal period (min) 50 30 15 10 10
Total time (min) 53 35 22 18 20
Experimentally Acetic acid (%wt) 0.85 1.5 3 3.05 5.1
measured Water (%wt) 3.8 6.825 7.625 7.9 12.95
yields Formic acid (%wt) 0.225 0.45 0.9 1.1 1.975
Methanol (%wt) 0.175 0.4 1.05 1.8 3.65 Lactic acid (%wt) 0.05 0.175 0.475 1.225 3.075 Furfural (%wt) 0.05 0.125 0.225 0.25 0.25 Hydroxy acetone (%wt) 0 0.025 0.1 0.45 1.075 Carbon dioxide (%wt) 1.919 2.907 3.823 4.153 4.045 Carbon monoxide (%wt) 0.165 0.315 0.544 0.881 1.217
Total volatile yield (%wt) 7.234 12.72 17.74 20.81 33.34
Solid Yield (%wt) 92.6 87.2 82.2 79.2 66.6
Modelled yields of V1 (%wt) 8.19 12.39 16.15 17.7 24.6
pseudo components V2 (%wt) 0.30 0.86 1.68 2.16 8.33
Table 2 Fitted V1 and V2 composition (% mass) through least squares minimization. Calculated carbon, hydrogen, and oxygen content. Nitrogen and ash content assumed to be negligible in volatiles.
Chemical Component Percentage
V1 V2 Acetic acid 𝑌𝑎,𝑉1=14.8% 𝑌𝑎,𝑉2=16.1% Water 𝑌𝑏,𝑉1=48.1% 𝑌𝑏,𝑉2=7.6% Formic acid 𝑌𝑐,𝑉1=5.3% 𝑌𝑐,𝑉2=5.1% Methanol 𝑌𝑑,𝑉1=4.2% 𝑌𝑑,𝑉2=30.1% Lactic acid 𝑌𝑒,𝑉1=1.3% 𝑌𝑒,𝑉2=31.3% Furfural 𝑌𝑓,𝑉1=1.1% 𝑌𝑓,𝑉2=0.0% Hydroxy acetone 𝑌𝑔,𝑉1=0.6% 𝑌𝑔,𝑉2=9.7% Carbon dioxide 𝑌,𝑉1=20.4% 𝑌,𝑉2=0.0% Carbon monoxide 𝑌𝑖,𝑉1=4.2% 𝑌𝑖,𝑉2=0.1% sum 100% 100% Carbon 𝑌𝐶,𝑉1 =18% 𝑌𝐶,𝑉2 =36% Hydrogen 𝑌𝐻,𝑉1 =7% 𝑌𝐻,𝑉2 =9% Oxygen 𝑌𝑂,𝑉1 =75% 𝑌𝑂,𝑉2 =55% Nitrogen 𝑌𝑁,𝑉1 =0% 𝑌𝑁,𝑉1 =0% Ash 𝑌𝐴𝑠,𝑉1 =0% 𝑌𝐴𝑠,𝑉1 =0% sum 100% 100%
Figure 1 a) Willow torrefaction instantaneous fractional yields (-) versus final temperature (○C). Composition Yj,i of
pseudocomponents B and C shown in b) and c), respectively in units of (kgj /kg k dry basis j= C,H,O i=B,C) versus final
0 0.2 0.4 0.6 0.8 1 200 210 220 230 240 250 260 270 280 290 300 Ins tan tan eo us f rac ti on y iel d (-) Temperature (oC) a) β ν γ ξ 0.0 0.2 0.4 0.6 0.8 1.0 200 210 220 230 240 250 260 270 280 290 300 Yj,B (k g j / k g B ) Temperature (○C) b) C H O 0 0.2 0.4 0.6 0.8 1 200 210 220 230 240 250 260 270 280 290 300 Yj,C (k g j / k g C ) Temperature (○C) (c) C H O
Figure 2 Modelled solid yield composition a) and volatile yield and composition b) (% weight of initial biomass) versus time (min) PRINT IN COLOR
0.0 0.1 0.2 0.3 0.4 0.5 0.6 0.7 0.8 0.9 1.0 0 5 10 15 20 25 30 35 40 (% w e ig h t initia l so lid d ry ) Time (minutes) a) Ash Oxygen Hydrogen Carbon 0% 5% 10% 15% 20% 25% 30% 35% 40% 45% 50% 0 5 10 15 20 25 30 35 40 V o lat ile Y ield (% w e ig h t) Time (minutes) b) CO CO2 Hydroxy Acetone Furfural Lactic acid Methanol Formic Acid Acetic Acid Water
Figure 3 Volatile production rate (%weight initial min-1) versus time (minutes) PRINT IN COLOR 0 50 100 150 200 250 300 350 0.0% 0.2% 0.4% 0.6% 0.8% 1.0% 1.2% 1.4% 1.6% 1.8% 0 5 10 15 20 25 30 35 40 T e m p e rat u re ( ○ C) V o lat ile p rod u ctio n rate (% w e ig h t/ m in) Time (minutes) Water Acetic Acid Formic Acid Methanol Lactic acid Furfural Hydroxy Acetone CO2 CO Temperature
Figure 4 Yield of element j retained in solid product per unit mass of element j in initial biomass, 𝑌𝑠,𝑗 𝑌𝐴,𝑗 j= C,H,O for a), b), and c), respectively on a dry ash free basis. Data points from (Prins, 2005; Arias et al., 2008; Medic et al., 2011)
0 0.1 0.2 0.3 0.4 0.5 0.6 0.7 0.8 0.9 1 0 0.1 0.2 0.3 0.4 0.5 YC ,S /Y C ,A (k g C / k g C)
Mass loss (kg/kg initial)
a) Exp. Model 0 0.1 0.2 0.3 0.4 0.5 0.6 0.7 0.8 0.9 1 0 0.1 0.2 0.3 0.4 0.5 YH ,S /Y H ,A (k g H / k g H)
Mass loss (kg/kg initial)
b) Exp. Model 0 0.1 0.2 0.3 0.4 0.5 0.6 0.7 0.8 0.9 1 0 0.1 0.2 0.3 0.4 0.5 YO,S /Y O ,A (k g O / k g O )
Mass loss (kg/kg initial)
c)
Exp. Model