Publisher’s version / Version de l'éditeur:
Vous avez des questions? Nous pouvons vous aider. Pour communiquer directement avec un auteur, consultez la première page de la revue dans laquelle son article a été publié afin de trouver ses coordonnées. Si vous n’arrivez Questions? Contact the NRC Publications Archive team at
PublicationsArchive-ArchivesPublications@nrc-cnrc.gc.ca. If you wish to email the authors directly, please see the first page of the publication for their contact information.
https://publications-cnrc.canada.ca/fra/droits
L’accès à ce site Web et l’utilisation de son contenu sont assujettis aux conditions présentées dans le site LISEZ CES CONDITIONS ATTENTIVEMENT AVANT D’UTILISER CE SITE WEB.
Proceedings of the 23rd IAHR International Symposium on Ice, 2016-06
READ THESE TERMS AND CONDITIONS CAREFULLY BEFORE USING THIS WEBSITE.
https://nrc-publications.canada.ca/eng/copyright
NRC Publications Archive Record / Notice des Archives des publications du CNRC :
https://nrc-publications.canada.ca/eng/view/object/?id=de5e7095-596d-4910-94e2-837c73da6c35 https://publications-cnrc.canada.ca/fra/voir/objet/?id=de5e7095-596d-4910-94e2-837c73da6c35
Archives des publications du CNRC
This publication could be one of several versions: author’s original, accepted manuscript or the publisher’s version. / La version de cette publication peut être l’une des suivantes : la version prépublication de l’auteur, la version acceptée du manuscrit ou la version de l’éditeur.
Access and use of this website and the material on it are subject to the Terms and Conditions set forth at
A preliminary analysis of the crushing specific energy of iceberg ice under rapid compressive loading
23
rdIAHR International Symposium on Ice
Ann Arbor, Michigan USA, May 31 to June 3, 2016
A Preliminary Analysis of the Crushing Specific Energy of Iceberg Ice under
Rapid Compressive Loading
Ekaterina Kim1 and Robert E. Gagnon2
1
Centre for Autonomous Marine Operations and Systems, Centre for Sustainable Arctic Marine and Coastal Technology, Norwegian University of Science and Technology, Trondheim, Norway
ekaterina.kim@ntnu.no 2
Ocean, Coastal and River Engineering National Research Council of Canada
St. John’s, NL Canada robert.gagnon@nrc-cnrc.gc.ca
Indentation tests are used to study inelastic response of ice and other materials when loaded under a compressive stress state. Indentation testing provides force–time plots which are often converted to pressure–area curves, which can later be used in the design of ships and offshore structures. In an inverse application of indentation testing one can use the force-time response to extract material constants characterizing the extent of energy absorption, including dynamic hardness. The aim of the present study is to access the energy consumption index of iceberg ice as the ability to absorb the indentation energy. Data from indentation experiments conducted on natural iceberg ice at Pond Inlet in 1984 have been re-analyzed for three different spherically-terminated indenter sizes. For any given test it was found that the crushing specific energy of the ice shows little, if any, dependency on the volume of the displaced ice and tends towards a constant value. Furthermore there is no apparent correlation of the crushing specific energy of the ice with indenter size, nor is there clear consistency in the values for tests conducted with the same indenter. Possible reasons for these observations are discussed.
1. Introduction
Energy methods are widely used in the design of ships and offshore structures subjected to ice impacts (IACS, 2011; ISO19906, 2010; RMRS, 2014), and for energy methods applications it is important to know the amount of energy dissipated due to ice crushing. However, in contrast to other engineering disciplines such as automotive design and rock mining, the concept of crushing specific energy of ice is only seldom addressed in the fields of ice mechanics and ice engineering. Research studies address the energy consumption index of ice by means of ball drop tests and indentation tests; see e.g., (Barnes et al., 1971; Gagnon and Gammon, 1997; Garcia et al., 1985; Kheisin and Likhomanov, 1973; Pounder and Little, 1959; Timco and Frederking, 1993; Timco and Martin, 1979; Tsuprik, 2013). Existing experimental data cover freshwater lake ice, river ice, laboratory grown freshwater granular and columnar ice, sea ice and icebergs, but despite the research efforts, engineering applications that use ice energetic characteristics are still lacking. Possible reasons for that are (1) inconsistent use of terminology, (2) contradicting observations and lack of systematic experiments, more below.
1.1 Use of terminology
It would appear that in some earlier works such as e.g., Barnes et al. (1971) and Pounder and Little (1959) the energy consumption index of ice is expressed as impact (or dynamic) hardness – a resistance of a material to local indentation when the indentation is produced by a rapidly moving indenter. For sea ice, the term ‘impact hardness’ was defined by Pounder and Little (1959) as follows n indentatio of volume indenter of energy hardness (dynamic) Impact = . [1]
Later works (Gagnon and Gammon, 1997; Garcia et al., 1985; Tsuprik, 2013) use the term ‘specific energy’ to express the energy consumption index of ice. Despite a different name, the specific energy is mathematically identical to impact (dynamic) hardness. Both have dimensions of pressure and sometimes referred to as ‘impact strength’ (Timco and Martin, 1979). Russian workers, i.e., Kheisin and Likhomanov (1973), among others, express the energy consumption index of ice in a slightly different manner, i.e., as a specific energy of mechanical ice crushing – the amount of energy required to break a unit mass of ice (see Eq. 2).
n indentatio of mass indenter of energy crushing ice mechanical of energy Specific = [2]
Table 1. Terminology convention
Earlier terminology New terminology (in this study)
Mathematical expression specific energy of mechanical ice
crushing (specific energy of mechanical destruction of ice)
mass-specific energy index
(MSEI) mass of indentation indenter of
energy
• impact (or dynamic) hardness • impact strength
• specific energy
volume-specific energy index
(VSEI) volumeof indentation indenter of
In this study, in order to access the energy consumption index of ice as the ability to absorb the impact energy we introduce two slightly different terms of energy absorbing property of ice that replace/unite earlier used terminology (see Table 1). First term is a ‘mass-specific energy index’ (MSEI) in the displaced volume of ice. Other term is a ‘volume-specific energy index’ (VSEI) which is virtually equivalent to the dynamic hardness discussed earlier.
1.2 Contradicting observations
From ball drop tests on freshwater lake ice, Kheisin and Likhomanov showed that over a wide range of experimental conditions, MSEI is highly depended on ice thermal state (or temperature) and ice microstructure. They argue that under certain conditions the MSEI is weakly dependent on mass of the dropped ball and on the drop height, but MSEI values increase with decreasing temperatures (for Tair varying from –30○C to +4○C). In contrast with the Kheisin and
Likhomanov observations, Timco and Martin found in 1979 that, for river ice the VSEI values are affected by changes in dropped ball mass and in the ball radius and that there is no strong temperature influence on VSEI (for Tair varying from –26○C to –17○C), probably because the
temperature range is not close to 0○C.
1.3 Scope
As a contribution to current and previous research dealing with specific energies, the aim of the present study is to access the energy consumption index of iceberg ice as the ability to absorb the impact energy. In the interests of clarity, we limit our discussion to the rapid indentation of freshwater, polycrystalline ice at temperatures of around −10°C by spherically-terminated indenters. The term ‘rapid indentation’ is used here to indicate that ice exhibited characteristics of brittle compressive failure: radial cracks, saw-tooth load behavior, etc. The Pond Inlet iceberg impact data sets are re-examined with emphasis on the energy consumption index of ice within the brittle regime. The energy consumption index is expressed here as MSEI (Ѱs) which may
change with the ice type, its thermal and mechanical state and the rate of indentation. In this study, MSEI is defined as in the following:
) ( ) ( ) , , type, ice ( function ) ( 0 z V dz z F v d T z z ice s ⋅ ⋅ = = Ψ
∫
ρ , [3]where Tice is the ice temperature, d is the characteristic grain size, v is the indentation speed, V(z)
is the nominal volume of the crushed material at the penetration depth z, ρ is the ice density, and the nominator in Eq. (3) is a total work required to displace a certain volume of ice, where the total work is defined as the area under the load–displacement curve (F vs. z).
2. Empirical data re-examination
The medium-scale ice indentation experiments at Pond Inlet were originally designed to simulate an interaction of an iceberg impacting an offshore structure and to obtain a relationship between impact pressure and contact area for iceberg ice. Details of the indentation experiments, including the major test results, can be found in the report of Geotech Arctic Services (1985) and in Masterson et al. (1992). Only a brief description of tests and a summary of the major results are provided herein.
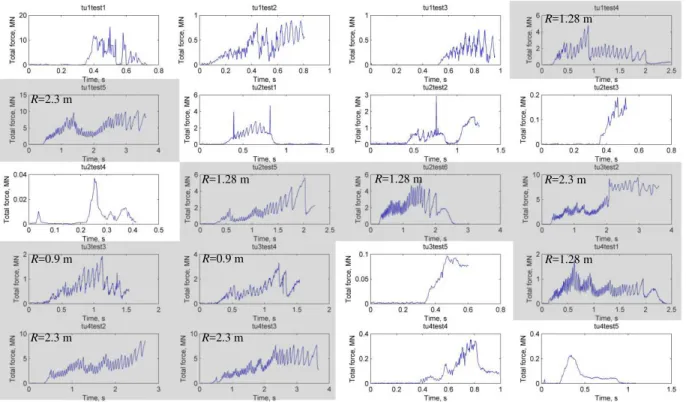
The tests were conducted on iceberg ice using spherically-terminated indenters with radii (R) 0.2, 0.4, 0.9, 1.28 and 2.3 m and therefore involve loading a large volume of ice. The experiments were performed in a manner to minimize effects of sample boundaries. The impact simulation tests were velocity controlled. The velocity was initially 0.1 m/s and it decreased during the penetration, coming to zero at a penetration depth of 0.1R. The iceberg ice density was 903±3 kg/m3 (measured on site), and the average grain size (d) was 10 mm in diameter (measured in the laboratory). Masterson et al. (1992) used local peaks of the load-time histories to construct pressure–area plots. The pressure on the projected area of the indenter was calculated as the measured load from the load cells divided by the contact area at the time of peak load. The surface contact area, calculated from indenter penetration as a function of time, was used in the pressure calculations. Pressure was found to decrease with increasing theoretical contact area, and for a specific area of contact, the pressure decreases as the indenter curvature (1/R) increases. The pressure-area data for the 2.3-m indenter have been used for the local ice pressure calculations in ISO19906 (2010), Section “Local ice actions”. Figure 1 shows force versus time curves that were registered during the experiments at Pond Inlet.
Figure 1. Force versus time curves that were registered during the indentation into the ice; considered data sets (this study) are highlighted in grey.
1.4 Data selection
Indentation of ice is a complex process which depends on many parameters such as ice temperature, indentation rate, ice type, geometry of the ice and the indenter. In the interest of clarity, we consider only results from the tests where possible effects of sample boundaries and grain size were minimized by careful selection of the sample size, of the indenter size and of the experimental setup. In other words, we consider results only from tests that correspond to
so-R=0.9 m R=0.9 m R=1.28 m R=1.28 m R=1.28 m R=1.28 m R=2.3 m R=2.3 m R=2.3 m R=2.3 m
called indentation into an ice wall (Sodhi, 2001) and to indentation into polycrystalline material (i.e., z/d>5.0, where z is the maximum penetration depth). See Table 2 summarizing the data.
Table 2. Data summary
Test ID Indenter radius, m
z/d Selected (y/n) Reason
Tu1test1 0.20 2 n z/d <5.0
(uncertain force data)
Tu1test2 0.40 4 n z/d <5.0
Tu1test3 0.40 4 n z/d <5.0
Tu1test4 1.28 12.8 y
Tu1test5 2.30 23 y
Tu2test1 0.90 9 n odd force-time history Tu2test2 0.90 9 n odd force-time history
Tu2test3 0.40 4 n z/d <5.0 Tu2test4 0.20 2 n z/d <5.0 Tu2test5 1.28 12.8 y Tu2test6 1.28 12.8 y Tu3test2 2.30 23 y Tu3test3 0.90 9 y Tu3test4 0.90 9 y Tu3test5 0.20 2 n z/d <5.0 Tu4test1 1.28 12.8 y Tu4test2 2.30 23 y Tu4test3 2.30 23 y Tu4test4 0.40 4 n z/d <5.0 Tu4test5 0.40 4 n z/d <5.0
In Figure 1, the considered data sets are highlighted in grey. The data include in total 10 indentation tests, among which are two indentation tests with indenter of R of 0.9 m, four tests with R of 1.28 and four tests with R of 2.3 m. For each selected test, the total load versus time curves (see Figure 1) were used to calculate and plot Ѱs versus normalized crushed volume. The
normalized crushed volume (VN) at any given point in time was determined using the
corresponding displacement of the indenter (z) according to Eq. (4).
3 2 5 . 0 3 2 ) 3 ( 3 1 ) ( R z R z V V z VN z π π − = = [4]
In Eq. (4), the nominator Vz is the volume of a spherical cup of height z (Vz is equivalent to the
nominal volume of ice replaced by a spherical indenter of radius R). The denominator V0.5 is the
volume of hemisphere with radius R.
Figure 2 shows the MSEI values (Eq. 3) versus normalized crushed volume for all selected tests. The normalized crushed volume was calculated as a ratio between the nominal crushed volume
at the penetration depth z and the nominal crushed volume at depth z = R. Figure 3 shows variation of the mean value and the standard deviation (as error bars) of the MSEI as a function of crushed volume Vz. For comparison, the average values of MSEI for lake ice are also given in
Figure 3.
Figure 2. Mass-specific energy index (MSEI) of iceberg ice versus normalized crushed volume (VN).
Figure 3. Variation of the mean value and the standard deviation (as error bars) of the MSEI as a function of crushed volume (Vz).
MSEI=14.0 kJ/kg for winter lake ice (Kheisin and Likhomanov, 1973)
1.5 Observations
This section highlights the specific energy trends observed from the analysis of the test results in Figure 2 and Figure 3. For the purpose of analysis it is useful to think of the horizontal axis in Figures 2 and 3 as a relative measure of the penetration depth.
Looking at the data in Figures 2 and 3 one of the possible interpretations is the following:
− The MSEI of iceberg ice decreases slightly with the penetration depth (larger normalized crushed volumes) and approaches a horizontal asymptote for larger depths.
− There is no apparent correlation of the crushing specific energy of the ice with indenter size, nor is there clear consistency in the values for tests conducted with the same indenter. At larger penetration depths, dissimilarities in ice from tunnel to tunnel may account, to some degree, for the spread.
− MSEI data for larger penetration depths has smaller spread. A part of the reason is that at larger penetrations depths, more data are being used for assessing the MSEI, hence lowering the spread.
4. Discussion of results
In this study, the impact response of iceberg ice at –10○C has been re-analyzed for three different indenter radii with the focus on the mass-specific energy absorption capacity within the brittle regime. The results (in Figure 2) have indicated that the MSEI for any particular test tends to flatten out to a constant value regardless of the crushing volume or the indenter radius. This is not surprising, because the pressure versus area curves from several laboratory and in situ experiments also show a roughly constant pressure value if the saw-teeth are smoothed out for indentation-type tests. Gagnon (2014) performed a pressure-area re-analysis of the data from impacts of the Louis St. Laurent vessel with sea ice that covered a large range of contact area (up to approximately 15 m2) and observed a roughly flat pressure–area relationship. Similarly, if one looks at data from Hobsons’s Choice Ice Island tests, one can see similar behavior.
Similar to this study, in some drop-ball type laboratory experiments, such as Gagnon and Gammon (1997) and Timco and Frederking (1990), the specific energy of the ice is higher at smaller crushed volumes and then tends to flatten out as the volume increases. This may be attributed to a fact that as a larger volume of ice is engaged, the effects of local asperities and inhomogeneities are likely to be less significant. Another explanation is related to the observation of the high kinetic energy of ejecta from the overall contact zone in the early stages of the tests. The ejecta consists of chunks of ice, smaller pieces corresponding to spalls or pieces of spalls, pulverized ice that is wet to some extent due to liquid flowing out of relatively intact hard zones and also liquid produced at ice-ice contacts during the pulverization. The processes involved in the ice crushing occur throughout the whole event however it seems that more kinetic energy is produced in the earlier stage.
It is important to know how the testing procedures affect the calculated specific energy values. Although the effects of temperature have not been addressed in this study, the volume-specific energy index of iceberg ice was found to decrease with increasing temperature (Gagnon and Gammon, 1997). This is similar to the behavior of laboratory-grown freshwater polycrystalline
ice, lake ice and natural sea ice (Barnes et al., 1971; Kheisin and Likhomanov, 1973; Tsuprik, 2013).
The effects of the impact velocity on the specific energy values are still unclear. The numerous data points reported by Barnes et al. (1971) demonstrate an effect of loading rate (ice deformation regime) on the specific energy. Here it should be noted that for cases where the ice response is dominated by the brittle failure mechanisms, the effects of loading rate are difficult to capture. In particular, within the rage from 1.5 to 6.0 /s, no velocity effects can be traced from the data by Kheisin and Likhomanov (1973). A possible reason for this weak, if any velocity effect is that the brittle compressive strength of ice is weakly dependent on the loading rate. Another important consideration when analyzing laboratory data and especially large scale field data is the nature of the test setup itself. In a sense, the test configuration may lead to substantial energy being dissipated by the apparatus rather than the ice. For instance, when we have a spherically-terminated or wedge-shaped indenter there will be a tendency for lateral loads to occur as ice pieces may break from the contact zone in an unsymmetrical fashion. That is, a large ice piece may break from one side of the contact zone in front of the hemispherical indenter that causes the remaining ice to push more on the other side of the indenter. Because the indenter is rounded this will create a certain amount of side loading that may cause the apparatus to move sideways to some extent depending on how well it is constrained. Nevertheless the apparatus heaves around in a back and forth sideways fashion in addition to its forward motion during the test and substantial energy goes into pushing the apparatus laterally. In Pond Inlet impact tests, it does not appear to be a tendency to develop major cracks or fractures which could result in large scale flaking and sideway motions of the indenter. Crack penetration was relatively shallow, and the indenters were moving ahead at a strictly controlled rate (Geotech Arctic Services, 1985). But the sideways-type of motion was very obvious in Hobson’s Choice Ice Island tests where a wedge-shaped indenter was used. In this case, the energy of lateral motion has nothing to do with removing ice from the contact zone and it tends to introduce errors in the calculation of specific energy.
This implies that it would be better to analyze tests where a flat rigid indenter is used to indent convex-shaped ice faces/features because there would be no side forces imposed on the apparatus. Besides, this type of test is more relevant for engineering problems such as wave driven bergy-bit and/or growler impact or as in ice edge crushing during ship-ice interactions. It should be also noted that for highly convex ice geometry, it will be easier for ice to spall, and one can anticipate that the specific energy values will be somewhat lower than those for the considerably less convex geometry. This is due to the fact that when a flat-type indenter is pushed against a convex ice surface, the degree of ice confinement at the ice/indenter interface will be somewhat lower than that when a spherically shaped indenter is pushed into a flat ice surface. At present, there is a lack of systematic experimental data to further comment on this. For future indentation or impact tests we think it could be important to track the actual contact areas of high-pressure and low-pressure zones during the course of the penetration, in order to get a more accurate estimate of the specific energy of the ice. That, for example, could be done with the kind of pressure sensing technology available at the National Research Council of Canada (NRC), see e.g., Sopper et al. (2015).
5. Conclusions
As a contribution to current and previous research dealing with specific energies, we have found that under certain conditions for any particular test, the crushing specific energy of natural iceberg ice shows little, if any, dependency on the volume of the displaced ice and tends towards a constant value. Furthermore, there is no apparent correlation of the crushing specific energy of the ice with indenter size. This weak dependence on the crushed volume (and indenter size) makes the crushing specific energy a candidate-parameter for use in engineering models of ice impact loads and for use in numerical simulations of ice crushing. To study this topic further and to provide good information on the crushing specific energy, certain types of experiments (i.e., a flat-type indenter pushing against an ice cone or a wedge) would be more useful. These types of tests would be easier to analyze since using a flat indenter would reduce the tendency of the apparatus to move sideways during ice spalling events, depending on the efficacy of the actuator control system.
Acknowledgments
This work is a part of investigations conducted within the Centre for Autonomous Marine Operations and Systems (AMOS) and the Centre for Sustainable Arctic Marine and Coastal Technology (SAMCoT) at the Norwegian University of Science and Technology. We would like to thank Bob Frederking for providing the original report and data from the NRC Ottawa archives. Ekaterina Kim would also like to acknowledge the support from the Research Council of Norway through the SAMCoT CRI (Project no. 203471) and through the AMOS CoE (Project no. 223254) and the support from all SAMCoT and AMOS partners.
References
Barnes, P., Tabor, D. and Walker, J.C.F., 1971, The Friction and Creep of Polycrystalline Ice. Proceedings of the Royal Society of London A: Mathematical, Physical and Engineering Sciences, 324: 127-155.
Gagnon, R.E. and Gammon, P.H., 1997, In situ thermal profiles and laboratory impact experiments on iceberg ice. Journal of Glaciology, 43: 569-582.
Gagnon, R.E., 2014, Re-analysis of load and pressure data acquired from ice impacts during the CCGS Louis St-Laurent 1994 Arctic voyage. 22nd IAHR International Symposium on Ice, Singapore.
Garcia, N.B., Farrell, D. and Mellor, M., 1985, Ice penetration tests. Cold Regions Science and Technology, 11: 223-236.
Geotech Arctic Services, 1985, Medium scale iceberg impact simulation test program. Report prepared for Mobil Oil Canada, Ltd., CHC 20-37.
IACS, 2011, Unified Requirements for Polar Ships: I2 ‒ Structural requirements for Polar Class ships. International Associationof Classification Societies.
ISO19906, 2010, Petroleum and natural gas industries ‒ Arctic offshore structures. International Organization for Standardization.
Kheisin, D.E. and Likhomanov, V.A., 1973, Experimental determination of specific energy of mechanical disintegration of ice at an impact. Problems of Arctic and Antarctic, 41: 55-61.
Masterson, D.M., Nevel, D.E., Johnson, R.C., Kenny, J.J. and Spencer, P.A., 1992, The medium scale iceberg impact test program. 11th International Symposium on Ice IAHR, 2: 930-966.
Pounder, E.R. and Little, E.M., 1959, Some physical properties of sea ice. I. Canadian Journal of Physics, 37: 443-473.
RMRS, 2014, Rules for the Classification and Construction of Sea-going Ships vol. 1. Russian Maritime Register of Shipping, Saint-Petersburg.
Sodhi, D.S., 2001, Crushing failure during ice–structure interaction. Engineering Fracture Mechanics, 68: 1889-1921.
Sopper, R., Gagnon, R., Daley, C. and Colbourne, B., 2015, Measurements of spatial and temporal variations in ice impact pressures. Proceedings of the 23rd International Conference on Port and Ocean Engineering under Arctic Conditions, POAC-2015, Paper #149.
Timco, G.W. and Martin, R.A., 1979, Impact strength tests on Ottawa River ice. Report LTR-LT-97, National Research Council Canada.
Timco, G.W. and Frederking, R.M.W., 1990, Drop impact tests on freshwater ice:spherical head. IAHR Ice Symposium: 776-778.
Timco, G.W. and Frederking, R.M.W., 1993, Laboratory impact tests on freshwater ice. Cold Regions Science and Technology, 22: 77-97.
Tsuprik, V.G., 2013, Study of specific energy of mechanical destruction of ice for calculation of ice load on ships and offshore structures. Journal of the Korean Society of Marine Engineering, 37: 718-728.