Publisher’s version / Version de l'éditeur:
Questions? Contact the NRC Publications Archive team at
[email protected]. If you wish to email the authors directly, please see the first page of the publication for their contact information.
https://publications-cnrc.canada.ca/fra/droits
L’accès à ce site Web et l’utilisation de son contenu sont assujettis aux conditions présentées dans le site LISEZ CES CONDITIONS ATTENTIVEMENT AVANT D’UTILISER CE SITE WEB.
Technical Report (National Research Council of Canada. Institute for Ocean Technology); no. TR-2006-09, 2006
READ THESE TERMS AND CONDITIONS CAREFULLY BEFORE USING THIS WEBSITE.
https://nrc-publications.canada.ca/eng/copyright
NRC Publications Archive Record / Notice des Archives des publications du CNRC :
https://nrc-publications.canada.ca/eng/view/object/?id=9eb93426-6c38-48b9-9dd0-dbc21bd55491 https://publications-cnrc.canada.ca/fra/voir/objet/?id=9eb93426-6c38-48b9-9dd0-dbc21bd55491
NRC Publications Archive
Archives des publications du CNRC
For the publisher’s version, please access the DOI link below./ Pour consulter la version de l’éditeur, utilisez le lien DOI ci-dessous.
https://doi.org/10.4224/8896281
Access and use of this website and the material on it are subject to the Terms and Conditions set forth at
Assessment of life raft performance in regular waves using 1:7 scaled
models
DOCUMENTATION PAGE
REPORT NUMBERTR-2006-09
NRC REPORT NUMBER DATE
July 2006 REPORT SECURITY CLASSIFICATION
Unclassified
DISTRIBUTION Unlimited TITLE
ASSESSMENT OF LIFE RAFT PERFORMANCE IN REGULAR WAVES USING 1:7 SCALED MODELS
AUTHOR(S)
J. Power, A. Simões Ré and L. Mak
CORPORATE AUTHOR(S)/PERFORMING AGENCY(S)
Institute for Ocean Technology, National Research Council, St. John’s, NL PUBLICATION
SPONSORING AGENCY(S)
Search and Rescue New Initiative Fund (SAR-NIF) IOT PROJECT NUMBER
42_2064_16
NRC FILE NUMBER
KEY WORDS
Liferaft, Model, RAO, Tow Force
PAGES viii, 50 FIGS. 45 TABLES 16 SUMMARY
The purpose of this report is to examine the operational performance of 1:7 scale models of a commercially available 16 and 42-person capacity life rafts under a variety of
controlled weather conditions. The use of models allows us to test the performance of the life rafts in weather conditions that would be too extreme to test in full scale, open water trials. The goal for this project is that the collected information can be used to fill in the current knowledge gap, which would benefit the marine operators, the regulatory bodies, the search and rescue planners, the training providers, and the manufactures in developing news designs.
ADDRESS National Research Council Institute for Ocean Technology Arctic Avenue, P. O. Box 12093 St. John's, NL A1B 3T5
National Research Council Conseil national de recherches Canada Canada Institute for Ocean Institut des technologies
Technology océaniques
ASSESSMENT OF LIFE RAFT PERFORMANCE IN REGULAR WAVES
USING 1:7 SCALED MODELS
TR-2006-09
J. Power, A. Simões Ré and L. Mak
iv
Table of Contents
Table of Contents ... iv
List of Figures...v
List of Tables ... viii
1.0 Introduction ... 1
2.0 Project Objectives and Scope ... 2
3.0 Test Program and Test Setup... 3
3.1 Test Facility... 3
3.2 Model Life Rafts ... 3
3.3 Drogue ... 5 3.4 Wind... 5 4.0 Instrumentation... 7 4.1 Data Acquisition... 7 4.2 Co-ordinate Systems ... 8 5.0 Test Program ... 9 5.1 Test Methodology ... 12
6.0 Results and Discussion ... 15
6.1 Calm Water Tows ... 15
6.2 Tow in Regular Waves ... 19
6.2.1 Heave RAO’s ... 19
6.2.2 Pitch RAO’s ... 26
6.2.3 Effects of wave slope, frequency and towing speed on mean tow force ... 32
6.3 Drift Tests ... 46
7.0 Conclusions ... 49
List of Figures
Figure: 3.1 Drawing of Institute for Ocean Technology’s clear water tow tank (all
distances in meters). ... 3 Figure 3.2: Model IOT 721 of a 16-person life raft with wire frame and Qualysis optical tracking markers attached. ... 4 Figure 3.3: Model IOT 722 of a 42 person life raft with wire frame and Qualysis optical tracking markers attached. ... 4 Figure 3.4: Stability pockets attached to model IOT 721. ... 5 Figure 3.5: Photo of sea anchor used on both the IOT 721 and IOT 722 model life rafts . 5 Figure 3.6: Wind fans mounted on the bottom of the main tow carriage. ... 6 Figure 5.1: IOT 721 model raft, layout of even ballast conditions (squares designate ballast weight position) ... 10 Figure 5.2: IOT 721 model raft, layout of uneven ballast conditions (squares designate ballast weight positions)... 10 Figure 5.3: IOT 722 model raft, layout of even ballast conditions (squares designate ballast weight position) ... 11 Figure 5.4: IOT 722l raft, layout of uneven ballast conditions (squares designate weight ballast position)... 11 Figure 5.5 Test setup. ... 13 Figure 5.6: Drift test setup ... 14 Figure 6.1. Effect of varying setup conditions on tow force for model IOT 721. (Ballast Configuration, Floor Inflating State, Drogue Deployed)... 15 Figure 6.2: Effect of varying setup conditions on tow force for IOT 722 (Ballast
Configuration, Floor Inflating State, Drogue Deployed)... 16 Figure 6.3: Effects of drogue deployment on IOT 721 and IOT 722 (Even ballast, floor inflated) ... 16 Figure 6.4: Effects of ballast condition on IOT 721 and IOT 722 (Floor inflated, drogue deployed)... 17
vi
Figure 6.5: Effects of floor inflation on IOT 721 and IOT 722(Even ballast, drogue deployed)... 18 Figure 6.6: Summary plot of the effect of different raft conditions for IOT 721 and IOT 722 on tow force at speeds from 0.19 m/s to 0.78 m/s. Baseline case is even ballast distribution, floor inflated, and drogue deployed. ... 19 Figure 6.7: IOT 721 and IOT 722 heave RAO in 1:10 slope waves in Beaufort 5
equivalent winds... 21 Figure 6.8 IOT 721 and IOT 722 heave RAO in 1:10 slope waves in Beaufort 6
equivalent winds ... 21 Figure 6.9: IOT 721 and IOT 722 heave RAO in 1:15 slope waves in Beaufort 5
equivalent winds... 22 Figure 6.10: IOT 721 and IOT 722 heave RAO in 1:15 slope waves in Beaufort 6
equivalent winds... 22 Figure 6.11: IOT 721 and IOT 722 heave RAO in 1:20 slope waves in Beaufort 5
equivalent winds... 23 Figure 6.12: IOT 721 and IOT 722 heave RAO in 1:20 slope waves in Beaufort 6
equivalent winds... 23 Figure 6.13: IOT 721 and IOT 722 pitch RAO in 1:10 slope waves in Beaufort 5
equivalent winds ... 27 Figure 6.14: IOT 721 and IOT 722 pitch RAO in 1:10 slope waves in Beaufort 6
equivalent winds ... 27 Figure 6.15: IOT 721 and IOT 722 pitch RAO in 1:15 slope waves in Beaufort 5
equivalent winds... 28 Figure 6.16: IOT 721 and IOT 722 pitch RAO in 1:15 slope waves in Beaufort 6
equivalent winds... 28 Figure 6.17: IOT 721 and IOT 722 pitch RAO in 1:20 slope waves in Beaufort 5
equivalent winds... 29 Figure 6.18: Model 16 and 42 person rafts pitch RAO in 1:20 slope waves in Beaufort 6 equivalent winds... 29 Figure 6.19: Tow force times series for IOT 722 at 0.664 Hz wave frequency, 1:10 slope, in Beaufort 6 equivalent winds, being towed at 0.19 m/s... 33
Figure 6.20: Mean tow force plus 2 standard deviation for IOT 721 across slope at
varying tow speeds in Beaufort 5 equivalent winds... 34 Figure 6.21: Mean tow force plus 2 standard deviation IOT 721 across slope at varying tow speeds in Beaufort 6 equivalent winds. ... 35 Figure 6.22: Mean tow force plus 2 standard deviation IOT 722 across slope at varying tow speeds in Beaufort 5 equivalent winds. ... 36 Figure 6.23: Mean tow force plus 2 standard deviation for IOT 722 across slope at
varying tow speeds in Beaufort 6 equivalent winds... 37 Figure 6.24: Mean tow force plus two standard deviation for IOT 721 across speed at varying slopes in Beaufort 5 equivalent winds... 38 Figure 6.25: Mean tow force plus two standard deviation for IOT 721 across speed at varying slopes in Beaufort 6 equivalent winds... 39 Figure 6.26: Mean tow force plus two standard deviation for IOT 722 across speed at varying slopes in Beaufort 5 equivalent winds... 40 Figure 6.27: Mean tow force plus two standard deviation for IOT 722 across speed at varying slopes in Beaufort 6 equivalent winds... 41 Figure 6.28: Tow force (mean + 2 standard deviation) for IOT 721 vs IOT 722 compared at 1:10 slope at 0.19, 0.39, and 0.58 m/s speeds... 42 Figure 6.29: Tow force (mean + 2 standard deviation) for IOT 721 vs IOT 722 compared at 1:15 slope at 0.19, 0.39, and 0.58 m/s speeds... 43 Figure 6.30: Tow force (mean + 2 standard deviation) for IOT 721 vs. IOT 722 compared at 1:20 slope at 0.19, 0.39, and 0.58 m/s speeds... 44 Figure 6.31: Comparison of tow force mean values against tow force mean + 2 standard deviation values for IOT 721 and IOT 722 at 1:10 slope waves with a speed of 0.58 m/s in Beaufort 5 equivalent conditions. ... 45 Figure 6.32: Heave RAO for IOT 721 and IOT 722 during drift tests from Beaufort 4-7 equivalent conditions. ... 47 Figure 6.33: Pitch RAO for IOT 721 and IOT 722 during drift tests in Beaufort 4-7 equivalent conditions. ... 48
viii
List of Tables
Table 4.1: Signal acquisition from model life rafts... 7
Table 4.2 Signal acquisitions from main tow carriage... 7
Table 5.1 Test matrix ... 9
Table 5.2: Full scale Beaufort wind speeds and their model scale equivalents... 14
Table 6.1: IOT 721 heave RAO at 0.19 m/s speed... 24
Table 6.2 IOT 721 heave RAO at 0.39 m/s speed... 24
Table 6.3: IOT 721 heave RAO at 0.58 m/s speed... 24
Table 6.4: IOT 722 heave RAO at 0.19 m/s speed... 25
Table 6.5: IOT 722 heave RAO at 0.39 m/s speed... 25
Table 6.6: IOT 722 heave RAO at 0.58 m/s speed... 25
Table 6.7: IOT 721 pitch RAO at 0.19 m/s. ... 30
Table 6.8: IOT 721 pitch RAO at 0.39 m/s. ... 30
Table 6.9: IOT 721 pitch RAO at 0.58 m/s. ... 30
Table 6.10: IOT 722 pitch RAO at 0.19 m/s. ... 31
Table 6.11: IOT 722 pitch RAO at 0.39 m/s ... 31
Table 6.12: IOT 722 pitch RAO at 0.58 m/s. ... 31 .
1.0 Introduction
Large and small ships travelling across the open ocean can sometimes meet with disastrous results. While many large ships and vessels are designed to withstand
extremely hostile weather, they are not invincible to the elements. As a result, these ships and vessels can become compromised and the order to abandon ship can be given. In order to enhance the survival of personnel and passengers in the ocean, vessels are often outfitted with inflatable life rafts for use in these emergencies. When a vessel does become comprised, these inflatable life rafts are sometimes the only life saving appliance that will keep people from drowning. Even though inflatable life rafts are considered an extremely important piece of survival equipment for vessels and ships travelling about the ocean, there are still a lot of unknown environmental conditions that may affect the operational performance of the life raft.
Current operational standards for most commercially available life rafts have only been done in calm water, under the most ideal conditions. This is a cause for concern as it is quite possible that an emergency situation resulting in abandonment of the ship or vessel could occur in less than ideal conditions. It is unknown at this time what are the range of weather conditions that can limit the operational performance of life rafts.
The purpose of this report is to examine the operational performance of 1:7 scale models of a commercially available 16 and 42-person capacity life rafts under a variety of controlled weather conditions. The use of models allows us to test the performance of the life rafts in weather conditions that would be too extreme to test in full scale, open water trials. The goal for this project is that the collected information can be used to fill in the current knowledge gap, which would benefit the marine operators, the regulatory bodies, the search and rescue planners, the training providers, and the manufactures in
2
2.0 Project Objectives and Scope
The overall objectives of this experimental study are to examine the effects of environmental and raft variables on life raft motions and tow force on a 1:7 model scale of a 16 and 42 person life raft. The environmental variables included regular waves with varying frequencies and slopes, and wind speeds at Beaufort equivalent levels of 4, 5, 6, and 7. The raft variables included ballasting conditions (even and uneven), floor inflation, and sea anchor deployment. Listed below are the specific objectives tested for:
1. Examine the effects of sea anchor deployment, state of floor inflation,
distribution of occupants (simulated by ballast weight), and tow speeds for the 16 and 42 person model rafts on tow force, accelerations, and raft motion in calm water conditions.
2. Examine the effects of wave frequency, wave slope, wind speed, and tow speeds on the life raft Response Amplitude Operator (RAO).
3. Compare the life raft RAO and tow force between the 16 and 42 models. The present series of tow tests were conducted using custom fabricated 1:7 scale models of a typical SOLAS approved 16 (Model Number: IOT 721)and 42 (Model Number: IOT 722) person life rafts. The tests were carried out in uni-directional waves and wind with the model rafts being towed by the main carriage in the Clear Water Tow Tank located at the Institute for Ocean Technology. The towing effects of the main carriage on the models is similar to their full scale counterparts being towed by a large vessel (an infinite mass) as opposed to a small craft, such as a rigid inflatable boat, in which case the tow load would affect the source of propulsion.
3.0 Test Program and Test Setup
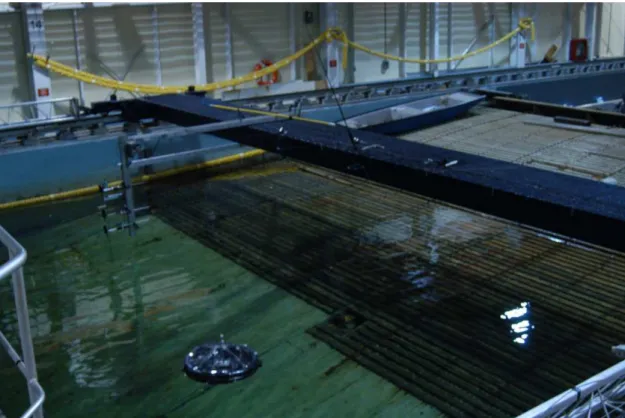
3.1 Test Facility
The test program was conducted in the Clear Water Tow Tank facility located at the Institute for Ocean Technology. The tank itself is 200m long, 12m wide, and 7m deep. The tank is equipped with two carriages: the main towing carriage, and a smaller service carriage that can be attached to the main one. The main towing carriage is capable of travelling down the tank up to a maximum speed of 10 m/s. Fans can be installed underneath the main carriage to simulate the effects of wind on the model rafts as they are being towed. The main carriage itself is equipped with a VMS and Windows based distributed client/server data acquisition system. Located on the far end of the tow tank is a dual-flap wave maker that is capable of generating regular and irregular uni-directional waves from frequencies ranging from 0.1 Hz to 1.8 Hz with a maximum significant wave amplitude of 0.5m. Located on the opposite end of the tank is a parabolic beach that is used for wave absorption.
Figure: 3.1 Drawing of Institute for Ocean Technology’s clear water tow tank (all distances in meters).
3.2 Model Life Rafts
IOT model rafts IOT 721 and IOT 722 were 1:7 scale models of typical SOLAS approved 16 and 42 person life rafts manufactured by Newfoundland Marine Safety Systems used for this testing. IOT 721 had two separate inflation tubes, an upper and lower, as well as an inflatable floor and a clear canopy. A wire frame was attached to the raft (see diagram) to allow for placement of the optical tracking system (Qualysis)
markers. The weight of the raft uninflated with the wire frame was 1.1kg. IOT 722 had two separate inflation tubes, an upper and lower, as well as an inflatable floor and a clear canopy. A wire frame was also attached to allow for placement of the Qualysis markers. The weight of IOT 722 was 2.2kg with the wire frame. Each model life raft was equipped with miniature stability pockets; 8 on IOT 721 and 16 on IOT 722.
4
Figure 3.2: Model IOT 721 of a 16-person life raft with wire frame and Qualysis optical tracking markers attached.
Figure 3.3: Model IOT 722 of a 42 person life raft with wire frame and Qualysis optical tracking markers attached.
Figure 3.4: Stability pockets attached to model IOT 721.
3.3 Drogue
A 1:7 scale model of a conventional drogue was used for all testing. The drogue’s diameter measured 5.5cm across the opening, and was 6cm long from the opening to the bottom of the cone. The same drogue was used on both the models IOT 721 and IOT 722. The model drogue is pictured in figure 3.5
Figure 3.5: Photo of sea anchor used on both the IOT 721 and IOT 722 model life rafts
3.4 Wind
Wind was generated by two banks of six analog controlled fans mounted side by side underneath the main tow carriage. Each fan was powered by a DC motor and had a blade diameter of 530mm. Mounted on the fans were horizontal louvers that allowed the wind flow to be directed upward or downward. The louvers were positioned at an angle of 20° down from the horizontal plane. The fans were controlled by an operator on the main carriage and could be set to produce wind speeds up to and over 8m/s.
6
4.0 Instrumentation 4.1 Data Acquisition
Two data acquisition systems were used in this test program. One system was used to collect signals from the rafts while the other was used to collect signals on the main tow carriage. The system in the raft used a PIC (Programmable Integrated Circuit)acquisition system that was connected to a radio transmitter. The radio transmitter allowed the signals collected from the raft to be sent wirelessly to the main tow carriage which were then acquired by GDAC (GEDAP (Generalized Experimental Control and Data
Acquisition Package) Data Acquisition and Control) client-server acquisition system. On the main carriage, the data acquisition system was tied directly into the GDAC client-server acquisition system.
The following table shows the signals collected on the rafts: Table 4.1: Signal acquisition from model life rafts
Signal Instrumentation Sample Rate
Raft surge, sway
accelerations (-10g to +10g) and heave accelerations (-8g to +8g). Yaw, pitch and roll rates (-300 deg/s to +300 deg/s)
Motion Pak II 6 degrees-of-freedom motion sensor
260 Hz
Sea anchor Force Load Cell 260 Hz
The following tables show the signals collected from the main carriage. Table 4.2 Signal acquisitions from main tow carriage.
Signal Instrumentation Sample Rate
Carriage position Main Carriage Sensors 50 Hz
Carriage speed Main Carriage Sensors 50 Hz
Encounter wave probe Capacitance wave probe 50 Hz
Upstream wave probe Capacitance wave probe 50 Hz
Tow force Load cell 50 Hz
Raft surge, sway and heave displacements. Yaw, pitch and roll angles
Qualysis optical tracking system
50 Hz
Wind drive Volt meter 50 Hz
8
4.2 Co-ordinate Systems
Two co-ordinate systems were used for this experiment. The first was a right hand global co-ordinate system relative to the main towing carriage used for Qualysis. The positive x-axis is defined as parallel to the tow direction, down the tank towards the wave makers. The positive y-axis is defined as directly to port of the tow direction by 90° counter-clockwise. The positive z-axis is defined as pointing up. The second co-ordinate system was a local right hand co-ordinate system within the raft with its origin located directly in the geometric centre of the model used to place instrumentation and ballast. The x, y, and z were defined the same as that used for the global Qualysis system.
5.0 Test Program
The test program was divided into three main components:
1. Tow tests for both the 16 and 42 person model rafts in calm water with varying conditions on the raft.
2. Tow tests for both the 16 and 42 person model rafts in regular waves of varying frequency and slope, and in varying Beaufort equivalent levels.
3. Un-tethered drift tests for both the 16 and 42 person model rafts in regular waves of varying frequency and 1:15 slope, and in Beaufort equivalent levels of 4, 5, 6, and 7.
For the regular wave conditions, the wave frequencies varied from 0.581 Hz to 1.245 Hz, in intervals of 0.083 Hz, at slopes of 1:10, 1:15, and 1:20. The wind speed ranged from Beaufort 4 to 7 equivalent.
The test matrices for this program are shown below. Due to the length of the tow tank we were able to tow at three separate speeds during each test run in calm and regular wave conditions. These speeds ranged from 0.19m/s to 0.78m/s (1-4 knots full scale) in intervals of 0.04 m/s
Table 5.1 Test matrix
Weight Distribution
Floor
Inflation Sea Anchor Calm Water
Regular Waves
Drift Test
Even Inflated Yes Y Y Y
Even Inflated No Y
Even Un-inflated Yes Y
Even Un-inflated No Y
Uneven Inflated Yes Y
Uneven Inflated No Y
Uneven Un-inflated Yes Y
Uneven Un-inflated No Y
Both models IOT 721 and IOT 722 were tested at all wave frequencies and slopes for regular waves. The notable exception to this was that it was not possible to model IOT 722 in 1:10 slope waves at frequency 0.581 Hz. At this frequency and slope, the waves reached a height that caused them to impact the bank of fans mounted underneath the main tow carriage. When model IOT 721 was tested at that wave frequency and slope, the fans had been mounted differently underneath the tow carriage. For safety reasons, the fans were mounted differently when model IOT 722 was tested. Small lead weights (32) weighing about 142g each were used as ballast. Each weight had a small portion of Velcro on its underside that allowed for easy and secure attachment to the raft.
10
The model rafts were ballast to about 75% capacity of the rated total compliment of their full-scale counterparts. This would equal 12 occupants weighing 75kg each in IOT 721 and approximately 31, 75kg occupants in IOT 722. The ballast weights were simply repositioned in the rafts to switch from “even ballast” to “uneven ballast” conditions.
Figure 5.1: IOT 721 model raft, layout of even ballast conditions (squares designate ballast weight position)
Figure 5.2: IOT 721 model raft, layout of uneven ballast conditions (squares designate ballast weight positions)
Direction of Tow
Figure 5.3: IOT 722 model raft, layout of even ballast conditions (squares designate ballast weight position)
Figure 5.4: IOT 722l raft, layout of uneven ballast conditions (squares designate weight ballast position)
Direction of Tow
12
5.1 Test Methodology
After the completion of the standard Institute for Ocean Technology wind and wave calibration procedures, the investigation of the performance of the model life rafts began.
Prior to the start of any testing in the morning, IOT 722 was inflated to the following pressure: 1.0 psi for both the upper and lower chambers, and 0.5 psi for the floor. IOT 721 did not have valves on it that would allow us to measure the pressure accurately. A new battery was placed in the MotionPak unit each morning as well. The raft models were then secured to both its tow line (connected to the main carriage) and its tag line (connected to the service carriage). The tow line was connected to a 50lb load cell that had a 16-bit resolution system. The tag line on the models remained slack during all tow tests up the tank. Tests were then performed according to the test matrix. Once a run was completed up the tank, the main carriage would travel back down the tank to its home position. A 10-15 minute wait period was established in between each test run to allow the tank to “settle” and have any remaining waves dissipate.
Two wave probes were utilized during the testing phase. One was located at a fixed position 175m down the tow tank while the other was attached to the service carriage roughly in the same transverse plane as that of the centre of the life raft.
Two banks of six wind fans were installed underneath the main tow carriage. The positioning of the fans allowed them to generate wind directly onto the rafts. A bank of wind anemometers were connected to the service carriage and placed in the same horizontal plane as the model life raft.
During the testing programs, the main tow carriage and the service carriage were connected to one another with aluminium frames used as spacing bars. This allowed the main tow carriage and the service carriage to move together up and down the tank. This also ensured that the wave probe mounted on the service carriage stayed in the same transverse plane as the model life raft during testing. A 4.29m (30m full scale) tow line extended from underneath the main carriage and was used to tow the models up the tank starting from the beach end and moving towards the wave maker. When each
experimental run was concluded, the main carriage would move back down (from the wave maker end) towards the beach to initiate another run after allowing the water in the tank to settle for about 10-15 minutes. A video camera was mounted on the side of the tank on one of the spacer bars in the horizontal plane of the life raft. Another video camera was mounted directly in front of the raft high on the main tow carriage looking down. Both video cameras were used to capture the motions of the raft.
Figure 5.5 Test setup.
For drift tests with the model IOT 721, the raft was left unattached to both the service carriage and main carriage, but remained in the area between the two. The start of the drift test commenced at the end of the tank closest to the wave makers. The raft was not tethered and remained in the spatial area between the main tow carriage and the service carriage. As the raft would drift down the tank, the operator of the main tow carriage used the side video camera to adjust the speed of the carriage to match the raft. This ensured that the raft remained in the area between the two carriages at all times and stayed in the field of view of the Qualysis optical tracking cameras. When the model raft drifted over and went out of optical tracking system field of view the test ended.
A different test methodology was used for the drift tests of IOT 722. In order to prevent the raft from drifting into the tank walls, a fishing pole with standard 10lb fishing line was tied to the top of the raft. An operator was positioned on the service carriage with the fishing pole in hand. As the raft would start to drift past the maximum boundary for the field of view of the Qualysis optical tracking system, the operator would apply just enough force by pulling on the fishing pole to drag the raft back roughly into its original starting position. While this method of positional re-adjustment is obviously not a “true” drift test per se, the method allowed for the drift test trials to have a longer duration and be able to see the performance of the raft over a greater time period.
14 Figure 5.6: Drift test setup
Table 5.2: Full scale Beaufort wind speeds and their model scale equivalents.
Beaufort Level Wind Speed m/s (Full Scale)
Wind Speed m/s (Model Scale)
4 7.14 2.72
5 9.69 3.69
6 12.5 4.76
6.0 Results and Discussion
All speed results presented in this section are given in meters per second (m/s).
6.1 Calm Water Tows
The following figures show the effects of drogue (sea anchor) deployment on IOT 721 and IOT 722.
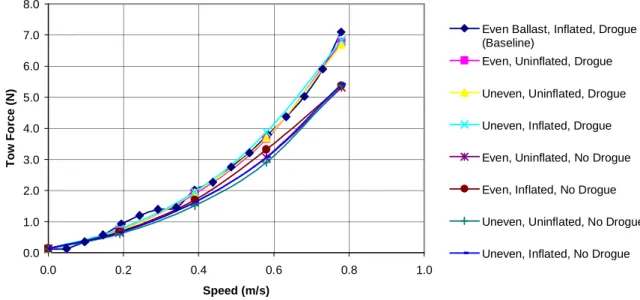
Figure 6.1. Effect of varying setup conditions on tow force for model IOT 721. (Ballast Configuration, Floor Inflating State, Drogue Deployed)
0.0 1.0 2.0 3.0 4.0 5.0 6.0 7.0 8.0 0.0 0.2 0.4 0.6 0.8 1.0 Speed (m/s) T o w F o rc e ( N )
Even Ballast, Inflated, Drogue (Baseline)
Even, Uninflated, Drogue Uneven, Uninflated, Drogue Uneven, Inflated, Drogue Even, Uninflated, No Drogue Even, Inflated, No Drogue Uneven, Uninflated, No Drogue Uneven, Inflated, No Drogue
16
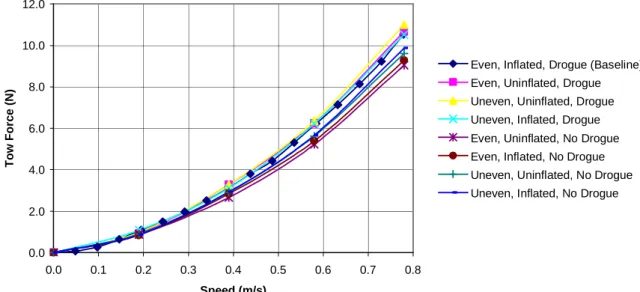
Figure 6.2: Effect of varying setup conditions on tow force for IOT 722 (Ballast Configuration, Floor Inflating State, Drogue Deployed)
Figure 6.3: Effects of drogue deployment on IOT 721 and IOT 722 (Even ballast, floor inflated) 0.0 2.0 4.0 6.0 8.0 10.0 12.0 0.0 0.1 0.2 0.3 0.4 0.5 0.6 0.7 0.8 Speed (m/s) T o w F o rc e ( N )
Even, Inflated, Drogue (Baseline) Even, Uninflated, Drogue Uneven, Uninflated, Drogue Uneven, Inflated, Drogue Even, Uninflated, No Drogue Even, Inflated, No Drogue Uneven, Uninflated, No Drogue Uneven, Inflated, No Drogue
0.0 2.0 4.0 6.0 8.0 10.0 12.0 0.0 0.1 0.2 0.3 0.4 0.5 0.6 0.7 0.8 Speed (m/s) T o w F o rc e ( N ) IOT 721 Drogue IOT 721 No Drogue IOT 722 Drogue IOT 722 No Drogue
As was to be expected, the deployment of the drogue caused an increase in tow loads, which increased as the tow speed reached an equivalent full scale speed of 4 knots (actual speed for the models were 0.78m/s). We see the largest difference between tow loads at the speed of 0.78 m/s. For IOT 721, there was a difference of 1.73N between drogue deployed compared to not deployed. The deployed condition for IOT 722 resulted in a 1.22N larger tow load experienced than when the drogue was not deployed.
Figure 6.4: Effects of ballast condition on IOT 721 and IOT 722 (Floor inflated, drogue deployed)
The effects seen by changing the ballast conditions were less than those observed by changing the drogue condition. For IOT 721, the even ballast condition generated 0.27N more tow force at 4 knots compared to the uneven ballast condition. The opposite is seen for IOT 722. The uneven ballast condition generated 0.98N more force at max speed compared to the even ballast condition.
0.0 2.0 4.0 6.0 8.0 10.0 12.0 0.0 0.1 0.2 0.3 0.4 0.5 0.6 0.7 0.8 Speed (m/s) T o w F o rc e ( N )
IOT 721 Even Ballast IOT 721 Uneven Ballast IOT 722 Even Ballast IOT 722 Uneven Ballast
18
Figure 6.5: Effects of floor inflation on IOT 721 and IOT 722(Even ballast, drogue deployed)
The effects of floor inflation do have the same effect on tow force, as did the ballast arrangement conditions; there is little difference in tow force as the speed
increases. For IOT 721 the greatest difference seen is once again, at max speed, with the floor inflated condition. This generates 0.33N more tow force compared to having the floor un-inflated. The difference in tow force load for IOT 722 less than that for IOT 721. There was only a 0.2N difference in tow loads between the un-inflated and inflated conditions, with the former having the greater tow load.
The small differences observed in the tow loads (< 1N) may be the result of experimental uncertainty, and may not be accurate. As a result, the changing of ballast conditions and floor inflation states had a negligible effect on the tow loads generated by the raft. These loads reported were at the lower range for the load cell, which may not be able to resolve the actual force for such small values. The models themselves were also not completely air tight, and as a result would deflate during the testing program, which may have affected the tow loads.
0.0 2.0 4.0 6.0 8.0 10.0 12.0 0.0 0.1 0.2 0.3 0.4 0.5 0.6 0.7 0.8 Speed (m/s) T o w F o rc e ( N ) IOT 721 Inflated IOT 721 Uninflated IOT 722 Inflated IOT 722 Uninflated
Figure 6.6: Summary plot of the effect of different raft conditions for IOT 721 and IOT 722 on tow force at speeds from 0.19 m/s to 0.78 m/s. Baseline case is even ballast distribution, floor inflated, and drogue deployed.
6.2 Tow in Regular Waves
IOT 721 and IOT 722 were towed in unidirectional regular waves with
frequencies ranging from 0.581Hz to 1.245Hz, with slopes of 1:10, 1:15, and 1:20. The one exception to this was IOT 722 at the frequency of 0.581Hz with a wave slope of 1:10. For this particular frequency and wave slope, wave heights were so large that they were impacting the wind machine fans mounted underneath the carriage. For safety reasons, the research team decide to cancel testing in this wave condition.
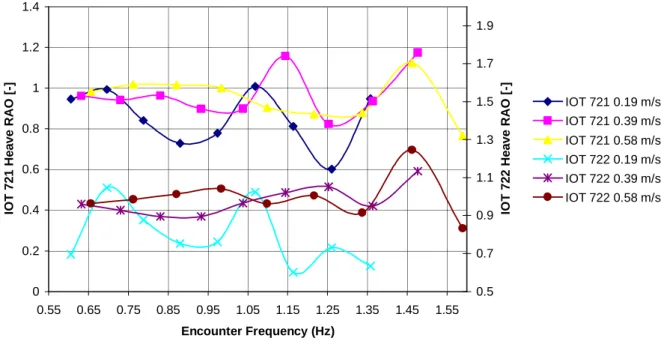
6.2.1 Heave RAO’s
The heave response amplitude operator (RAO) is a non-dimensionalised value obtained by dividing the amplitude of the model by the amplitude of the encounter wave plotted as a function of encounter frequency. Heave RAO’s were calculated using the following formula:
Heave RAO = Heave/ζ0
Where:
Heave= Linear motion amplitude of the raft (m)
0.00 2.00 4.00 6.00 8.00 10.00 12.00 IOT 721 -0.19 IOT 721 -0.39 IOT 721 -0.58 IOT 721 -0.78 IOT 722 -0.19 IOT 722 -0.39 IOT 722 -0.58 IOT 722 -0.78
Model and Speed (m/s)
T o w F o rc e ( N ) Baseline Case Uninflated Uneven Ballast Without Drogue
20 ζ0 = Wave amplitude (m)
The encounter frequency is defined as the frequency at which the model encounters the waves. Since the model is travelling in head seas (relative to the waves), the encounter frequency will be higher than the wave frequency generated by the wave makers. Therefore:
ωe = ω – ((ω2·U)/g)·cos µ
fe = 1/(2π/ωe)
Where: ωe = Encounter Frequency (rad/sec)
ω = Wave Frequency (rad/sec)
U = Model speed (m·s-1)
µ = Heading angle (180° for head seas)
g = Acceleration due to gravity (9.81 m·s-2) fe = Encounter Frequency (Hz)
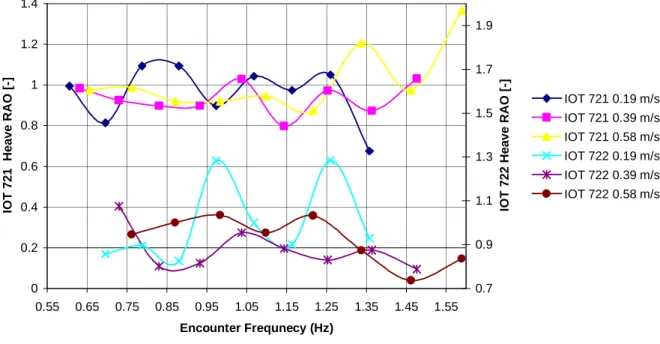
For IOT 721, the results were fairly consistent across all wave frequencies and slopes with the values ranging from 0.8 to 1.2. The notable exception to this was the 1:15 slope condition with Beaufort 6 equivalent winds. Once the encounter frequency
increased past 1.0, the heave RAO values increase to 1.4 for 0.19 m/s and 0.39 m/s speeds, and then drop back down to 0.8 (Figure 6.10).
For IOT 722 in the 1:10 slope conditions, the heave RAO values are fairly consistent around 1.0, for both Beaufort 5 and 6 equivalent conditions. In the 1:15 slope, Beaufort 6 equivalent condition, we begin to see a downward trend in the values as the wave frequencies increase. This trend continues for both Beaufort equivalent conditions in the 1:20 slope waves.
Figure 6.7: IOT 721 and IOT 722 heave RAO in 1:10 slope waves in Beaufort 5 equivalent winds.
Figure 6.8 IOT 721 and IOT 722 heave RAO in 1:10 slope waves in Beaufort 6 equivalent winds 0 0.2 0.4 0.6 0.8 1 1.2 0.55 0.65 0.75 0.85 0.95 1.05 1.15 1.25 1.35 1.45 1.55 Encounter Frequency (Hz) IO T 7 2 1 H e a v e R A O [ -] 0.6 0.8 1 1.2 1.4 1.6 1.8 2 IO T 7 2 2 H e a v e R A O [ -] IOT 721 0.19 m/s IOT 721 0.39 m/s IOT 721 0.58 m/s IOT 722 0.19 m/s IOT 722 0.39 m/s IOT 722 0.58 m/s 0 0.2 0.4 0.6 0.8 1 1.2 1.4 0.55 0.65 0.75 0.85 0.95 1.05 1.15 1.25 1.35 1.45 1.55 Encounter Frequnecy (Hz) IO T 7 2 1 H e a v e R A O [ -] 0.7 0.9 1.1 1.3 1.5 1.7 1.9 IO T 7 2 2 H e a v e R A O [ -] IOT 721 0.19 m/s IOT 721 0.39 m/s IOT 721 0.58 m/s IOT 722 0.19 m/s IOT 722 0.39 m/s IOT 722 0.58 m/s
22
Figure 6.9: IOT 721 and IOT 722 heave RAO in 1:15 slope waves in Beaufort 5 equivalent winds.
Figure 6.10: IOT 721 and IOT 722 heave RAO in 1:15 slope waves in Beaufort 6 equivalent winds. 0 0.2 0.4 0.6 0.8 1 1.2 1.4 0.55 0.65 0.75 0.85 0.95 1.05 1.15 1.25 1.35 1.45 1.55 Encounter Frequency (Hz) IO T 7 2 1 H e a v e R A O [ -] 0.5 0.7 0.9 1.1 1.3 1.5 1.7 1.9 IO T 7 2 2 H e a v e R A O [ -] IOT 721 0.19 m/s IOT 721 0.39 m/s IOT 721 0.58 m/s IOT 722 0.19 m/s IOT 722 0.39 m/s IOT 722 0.58 m/s 0 0.2 0.4 0.6 0.8 1 1.2 1.4 1.6 0.55 0.65 0.75 0.85 0.95 1.05 1.15 1.25 1.35 1.45 1.55 Encounter Frequnecy (Hz) IO T 7 2 1 H e a v e R A O [ -] 0.4 0.6 0.8 1 1.2 1.4 1.6 1.8 2 IO T 7 2 2 H e a v e R A O [ -] IOT 721 0.19 m/s IOT 721 0.39 m/s IOT 721 0.58 m/s IOT 722 0.19 m/s IOT 722 0.39 m/s IOT 722 0.58 m/s
Figure 6.11: IOT 721 and IOT 722 heave RAO in 1:20 slope waves in Beaufort 5 equivalent winds.
Figure 6.12: IOT 721 and IOT 722 heave RAO in 1:20 slope waves in Beaufort 6 equivalent winds. 0 0.2 0.4 0.6 0.8 1 1.2 1.4 0.55 0.65 0.75 0.85 0.95 1.05 1.15 1.25 1.35 1.45 1.55 Encounter Frequnecy (Hz) IO T 7 2 1 H e a v e R A O [ -] 0.4 0.6 0.8 1 1.2 1.4 1.6 1.8 2 IO T 7 2 2 H e a v e R A O [ -] IOT 721 0.19 m/s IOT 721 0.39 m/s IOT 721 0.58 m/s IOT 722 0.19 m/s IOT 722 0.39 m/s IOT 722 0.58 m/s 0 0.2 0.4 0.6 0.8 1 1.2 1.4 1.6 0.55 0.65 0.75 0.85 0.95 1.05 1.15 1.25 1.35 1.45 1.55 Encounter Frequnecy (Hz) IO T 7 2 1 H e a v e R A O [ -] 0.3 0.5 0.7 0.9 1.1 1.3 1.5 1.7 1.9 IO T 7 2 2 H e a v e R A O [ -] IOT 721 0.19 m/s IOT 721 0.39 m/s IOT 721 0.58 m/s IOT 722 0.19 m/s IOT 722 0.39 m/s IOT 722 0.58 m/s
24 Table 6.1: IOT 721 heave RAO at 0.19 m/s speed.
Table 6.2 IOT 721 heave RAO at 0.39 m/s speed.
Table 6.3: IOT 721 heave RAO at 0.58 m/s speed.
Frequency Encounter Frequency
1:10 Slope 1:15 Slope 1:20 Slope Hz Hz Beaufort Equivalent Beaufort Equivalent Beaufort Equivalent 5 6 5 6 5 6 0.581 0.606 0.875 0.994 0.946 0.932 0.773 0.988 0.664 0.696 0.841 0.813 0.993 0.945 0.880 0.923 0.747 0.788 0.930 1.093 0.841 0.905 0.909 0.875 0.830 0.880 1.010 1.093 0.729 0.931 0.898 0.916 0.913 0.974 0.694 0.897 0.779 0.794 0.738 0.791 0.996 1.068 0.811 1.042 1.008 1.442 0.706 0.762 1.079 1.164 0.650 0.974 0.812 0.753 0.805 0.851 1.162 1.260 1.018 1.049 0.602 0.871 1.157 0.837 1.245 1.358 0.840 0.674 0.948 0.667 1.075 0.902 Frequency Encounter Frequency
1:10 Slope 1:15 Slope 1:20 Slope Hz Hz Beaufort Equivalent Beaufort Equivalent Beaufort Equivalent 5 6 5 6 5 6 0.581 0.631 0.966 0.983 0.962 0.941 0.932 0.946 0.664 0.730 0.978 0.925 0.941 0.887 0.982 0.957 0.747 0.830 0.856 0.897 0.964 0.938 0.944 0.910 0.830 0.933 0.893 0.897 0.898 0.950 1.036 0.951 0.913 1.038 0.924 1.029 0.899 0.903 0.970 0.935 0.996 1.144 0.946 0.798 1.157 1.301 1.221 1.146 1.079 1.253 0.837 0.972 0.823 1.279 0.843 0.790 1.162 1.364 1.043 0.873 0.936 0.818 0.713 1.058 1.245 1.477 1.034 1.032 1.175 1.225 0.767 1.479 Frequency Encounter Frequency
1:10 Slope 1:15 Slope 1:20 Slope Hz Hz Beaufort Equivalent Beaufort Equivalent Beaufort Equivalent 5 6 5 6 5 6 0.581 0.656 0.974 0.976 0.982 0.966 1.005 0.974 0.664 0.762 0.986 0.989 1.018 0.964 1.019 1.036 0.747 0.871 0.929 0.920 1.016 0.989 1.061 1.034 0.830 0.983 0.963 0.920 1.000 1.001 1.049 1.032 0.913 1.098 0.919 0.945 0.905 0.982 1.073 1.025 0.996 1.216 0.987 0.874 0.872 0.862 1.022 0.971 1.079 1.338 0.738 1.207 0.879 0.682 0.987 0.901 1.162 1.462 1.090 0.974 1.125 1.033 0.975 0.891 1.245 1.589 1.096 1.368 0.766 1.209 0.879 1.517
Table 6.4: IOT 722 heave RAO at 0.19 m/s speed.
Table 6.5: IOT 722 heave RAO at 0.39 m/s speed.
Table 6.6: IOT 722 heave RAO at 0.58 m/s speed.
Frequency Encounter Frequency
1:10 Slope 1:15 Slope 1:20 Slope Hz Hz Beaufort Equivalent Beaufort Equivalent Beaufort Equivalent 5 6 5 6 5 6 0.581 0.606 N/A N/A 0.696 0.958 0.993 1.005 0.664 0.696 0.962 0.857 1.047 1.024 0.952 0.967 0.747 0.788 0.877 0.895 0.877 0.878 0.936 0.938 0.830 0.880 0.927 0.825 0.754 0.950 0.890 0.860 0.913 0.974 0.865 1.282 0.762 0.913 0.937 0.915 0.996 1.068 0.730 0.999 1.024 0.931 0.524 1.002 1.079 1.164 1.021 0.901 0.601 0.627 0.896 0.714 1.162 1.260 0.868 1.285 0.731 0.718 0.701 0.826 1.245 1.358 0.725 0.929 0.635 0.791 0.596 0.360 Frequency Encounter Frequency
1:10 Slope 1:15 Slope 1:20 Slope Hz Hz Beaufort Equivalent Beaufort Equivalent Beaufort Equivalent 5 6 5 6 5 6 0.581 0.631 N/A N/A 0.960 0.974 0.977 0.975 0.664 0.730 1.044 1.075 0.928 0.993 0.948 0.947 0.747 0.830 0.980 0.802 0.895 0.975 0.926 0.905 0.830 0.933 0.896 0.816 0.895 0.837 0.905 0.914 0.913 1.038 0.870 0.954 0.966 0.620 0.868 0.875 0.996 1.144 0.861 0.882 1.021 0.808 0.821 1.045 1.079 1.253 0.815 0.830 1.051 0.752 0.968 1.052 1.162 1.364 1.265 0.875 0.950 0.778 0.707 0.886 1.245 1.477 0.906 0.788 1.134 0.809 0.662 0.612 Frequency Encounter Frequency
1:10 Slope 1:15 Slope 1:20 Slope Hz Hz Beaufort Equivalent Beaufort Equivalent Beaufort Equivalent 5 6 5 6 5 6 0.581 0.656 N/A N/A 0.963 0.983 1.018 1.030 0.664 0.762 0.864 0.946 0.985 1.010 0.968 0.968 0.747 0.871 0.987 1.000 1.013 0.893 0.998 0.986 0.830 0.983 1.109 1.035 1.041 0.894 0.968 0.963 0.913 1.098 1.309 0.954 0.962 0.719 0.953 0.952 0.996 1.216 1.014 1.032 1.005 0.924 0.907 0.873 1.079 1.338 0.971 0.874 0.915 1.030 0.796 0.790 1.162 1.462 1.029 0.737 1.245 0.635 0.676 0.633 1.245 1.589 1.026 0.835 0.833 0.677 0.647 0.531
26
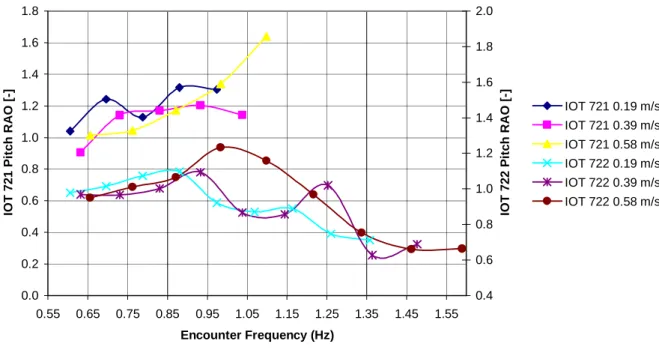
6.2.2 Pitch RAO’s
Pitch RAO’s are defined as the angular amplitudes of the model
non-dimensionalised by the wave slope amplitude. For IOT 721, pitch values were obtained by integrating the pitch acceleration values from the MotionPak then de-trending the obtained values. The optical tracking system for IOT 721 experiments was setup to only measure linear motions (X,Y, and Z). For IOT 722, the optical system was setup to measure pitch, roll and yaw motion. Pitch RAO’s were calculated by dividing pitch by the wave slope amplitude. They were calculated using the following equation:
Pitch RAO = pitch/ ((2π/λ)·ζ0)
Where:
pitch = Pitch angular motion (in radians) π = Pi
λ = Wavelength for given wave frequency (m) ζ0 = Wave amplitude (m)
For IOT 721, at the 1:10 slope, the RAO values ranged from about 0.6 to 1; while at the 1:15 slope the values ranged from 1 to 1.4; and at 1:20, the value ranged from 0.8 to 1.2. Some wave frequencies for IOT 721 were dropped (from the 0.996 Hz frequency onward) from the 1:15 slope condition due to time constraints. For IOT 722 raft the pitch RAO values ranged from 0.6 to 1.2 across all slope and wind conditions. A trend
observed was that the RAO values would decrease as the encounter wave frequency increased.
Figure 6.13: IOT 721 and IOT 722 pitch RAO in 1:10 slope waves in Beaufort 5 equivalent winds
Figure 6.14: IOT 721 and IOT 722 pitch RAO in 1:10 slope waves in Beaufort 6 equivalent winds 0.0 0.2 0.4 0.6 0.8 1.0 1.2 0.55 0.65 0.75 0.85 0.95 1.05 1.15 1.25 1.35 1.45 1.55 Encounter Frequency (Hz) IO T 7 2 1 P it c h R A O [ -] 0.4 0.6 0.8 1.0 1.2 1.4 1.6 1.8 2.0 IO T 7 2 2 P it c h R A O [ -] IOT 721 0.19 m/s IOT 721 0.39 m/s IOT 721 0.58 m/s IOT 722 0.19 m/s IOT 722 0.39 m/s IOT 722 0.58 m/s 0.0 0.2 0.4 0.6 0.8 1.0 1.2 0.55 0.65 0.75 0.85 0.95 1.05 1.15 1.25 1.35 1.45 1.55 Encounter Frequency (Hz) IO T 7 2 1 P it c h R A O [ -] 0.5 0.7 0.9 1.1 1.3 1.5 1.7 1.9 IO T 7 2 2 P it c h R A O [ -] IOT 721 0.19 m/s IOT 721 0.39 m/s IOT 721 0.58 m/s IOT 722 0.19 m/s IOT 722 0.39 m/s IOT 722 0.58 m/s
28
Figure 6.15: IOT 721 and IOT 722 pitch RAO in 1:15 slope waves in Beaufort 5 equivalent winds.
Figure 6.16: IOT 721 and IOT 722 pitch RAO in 1:15 slope waves in Beaufort 6 equivalent winds. 0.0 0.2 0.4 0.6 0.8 1.0 1.2 1.4 1.6 1.8 0.55 0.65 0.75 0.85 0.95 1.05 1.15 1.25 1.35 1.45 1.55 Encounter Frequency (Hz) IO T 7 2 1 P it c h R A O [ -] 0.4 0.6 0.8 1.0 1.2 1.4 1.6 1.8 2.0 IO T 7 2 2 P it c h R A O [ -] IOT 721 0.19 m/s IOT 721 0.39 m/s IOT 721 0.58 m/s IOT 722 0.19 m/s IOT 722 0.39 m/s IOT 722 0.58 m/s 0.0 0.2 0.4 0.6 0.8 1.0 1.2 1.4 1.6 0.55 0.65 0.75 0.85 0.95 1.05 1.15 1.25 1.35 1.45 1.55 Encounter Frequency (Hz) IO T 7 2 1 P it c h R A O [ -] 0.4 0.6 0.8 1.0 1.2 1.4 1.6 1.8 2.0 IO T 7 2 2 P it c h R A O [ -] IOT 721 0.19 m/s IOT 721 0.39 m/s IOT 721 0.58 m/s IOT 722 0.19 m/s IOT 722 0.39 m/s IOT 722 0.58 m/s
Figure 6.17: IOT 721 and IOT 722 pitch RAO in 1:20 slope waves in Beaufort 5 equivalent winds.
Figure 6.18: Model 16 and 42 person rafts pitch RAO in 1:20 slope waves in Beaufort 6 equivalent winds. 0.0 0.2 0.4 0.6 0.8 1.0 1.2 0.55 0.65 0.75 0.85 0.95 1.05 1.15 1.25 1.35 1.45 1.55 Encounter Frequency (Hz) IO T 7 2 1 P it c h R A O [ -] 0.4 0.6 0.8 1.0 1.2 1.4 1.6 1.8 2.0 IO T 7 2 2 P it c h R A O [ -] IOT 721 0.19 m/s IOT 721 0.39 m/s IOT 721 0.58 m/s IOT 722 0.19 m/s IOT 722 0.39 m/s IOT 722 0.58 m/s 0.0 0.2 0.4 0.6 0.8 1.0 1.2 1.4 1.6 0.55 0.65 0.75 0.85 0.95 1.05 1.15 1.25 1.35 1.45 1.55 Encounter Frequency (Hz) IO T 7 2 1 P it c h R A O [ -] 0.4 0.6 0.8 1.0 1.2 1.4 1.6 1.8 2.0 IO T 7 2 2 P it c h R A O [ -] IOT 721 0.19 m/s IOT 721 0.39 m/s IOT 721 0.58 m/s IOT 722 0.19 m/s IOT 722 0.39 m/s IOT 722 0.58 m/s
30 Table 6.7: IOT 721 pitch RAO at 0.19 m/s.
Table 6.8: IOT 721 pitch RAO at 0.39 m/s.
Table 6.9: IOT 721 pitch RAO at 0.58 m/s.
Frequency Encounter Frequency
1:10 Slope 1:15 Slope 1:20 Slope Hz Hz Beaufort Equivalent Beaufort Equivalent Beaufort Equivalent 5 6 5 6 5 6 0.581 0.606 0.896 0.772 1.041 1.008 0.896 0.819 0.664 0.696 0.714 0.881 1.243 1.437 0.891 0.863 0.747 0.788 0.831 0.909 1.128 1.217 0.924 0.832 0.830 0.880 1.040 0.870 1.316 1.136 0.873 0.856 0.913 0.974 0.629 0.691 1.303 1.368 0.778 0.796 0.996 1.068 0.767 0.681 N/A N/A 0.798 0.834 1.079 1.164 0.591 0.640 N/A N/A 0.922 0.948 1.162 1.260 0.695 0.700 N/A N/A 0.938 0.880 1.245 1.358 0.550 0.623 N/A N/A 0.949 1.152 Frequency Encounter Frequency
1:10 Slope 1:15 Slope 1:20 Slope Hz Hz Beaufort Equivalent Beaufort Equivalent Beaufort Equivalent 5 6 5 6 5 6 0.581 0.631 0.937 0.975 0.906 0.956 0.842 0.829 0.664 0.730 0.795 0.838 1.142 0.973 0.883 0.831 0.747 0.830 0.891 0.775 1.169 0.975 0.810 0.785 0.830 0.933 0.868 0.990 1.204 1.119 0.950 0.827 0.913 1.038 0.934 0.757 1.143 1.134 0.962 0.923 0.996 1.144 0.835 0.875 N/A N/A 0.966 1.247 1.079 1.253 0.666 0.693 N/A N/A 0.911 0.820 1.162 1.364 0.655 0.684 N/A N/A 0.895 1.167 1.245 1.477 0.790 0.693 N/A N/A 0.901 1.467 Frequency Encounter Frequency
1:10 Slope 1:15 Slope 1:20 Slope Hz Hz Beaufort Equivalent Beaufort Equivalent Beaufort Equivalent 5 6 5 6 5 6 0.581 0.656 0.967 1.013 1.015 1.022 0.764 0.725 0.664 0.762 1.045 0.968 1.044 0.995 0.897 0.898 0.747 0.871 0.927 0.919 1.173 1.376 0.889 0.884 0.830 0.983 0.958 1.020 1.338 1.386 0.976 0.975 0.913 1.098 0.956 0.842 1.640 1.346 1.122 1.055 0.996 1.216 0.942 0.886 N/A N/A 1.118 1.073 1.079 1.338 0.660 0.887 N/A N/A 1.114 0.916 1.162 1.462 0.919 0.845 N/A N/A 1.010 0.891 1.245 1.589 0.837 0.823 N/A N/A 0.878 1.338
Table 6.10: IOT 722 pitch RAO at 0.19 m/s.
Table 6.11: IOT 722 pitch RAO at 0.39 m/s
Table 6.12: IOT 722 pitch RAO at 0.58 m/s.
Frequency Encounter Frequency
1:10 Slope 1:15 Slope 1:20 Slope Hz Hz Beaufort Equivalent Beaufort Equivalent Beaufort Equivalent 5 6 5 6 5 6 0.581 0.606 N/A N/A 0.979 0.885 1.037 1.033 0.664 0.696 0.791 0.810 1.015 0.983 0.973 0.999 0.747 0.788 0.703 0.677 1.073 1.223 0.978 0.969 0.830 0.880 0.683 0.647 1.097 0.937 0.993 0.970 0.913 0.974 0.663 0.976 0.923 1.103 1.157 1.073 0.996 1.068 0.659 0.824 0.870 0.892 0.855 1.248 1.079 1.164 0.682 0.650 0.889 0.776 1.115 0.857 1.162 1.260 0.660 0.964 0.747 0.725 0.853 1.010 1.245 1.358 0.570 0.757 0.712 1.001 0.629 0.521 Frequency Encounter Frequency
1:10 Slope 1:15 Slope 1:20 Slope Hz Hz Beaufort Equivalent Beaufort Equivalent Beaufort Equivalent 5 6 5 6 5 6 0.581 0.631 N/A N/A 0.969 0.939 0.980 0.938 0.664 0.730 0.813 0.902 0.965 0.905 0.912 0.899 0.747 0.830 0.821 0.718 1.002 0.985 0.961 1.052 0.830 0.933 0.800 0.733 1.093 0.994 1.049 1.101 0.913 1.038 0.775 0.790 0.867 0.925 1.059 1.111 0.996 1.144 0.604 0.726 0.857 0.942 1.007 1.021 1.079 1.253 0.640 0.652 1.020 0.801 1.171 0.916 1.162 1.364 0.881 0.675 0.628 0.802 0.779 0.716 1.245 1.477 0.664 0.572 0.688 0.603 0.692 0.630 Frequency Encounter Frequency
1:10 Slope 1:15 Slope 1:20 Slope Hz Hz Beaufort Equivalent Beaufort Equivalent Beaufort Equivalent 5 6 5 6 5 6 0.581 0.656 N/A N/A 0.950 0.912 0.944 0.938 0.664 0.762 0.879 0.854 1.011 1.014 0.892 0.899 0.747 0.871 0.963 1.030 1.065 1.040 1.058 1.052 0.830 0.983 1.048 1.133 1.232 1.156 1.105 1.101 0.913 1.098 1.109 0.948 1.158 1.074 1.100 1.111 0.996 1.216 1.032 0.904 0.968 0.904 1.021 1.021 1.079 1.338 0.869 0.799 0.753 1.095 0.938 0.916 1.162 1.462 0.742 0.671 0.660 0.750 0.761 0.716 1.245 1.589 0.744 0.661 0.663 0.645 0.750 0.630
32
6.2.3 Effects of wave slope, frequency and towing speed on mean tow force
The following graphs depict the effect of varying wave slope, frequency and tow speed on the tow force (mean + 2 standard deviation) for both models IOT 721 and IOT 722.
The mean combined with two times the standard deviation was used to report the tow force in order to give an accurate representation of the maximum loads experienced by the load cell. Since the load cell experienced both periods of loading and unloading as the rafts traveled up and down the waves, reporting only the mean would not have been an accurate representation of the maximum forces experienced on the tow point. By adding two times the standard deviation to the mean value observed for the tow force, we are able to report mean maximal tow loads experienced by the load cell while also
omitting noise from the load cell which may produce un-realistically high tow loads that could be interpreted by statistical analysis software as the actual maximum tow load. See figure 6.19 for an example.
For IOT 721, larger tow loads were observed at the wave slope 1:10 and at lower encounter frequencies compared to greater wave slopes and frequencies. Within wave frequencies, regardless of wave slope, the tow force decreased as the wave frequency increased, resulting in an inverse correlation between the two. Speed also influenced the tow loads observed. Irrespective of wave frequency or slope, higher tow speeds would always generate larger tow loads, with 0.58 m/s generating the largest tow forces out of all the speeds.
Similar results were observed during IOT 722. Lower wave slopes and frequencies would generate larger tow loads when compared to higher slopes and frequencies. The same relationship observed between speed and tow force with the IOT 721 was also observed with IOT 722. As the towing speed increased, the tow loads increased as well.
When comparing the tow loads observed of IOT 721 against IOT 722, the results are fairly consistent. It can be observed in the graphs that as the wave frequency increase; the tow force decreases for both rafts in both Beaufort equivalent conditions. In the 1:10 slope waves at 0.58 m/s towing speed, IOT 722 has greater tow loads at the 0.69 Hz wave frequency than IOT 721. At the 1:15 wave slope condition, in Beaufort 6 equivalent winds towing at 0.19 m/s, IOT 721 has greater tow loads for the wave frequencies of 0.59 Hz, 0.67 Hz, and 0.76 Hz. For the remaining wave slopes and speeds, the tow forces observed for both IOT 721 and IOT 722 are fairly similar. While it would be expected for the larger, model raft (IOT 722) to generate larger tow loads compared to the smaller raft (IOT 721), this is not always the case. IOT 722 would give a higher mean tow load than the IOT 721, but the maximal tow loads observed by the two are fairly similar.
Figure 6.19: Tow force times series for IOT 722 at 0.664 Hz wave frequency, 1:10 slope, in Beaufort 6 equivalent winds, being towed at 0.19 m/s.
Running Time (s) T o w F o rc e ( N )
34
Figure 6.20: Mean tow force plus 2 standard deviation for IOT 721 across slope at varying tow speeds in Beaufort 5 equivalent winds.
T o w F o rc e ( M e a n + 2 S T D ) (N ) 0 5 10 15 20 25 30 0.61 0.70 0.79 0.88 0.97 1.07 1.16 1.26 1.36 10 Slope 15 Slope 20 Slope 0.19 m/s 0 5 10 15 20 25 30 0.63 0.73 0.83 0.93 1.04 1.14 1.25 1.36 1.48 10 Slope 15 Slope 20 Slope 0.39 m/s 0 5 10 15 20 25 30 0.66 0.76 0.87 0.98 1.10 1.22 1.34 1.46 1.59 10 Slope 15 Slope 20 Slope 0.58 m/s Encounter Frequency (Hz)
Figure 6.21: Mean tow force plus 2 standard deviation IOT 721 across slope at varying tow speeds in Beaufort 6 equivalent winds.
0 5 10 15 20 25 30 35 40 0.61 0.70 0.79 0.88 0.97 1.07 1.16 1.26 1.36 10 Slope 15 Slope 20 Slope 0.19 m/s 0 5 10 15 20 25 30 35 40 0.63 0.73 0.83 0.93 1.04 1.14 1.25 1.36 1.48 10 Slope 15 Slope 20 Slope 0.39 m/s 0 5 10 15 20 25 30 35 40 0.66 0.76 0.87 0.98 1.10 1.22 1.34 1.46 1.59 10 Slope 15 Slope 20 Slope 0.58 m/s Encounter Frequency (Hz) T o w F o rc e ( M e a n + 2 S T D ) (N )
36
Figure 6.22: Mean tow force plus 2 standard deviation IOT 722 across slope at varying tow speeds in Beaufort 5 equivalent winds.
Encounter Frequency (Hz) T o w F o rc e ( M e a n + 2 S T D ) (N ) 0 5 1 0 1 5 2 0 2 5 3 0 3 5 4 0 0 .6 1 0 .7 0 0 .7 9 0 .8 8 0 .9 7 1 .0 7 1 .1 6 1 .2 6 1 .3 6 1 0 S lo p e 1 5 S lo p e 2 0 S lo p e 0 . 1 9 m / s 0 5 1 0 1 5 2 0 2 5 3 0 3 5 4 0 0 .6 3 0 .7 3 0 .8 3 0 .9 3 1 .0 4 1 .1 4 1 .2 5 1 .3 6 1 .4 8 1 0 S lo p e 1 5 S lo p e 2 0 S lo p e 0 .3 9 m / s 0 5 1 0 1 5 2 0 2 5 3 0 3 5 4 0 0 .6 6 0 .7 6 0 .8 7 0 .9 8 1 .1 0 1 .2 2 1 .3 4 1 .4 6 1 .5 9 1 0 S lo p e 1 5 S lo p e 2 0 S lo p e 0 . 5 8
Figure 6.23: Mean tow force plus 2 standard deviation for IOT 722 across slope at varying tow speeds in Beaufort 6 equivalent winds.
T o w F o rc e ( M e a n + 2 S T D ) (N ) 0 5 1 0 1 5 2 0 2 5 3 0 3 5 4 0 0.61 0 .7 0 0 .7 9 0 .8 8 0 .9 7 1 .0 7 1 .1 6 1 .2 6 1.36 1 0 Slop e 1 5 Slop e 2 0 Slop e 0.19 0 5 1 0 1 5 2 0 2 5 3 0 3 5 4 0 0 .6 3 0 .7 3 0.83 0 .9 3 1.04 1 .14 1 .2 5 1 .3 6 1.48 1 0 Slo pe 1 5 Slo pe 2 0 Slo pe 0.39 m /s 0 5 1 0 1 5 2 0 2 5 3 0 3 5 4 0 0.66 0 .7 6 0 .8 7 0 .9 8 1 .1 0 1 .2 2 1 .3 4 1 .4 6 1.59 1 0 Slop e 1 5 Slop e 2 0 Slop e 0.58 Encounter Frequency (Hz)
38
Figure 6.24: Mean tow force plus two standard deviation for IOT 721 across speed at varying slopes in Beaufort 5 equivalent winds.
0 5 10 15 20 25 30 0.581 0.664 0.747 0.83 0.913 0.996 1.079 1.162 1.245 0.58 m/s 0.39 m/s 0.19 m/s 1:10 Slope 0 5 10 15 20 25 30 0.581 0.664 0.747 0.83 0.913 0.996 1.079 1.162 1.245 0.58 m/s 0.39 m/s 0.19 m/s 1:15 Slope 0 5 10 15 20 25 30 0.581 0.664 0.747 0.83 0.913 0.996 1.079 1.162 1.245 0.58 m/s 0.39 m/s 0.19 m/s 1:20 Slope Encounter Frequency (Hz) T o w F o rc e ( M e a n + 2 S T D ) (N )
Figure 6.25: Mean tow force plus two standard deviation for IOT 721 across speed at varying slopes in Beaufort 6 equivalent winds.
0 5 1 0 1 5 2 0 2 5 3 0 0 .5 8 1 0 .6 6 4 0 .7 4 7 0 .8 3 0 .9 1 3 0 .9 9 6 1 .0 7 9 1 .1 6 2 1 .2 4 5 0 .5 8 m/s 0 .3 9 m/s 0 .1 9 m/s 1 :1 0 S lo p e 0 5 1 0 1 5 2 0 2 5 3 0 0 .5 8 1 0 .6 6 4 0 .7 4 7 0 .8 3 0 .9 1 3 0 .9 9 6 1 .0 7 9 1 .1 6 2 1 .2 4 5 0 .5 8 m/s 0 .3 9 m/s 0 .1 9 m/s 1 :1 5 S lo p e 0 5 1 0 1 5 2 0 2 5 3 0 0 .5 8 1 0 .6 6 4 0 .7 4 7 0 .8 3 0 .9 1 3 0 .9 9 6 1 .0 7 9 1 .1 6 2 1 .2 4 5 0 .5 8 m/s 0 .3 9 m/s 0 .1 9 m/s 1 :2 0 S lo p e Encounter Frequency (Hz) T o w F o rc e ( M e a n + 2 S T D ) (N )
40
Figure 6.26: Mean tow force plus two standard deviation for IOT 722 across speed at varying slopes in Beaufort 5 equivalent winds.
0 5 10 15 20 25 30 35 40 0.664 0.747 0.83 0.913 0.996 1.079 1.162 1.245 0.58 m/s 0.39 m/s 0.19 m/s 1:10 Slope 0 5 10 15 20 25 30 35 40 0.581 0.664 0.747 0.83 0.913 0.996 1.079 1.162 1.245 0.58 m/s 0.39 m/s 0.19 m/s 1:20 Slope Encounter Frequency (Hz) T o w F o rc e ( M e a n + 2 S T D ) (N ) 0 5 10 15 20 25 30 35 40 0.581 0.664 0.747 0.83 0.913 0.996 1.079 1.162 1.245 0.58 m/s 0.39 m/s 0.19 m/s 1:15 Slope
Figure 6.27: Mean tow force plus two standard deviation for IOT 722 across speed at varying slopes in Beaufort 6 equivalent winds.
0 5 1 0 1 5 2 0 2 5 3 0 3 5 4 0 0 .6 64 0 .74 7 0.8 3 0 .9 13 0 .99 6 1 .0 7 9 1 .1 6 2 1 .24 5 0 .5 8 m/s 0 .3 9 m/s 0 .1 9 m/s 1 :1 0 S lo pe 0 5 1 0 1 5 2 0 2 5 3 0 3 5 4 0 0 .58 1 0.6 6 4 0 .7 47 0.8 3 0 .91 3 0.9 9 6 1 .0 79 1 .1 6 2 1 .2 45 0 .5 8 m/s 0 .3 9 m/s 0 .1 9 m/s 1 :1 5 S lo pe 0 5 1 0 1 5 2 0 2 5 3 0 3 5 4 0 0.5 8 1 0 .6 6 4 0.7 4 7 0.8 3 0.9 1 3 0.9 9 6 1 .0 7 9 1.1 6 2 1 .2 4 5 0.5 8 m/s 0.3 9 m/s 0.1 9 m/s 1 :2 0 Slop e T o w F o rc e ( M e a n + 2 S T D ) (N ) Encounter Frequency (Hz)
42
Figure 6.28: Tow force (mean + 2 standard deviation) for IOT 721 vs IOT 722 compared at 1:10 slope at 0.19, 0.39, and 0.58 m/s speeds.
0 5 1 0 1 5 2 0 2 5 3 0 3 5 4 0 0 . 6 1 0 . 7 0 0 .7 9 0 . 8 8 0 .9 7 1 . 0 7 1 .1 6 1 . 2 6 1 .3 6 IO T 7 2 1 B F 5 Eq u iv IO T 7 2 2 B F 5 Eq u iv IO T 7 2 1 B F 6 Eq u iv IO T 7 2 2 B F 6 Eq u iv 0 .1 9 m /s 0 5 1 0 1 5 2 0 2 5 3 0 3 5 4 0 0 . 6 3 0 .7 3 0 .8 3 0 . 9 3 1 .0 4 1 .1 4 1 . 2 5 1 .3 6 1 .4 8 IO T 7 2 1 B F 5 Eq u iv IO T 7 2 2 B F 5 Eq u iv IO T 7 2 1 B F 6 Eq u iv IO T 7 2 2 B F 6 Eq u iv 0 . 3 9 m /s 0 5 1 0 1 5 2 0 2 5 3 0 3 5 4 0 0 . 6 6 0 .7 6 0 .8 7 0 . 9 8 1 .1 0 1 .2 2 1 .3 4 1 . 4 6 1 .5 9 IO T 7 2 1 B F 5 Eq u iv IO T 7 2 2 B F 5 Eq u iv IO T 7 2 1 B F 6 Eq u iv IO T 7 2 2 B F 6 Eq u iv 0 . 5 8 m /s Encounter Frequency (Hz) T o w F o rc e ( M e a n + 2 S T D ) (N )
Figure 6.29: Tow force (mean + 2 standard deviation) for IOT 721 vs IOT 722 compared at 1:15 slope at 0.19, 0.39, and 0.58 m/s speeds.
0 5 1 0 1 5 2 0 2 5 3 0 3 5 4 0 0 . 6 1 0 . 7 0 0 . 7 9 0 .8 8 0 . 9 7 1 .0 7 1 . 1 6 1 . 2 6 1 . 3 6 IO T 7 2 1 B F 5 E q u iv IO T 7 2 2 B F 5 E q u iv IO T 7 2 1 B F 6 E q u iv IO T 7 2 2 B F 6 E q u iv 0 . 1 9 m / s 0 5 1 0 1 5 2 0 2 5 3 0 3 5 4 0 0 . 6 3 0 . 7 3 0 . 8 3 0 .9 3 1 . 0 4 1 .1 4 1 . 2 5 1 . 3 6 1 . 4 8 IO T 7 2 1 B F 5 E q u iv IO T 7 2 2 B F 5 E q u iv IO T 7 2 1 B F 6 E q u iv IO T 7 2 2 B F 6 E q u iv 0 . 3 9 m /s 0 5 10 15 20 25 30 35 40 0.66 0.76 0.87 0.98 1.10 1.22 1.34 1.46 1.59 IOT 721 BF 5 Equiv IOT 722 BF 5 Equiv IOT 721 BF 6 Equiv IOT 722 BF 6 Equiv 0.58 m /s T o w F o rc e ( M e a n + 2 S T D ) (N ) Encounter Frequency (Hz)
44
Figure 6.30: Tow force (mean + 2 standard deviation) for IOT 721 vs. IOT 722 compared at 1:20 slope at 0.19, 0.39, and 0.58 m/s speeds.
0 2 4 6 8 10 12 14 16 18 20 0.61 0.70 0.79 0.88 0.97 1.07 1.16 1.26 1.36 IOT 721 BF 5 Equiv IOT 722 BF 5 Equiv IOT 721 BF 6 Equiv IOT 722 BF 6 Equiv 0.19 m/s 0 2 4 6 8 10 12 14 16 18 20 0.63 0.73 0.83 0.93 1.04 1.14 1.25 1.36 1.48 IOT 721 BF 5 Equiv IOT 722 BF 5 Equiv IOT 721 BF 6 Equiv IOT 722 BF 6 Equiv 0.39 m/s 0 2 4 6 8 10 12 14 16 18 20 0.66 0.76 0.87 0.98 1.10 1.22 1.34 1.46 1.59 IOT 721 BF 5 Equiv IOT 722 BF 5 Equiv IOT 721 BF 6 Equiv IOT 722 BF 6 Equiv 0.58 m/s T o w F o rc e ( M e a n + 2 S T D ) (N ) Encounter Frequency (Hz)
Figure 6.31: Comparison of tow force mean values against tow force mean + 2 standard deviation values for IOT 721 and IOT 722 at 1:10 slope waves with a speed of 0.58 m/s in Beaufort 5 equivalent conditions.
0 5 10 15 20 25 30 35 40 0.66 0.76 0.87 0.98 1.10 1.22 1.34 1.46 1.59 IOT 721 Mean + 2 STD IOT 721 Raft Mean
0 5 10 15 20 25 30 35 40 0.76 0.87 0.98 1.10 1.22 1.34 1.46 1.59 IOT 722 Mean + 2 STD IOT 722 Mean Encounter Frequency (Hz) T o w F o rc e ( N )
46
6.3 Drift Tests
A series of un-tethered drift tests were performed on the model rafts. The tests were carried out on uni-directional waves with a slope of 1:15 over frequencies ranging from 0.581 to 1.245 Hz, in increments of 0.083 Hz. The wind conditions tested were: no wind, Beaufort 4, 5, 6, and 7 equivalent conditions. Drift heave and pitch RAO
calculations were performed the same way as in regular waves.
There was a difference seen between the heave RAO values for IOT 721 and IOT 722 during the drift tests. For all Beaufort equivalent conditions, the heave RAO for IOT 721 remains close to 1.0 The exception to this is the Beaufort 5 and 7 conditions at the frequencies of 1.079 and 1.245 Hz. At these conditions the RAO value increase to 1.68 and 2.08 for Beaufort 5 equivalent and, in Beaufort 7 equivalent the values to 1.6 and 1.63. For IOT 722, as the wave frequency increased, the heave RAO values decreased for all Beaufort equivalent conditions; except in Beaufort 7 equivalent where the RAO values still remain close to 1.0.
For the pitch RAO’s both rafts experienced similar trends. At the lower wave frequencies, the values for IOT 721 were about 0.9 for all Beaufort equivalent conditions; while the values for IOT 722 raft ranged from 0.5 to 0.9 at the lower frequencies. As the wave frequency increased, these values dropped down to a range of 0.6 to 0.3 across all Beaufort conditions. For IOT 721 pitch RAO’s at the wave frequency 1.162 the motion pak was not working correctly resulting in inaccurate data being reported. This resulted in the large pitch and heave RAO values seen at that frequency for IOT 721.
For IOT 721, some of the data obtained from the MotionPak was obviously incorrect for certain wave frequencies. This data was dropped from the RAO plots and appears as 0 on the graphs.
Figure 6.32: Heave RAO for IOT 721 and IOT 722 during drift tests from Beaufort 4-7 equivalent conditions. Wave Frequency (Hz) H ea v e R A O [ -] 0.00 0.50 1.00 1.50 2.00 2.50 0.4 0.6 0.8 1 1.2 1.4 Beaufort 4 Beaufort 5 Beauff ort 6 Beaufort 7 No Wind IOT 721 0.00 0.20 0.40 0.60 0.80 1.00 1.20 0.4 0.6 0.8 1 1.2 1.4 BF 4 Equiv BF 5 Equiv BF 6 Equiv BF 7 Equiv No Wind IOT 722
48
Figure 6.33: Pitch RAO for IOT 721 and IOT 722 during drift tests in Beaufort 4-7 equivalent conditions. Wave Frequency (Hz) P it c h R A O [ -] 0.00 0.20 0.40 0.60 0.80 1.00 1.20 1.40 0.5 0.7 0.9 1.1 1.3 BF 4 Equiv BF 5 Equiv BF 6 Equiv BF 7 Equiv No Wind IOT 722 0.00 0.20 0.40 0.60 0.80 1.00 1.20 1.40 0.5 0.7 0.9 1.1 1.3 Beauf ort 4 Beauf ort 5 Beauf ort 6 Beauf ort 7 No Wind IOT 721
7.0 Conclusions
1. In calm water tow experiments, the deployment of the sea anchor had the greatest effect on tow force loads for both IOT 721 and IOT 722 (model 16 and 42 person raft respectively), with a greater force observed when it was deployed. The effects of having the floor inflated and ballast distribution had a minimal difference on tow force loads. These small differences observed may be due to experimental error.
2. For the heave RAO’s in regular wave conditions, IOT 721 had values ranging from 0.8 to 1.2 across all wave slopes and wind conditions. For the wave
conditions of 1:10 slope, IOT 722 heave RAO values were similar to model IOT 721 in that they ranged from 0.8 to 1.2. IOT 722 was tested in the 1:15 and 1:20 wave slope conditions different RAO values were observed. The range of the RAO values changed to 0.6 to 1.0 across both slope and Beaufort equivalent conditions.
3. Pitch RAO’s remained fairly similar for both model rafts across the wave slopes and Beaufort equivalent levels in regular wave tows, with the values ranging from 0.6 to 1.2. The notable exception to this was for IOT 721 in the 1:15 slope
condition. At this wave slope, the RAO values ranged from 0.8 to 1.2 for both Beaufort equivalent levels.
4. A trend observed for both model rafts was as the encounter frequency increased, the tow load would decreased. This was seen across both speed and wave slope for both models. The 1:10 wave slope generated a higher tow load than the 1:15 and 1:20 slope for both rafts. Higher tow loads were observed with the 1:15 wave slope when compared to the 1:20 wave slope for both rafts. IOT 721 and IOT 722 both produced higher tow loads with higher tow speeds. When compared to one another, IOT 721 and IOT 722 generated similar tow loads on the towing point. While IOT 722 generates a higher mean tow load than IOT 721; they both produce similar maximal tow loads.
5. IOT 721 and IOT 722 behaved differently during the drift tests. As the wave frequency increased in the drift test, the model 16-person life raft experienced an increase in heave RAO, which was more pronounced in the Beaufort 5 equivalent wind condition as compared to the equivalent of Beaufort 6. IOT 722 had the opposite trend; it’s heave RAO decreased as the wave frequency increased for both Beaufort equivalent conditions.
6. Both model rafts had similar trends for pitch RAO values for the drift tests. As the wave frequency increased, there was a decrease in the pitch RAO for both rafts across both Beaufort equivalent conditions.