Bidder Response to Combinatorial Auctions in
Truckload Procurement
by
Clinton Lee Plummer
B.S. Business Administration Fisher College of Business The Ohio State University, 2002
Submitted to the Center for Transportation and Logistics in partial fulfillment of the requirements for the degree of
Master of Engineering in Logistics
at the
MASSACHUSETTS INSTITUTE OF TECHNOLOGY June 2003
@ Massachusetts Institute of Technology All rights reserved
Signature of Author... Center for Transportation and Logistics
,/ \, ay, 2003
C ertified by... ...
---..----sef Sheffi Professor, Department of Civil and Envir mental Engineering Professor, Engineering Syster$* Division
// ,Tes4 upervisor A ccepted by... MASSACHUSETTS INSTrTUTE OF TECHNOLOGY
JUL 2 7
2004
... -.-.-.- - - - --((Yosef Sheffi Co-Director, Center for Transportation and LogisticsBidder Response to Combinatorial Auctions in Truckload Procurement
by
Clinton L. Plummer
Submitted to the Center for Transportation and Logistics on May 9, 2003 in partial fulfillment of the requirements for the degree of
Master of Engineering in Logistics
Abstract
This thesis explores how truckload carriers use conditional bids within the framework of a combinatorial auction to win more business and balance their existing networks. Because a considerable portion of a truckload carrier's cost of serving a given lane is associated with the probability of finding a follow-on load (i.e. economies of scope), bidding on a lane-by-lane basis may not accurately reflect a carrier's true cost of serving that lane.
In a combinatorial auction, a truckload carrier can more accurately reflect its true cost of serving a given lane by offering package discounts, conditional on winning lanes that increase the probability of finding follow-on loads. Though a considerable amount has been written about the economics of truckload carrier's operations and the benefits of combinatorial auctions to shippers, few have studied conditional bidding from a bidder's (carrier's) perspective.
This thesis makes three contributions. First, an explanation of why bidders do and don't submit conditional bids in combinatorial auctions is provided. Second, a model of carrier costs functions, including package discounts (a measure of economies of scope) is developed. Finally, this thesis examines regional pricing differences, and quantifies the amount by which carriers will change their prices in different regions of the US.
Thesis Supervisor: Yosef Sheffi
Title: Professor, Department of Civil and Environmental Engineering Professor, Engineering Systems Division
Acknowledgements
I would like to thank the following people for their help leading up to and during my time at MIT:
My parents and family, for their continuing love, guidance and support. I especially want to thank my parents. The many beatings they gave me as a child proved to be the best preparation imaginable for a graduate degree at MIT.
My thesis advisor, Professor Yossi Sheffi, for his advice, encouragement and faith in me during throughout our research. Yossi's drive never ceases to amaze me.
Dr. Chris Caplice, the new Executive Director of the MLOG program, for his insight, contacts and superb data-entry skills.
Dr. Keely Croxton, faculty advisor of the Transportation and Logistics Association at Ohio State for her friendship, trust and support over the past four years. Without Keely's encouragement, I doubt I would have gotten where I am.
My classmates, especially Paul, Chris and Ankur, for helping me to understand when to say "I don't have time for that," and for introducing me to Montreal and Hong Kong.
Table of Contents
INTRO DU CTION...3
1. 1 KEY D EFINITIONS ... 4
1.2 RESEARCH OBJECTIVE ... 6
1.3 THESIS O UTLINE AND M ETHODOLOGY ... 6
CARRIER ECO NO M ICS...9
2.1 ECONOM IES OF SCALE...9
2.2 ECONOM IES OF D ENSITY... 10
2.3 ECONOMIES OF SCOPE... 11
2.4 D RIVING ECONOM ICS OF TRUCKLOAD TRANSPORTATION ... 13
2.5 OPERATIONAL COMPLEXITIES... 14
2.6 COMPETITION... 15
TRUCK LO AD TRAN SPO RTATIO N ... 16
3.1 TRUCKLOAD TRANSPORTATION PROCUREMENT ... 16
3.2 TRUCKLOAD CARRIER BIDDING ... 17
3.3 D ETAILED INFORMATION IS CRITICAL... 18
3.4 CARRIER PRICING CONSIDERATIONS... 19
3.5 N ETWORK BALANCE / LANE DENSITY ... 20
3.6 COMBINATORIAL A UCTIONS...21
Examples of Com binatorial Auctions ... 22
Carrier's Experience with Combinatorial Auctions... 24
CARRIER BID DIN G BEH A VIO R ... 26
4.1 M ETHODOLOGY ... 26
4.2 COMBINATORIAL AUCTION PROFILES...27
Number of Packages Submitted ... 29
Package Size... 30
Small Packages...31
Large Packages ... 32
4.3 PACKAGED LANES ... 32
4.4 CARRIER BIDDING STRATEGIES ... 35
Round Trip Packages ... 37
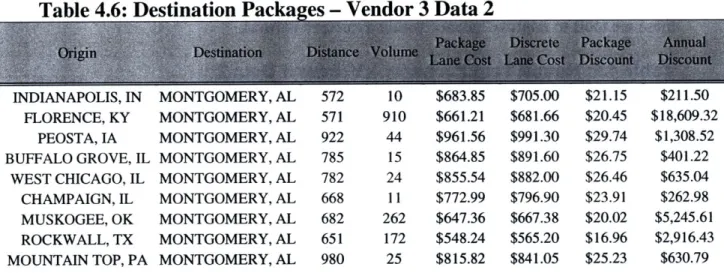
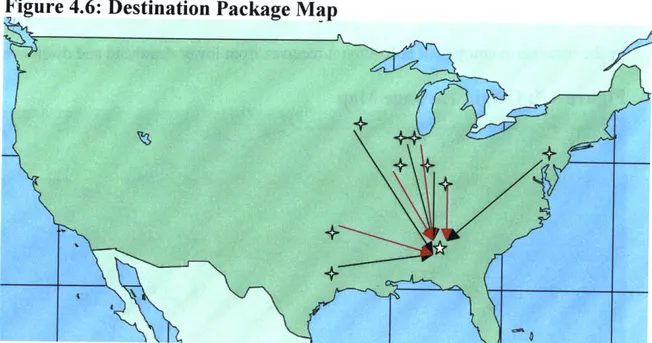
D estination Packages ... 38
O rig in Packages ... 39
D isparate Packages...40
4.5 PACKAGE DISCOUNTS...42
Impact of Shippers Networks ... 44
Impact of Software Vendors ... 44
Impact of the Num ber of Bidders... 44
Frequency of Package D iscounts: A Bidding Guide ... 45
Lowest Total Cost Package Bids ... 46
4.6 CARRIER COST FUNCTIONS ... 48
The Impact of Volume... 49
The Impact of D istance...50
Impact of Package Size... 51
M odel Robustness...52
Regiona l Factors ... 54
A Simple Example... 55
Carrier Cost Function Conclusions... 56
CON CLUSIO N S ... 57
-Appendices
REFERENCES...62
AUCTION LANE COST REGRESSIONS... 64
STATISTICAL ANALYSIS...72
Similarity of Distributions: The Impact of Shippers Networks... 73
The M ood M edian Test... 74
Interquartile Ranges (Q-Qj)-...-... 75
Confidence Intervals...75
Chi Square Test ... 76
The Kruskal-Wallis Test ... 77
Similarity of Distributions: The Impact of Software Vendors ... 78
C o n c lu sio n s ... 8 0
List of Tables
TABLE 4.1: CARRIERS SUBMITTING PACKAGE BIDS...27TABLE 4.2: DISTRIBUTION OF PACKAGES PER CARRIER ... 30
TABLE 4.3: LANES PER PACKAGE ... 31
TABLE 4.4: PACKAGES PER LANE ... 33
TABLE 4.5: ROUND TRIP PACKAGES - VENDOR 3 DATA 2 ... 37
TABLE 4.6: DESTINATION PACKAGES - VENDOR 3 DATA 2... 38
TABLE 4.7: ORIGIN PACKAGES - VENDOR 3 DATA 2... 39
TABLE 4.8: DISPARATE PACKAGES - VENDOR 3 DATA 2 ... 41
TABLE 4.9: PACKAGE DISCOUNTS ... 43
TABLE 4. 10: PACKAGE DISCOUNT FREQUENCY... 45
TABLE 4.11: LOWEST COST PACKAGE BIDS ... 46
TABLE 4.12: SUMMARY OF CARRIER COST FUNCTION REGRESSION ... 53
TABLE B. 1: TESTS OF NORMALITY ... 72
List of Figures
FIGURE 4.1: DISTRIBUTION OF PACKAGES PER CARRIER ... 29FIGURE 4.2: DISTRIBUTION OF LANES PER PACKAGE...30
FIGURE 4.3: LANE VOLUME VERSUS NUMBER OF PACKAGES ... 34
FIGURE 4.4: NUMBER OF PACKAGES VERSUS CARRIER SIZE... 36
FIGURE 4.5: ROUND TRIP PACKAGE M AP ... 37
FIGURE 4.6: DESTINATION PACKAGE M AP ... 39
FIGURE 4.7: ORIGIN PACKAGE M AP ... 40
FIGURE 4.8: DISPARATE PACKAGE M AP ... 41
FIGURE 4.9: DISTRIBUTION OF PACKAGE DISCOUNTS... 43
FIGURE 4.10: GEOGRAPHIC REGIONS... 54
FIGURE 4.11: REGIONAL PRICING EXAMPLE...56
Chapter 1
Introduction
Truckload motor carriers, those who dedicate a truck to a single shipment between an origin-destination pair, represent over 40% of the US transportation
expenditure (Sheffi, 2002). Despite its $240 Billion in annual revenues, few industries are as fragmented as truckload transportation. The U.S. Census report estimates that, with over 30,000 companies of varying sizes, the truckload transportation industry is one of the three most fragmented business sectors in the country (CSFB 2000).
Truckload carriers have felt a number of pressures in the past years, including overcapacity, a shortage of professional drivers, and increases in the costs of insurance and fuel. In addition to these persisting challenges, lately, as a result of a sluggish economy, truckload carriers have experienced demand shortages. "Almost every other sector [besides automotive] is down or flat" says Scott Arves, President of Schneider National, the nation's largest privately held truckload carrier (Schulz, 2003). To remain competitive, and in some cases, remain in business, truckload carriers are searching for ways to wring more profit from their existing business.
In a 2000 study of outsourced logistics, Credit Suisse First Boston projected that "asset-based carriers should be able to realize immediate improvements to earnings and improvements to both returns on invested capital and returns on equity" through new technologies and services offered by third party logistics providers (3PL's) and
3-"eLogistics" companies. CSFB goes on to hypothesize that carriers should be able to see improvements in asset utilization of 5% to 10% as a result of applying these technologies.
Combinatorial auctions are one technology capable of improving carrier asset utilization that has become increasingly prevalent in the past few years. Often called "conditional auctions," these are arrangements in which a carrier submits a series of bids whose prices that are dependent upon receiving a commitment of volume, or percentage of traffic, in a set of lanes. It has been hypothesized that, by allocating portions of a shipper's network to those carriers whose existing networks and cost structures most complement specific-origin destination pairs, both shippers and carriers will benefit in the form of lower freight rates and increased asset utilization, respectively.
Though combinatorial auctions have been explored from the perspective of a shipper in a number of papers, little has been written about the value truckload carriers receive from such auctions. This thesis investigates how truckload carriers react when given the opportunity to submit conditional bids and how combinatorial auctions create value for truckload carriers.
1.1 Key Definitions
Truckload transportation, and the procurement thereof, often uses a language of its own. Following are some frequently used terms that we found helpful in
understanding the dynamics of combinatorial auctions from a carrier's perspective. Truckload- Truckload (TL) trucking, as opposed to less-than-truckload (LTL) trucking, usually involves a single tractor-trailer combination vehicle dedicated to one shipment between a single origin and destination.
Lane - In truckload trucking, a "lane" represents a unique origin - destination
pair. For example, "Columbus, OH to Tempe, AZ" would represent a unique "lane." Deadhead - Deadhead represents the empty miles a carrier incurs in relocating a piece of equipment from the destination of one shipment to the origin of another. As with any cost, carriers seek to minimize deadhead.
Dwell time - Like deadhead, dwell time represents a cost of waste which carriers seek to minimize. Specifically, dwell time refers to the time a piece of equipment sits idle waiting for a follow on load.
Bidder - For the case of this paper, a "bidder" is a truckload carrier submitting a price, or rate per mile, on one or more of the lanes offered by the auctioneer.
Auctioneer - Though definitions throughout the literature differ considerably, here we define an "auctioneer" as an entity that uses a procurement auction to offer a lane or combination of lanes to a group of truckload carriers who may be interested in
servicing that lane. Under this definition, the "auctioneer" could be either the shipper or the software vendor, because the two are seen as one by the carrier.
Discrete / Unconditional Bid - As in most procurement auctions, a "bid" represents a bidder's offered price. A discrete bid is an offer for a single lane whose offered price is not conditional on being awarded any other lanes. A carrier will be awarded the lane in a discrete bid only if its offered price is lower than that of all other bidders. For example, if Buckeye Trucking Company submits a discrete bid of $1.24 per mile for the "Columbus, OH to Tempe, AZ" lane and Hurricane Trucking Company submits a discrete bid of $1.25 for the same lane, and no other lanes or bidders are involved, Buckeye Trucking company will be awarded that lane.
5-Package / Conditional Bid - Conversely, a package bid represents an offer for a single lane whose price is conditional on being awarded some other lane or combination of lanes. A carrier will be awarded the lanes from a package bid if the total cost of all lanes in that package is less than the total cost for the comparable lanes from competing bidders. For example, Buckeye Trucking Company would be awarded a package bid containing the "Columbus, OH to Tempe, AZ" lane and the "Ann Arbor, MI to
Columbus, OH" lane if the total cost for those lanes is lower than the total cost for both lanes submitted by all competing bidders.
1.2 Research Objective
The intent of this thesis is to continue to explore the "Truckload Procurement Problem," which Caplice (1996) describes as "how shippers procure transportation services from truckload carriers." Specifically, this thesis focuses on how carriers react when given the opportunity to submit conditional bids in a combinatorial auction. Building upon previous literature on combinatorial procurement and the economics of truckload transportation, we set out to answer the following questions:
" What do the package bids carriers construct in combinatorial auctions "look like;" " Which lanes do carriers bundle together and why do they bundle those lanes; " By how much will a carrier discount its unconditional price to be able to bundle
lanes together;
" How competitive are carriers in bidding; and
" What factors drive the price a truckload carrier charges?
1.3 Thesis Outline and Methodology
Chapter 2 examines the driving economics of truckload transportation, and explores the extent to which the industry exhibits characteristics of economies of scale,
chapter presents our findings from interviews with those with experience in truckload transportation procurement. We present insights from a diverse group of truckload carriers who represent a broad spectrum of experiences. The carriers with whom we spoke included:
" Bohren Logistics -A relatively small, regional trucking company operating approximately 100 Flatbeds, Dry Vans and Refrigerated Vans within the Midwest;
* Cannon Express -A Southeastern based Dry Van carrier operating about 500 power units and serving the eastern two-thirds of the US;
* TMC Transportation -One of the nation's largest flatbed trucking companies, with over 1500 power units and a service region throughout the eastern 2/3 of the country;
" Falcon Transport - A medium-size, privately held diversified Flatbed and Dry Van Truckload serving the Midwestern automotive industry.
* Sitton Motor Lines -A family owned Dry Van Truckload carrier based in the Midwest that operates approximately 600 power units;
* Transport America -A Texas-based Dry Van Truckload operation operating approximately 2000 power units;
" Swift Transportation -A publicly held Dry-Van truckload carrier based in the Southwest with a national presence and over 10,000 power units; and
" Schneider National -A privately held, diversified, national carrier with over 10,000 power units.
In addition to carriers, we present the insight of several firms with experience in buying truckload transportation in conditional auction, including:
* Owens Corning - A Fortune 500 manufacturer of building materials with 113 plants throughout North America.
* C.H. Robinson - The nation's largest third-party logistics firm who in 2002 earned more than $3 Billion, primarily from brokering truckload transportation. * Manhattan Associates - A technology based "supply chain execution" company
using its OptiBid technology to "improve carrier assignments."
" i2 Technologies - A "supply chain optimization company" using an auction based RFQ to "conduct collaborative freight rate negotiations."
* Schneider Logistics - A spin-out of Schneider National delivering "technology powered solutions."
" Manugistics - A software developer focused on pricing and supply chain solutions, including NetWORKS Transport RFQ, an auction technology.
-7-Chapter 3 describes the truckload procurement process and explores some of the issues truckload carriers consider when setting prices. As before, Chapter 3 combines a review of the relevant literature with our interviews with the truckload carriers and buyers of truckload transportation services mentioned above.
Chapter 4 examines actual strategies truckload carriers pursued in package bidding and analyzing the results of thirteen independent combinatorial auctions. Using actual bids of recent combinatorial auctions, we show how carriers package lanes and explore a number of cost models explaining which factors drive the prices truckload carriers charge.
Finally, Chapter 5 summarizes our findings from each of the preceding chapters, presents our conclusions and discusses areas of potential future research.
Chapter 2
Carrier Economics
One point of discussion in the literature, as well as in practice, has been the extent to which truckload carriers seek to increase their traffic in the lanes they currently serve, versus increasing the number of lanes they serve. Three economic concepts we found useful in exploring this trade off, as well as prevalent in the literature, included: (1) Economies of Scale; (2) Economies of Density; and (3) Economies of Scope. Though abstract, these concepts help us to understand why truckload carriers bid the way they do.
While we will show that scope is the most significant economic force in truckload transportation, we also found that truckload carriers exhibit economies of scale and, to a lesser extent, economies of density.
2.1 Economies of Scale
In a 1996 paper, Oum and Waters describe Returns to Scale (RTS) as the marginal cost savings of increasing the spatial size of, and the number of lanes in, a carrier's network at the same rate it increases "traffic", or volume of shipments within that network. Jara-Diaz and Basso (2002) go on to explain that "in the transport case, scale economies are related with the convenience or inconvenience of expanding proportionally the flows in all [lanes]."
Caplice (1996) examines the presence of economies of scale in truckload
operations and reports that "[b]ecause TL carriers have very low fixed costs and are more sensitive to the balance of the loads, they tend to have slight diseconomies of scale."
-9-George Kuharick of Cannon Express reports that he would offer lower rates for higher volumes in a single lane in his existing network, a characteristic of economies of scale. However, cautions Kuharick, this is driven primarily not by large volumes, but rather by predictable, repetitive shipments. Consistent shipments, such as these, give the company a greater ability to balance its network, implying more than simply economies of scale.
Larry Johnson, the Vice President of Customer Service of Transport America suggests that his firm's current pricing strategy was designed to build "Lane Density." Having significantly expanded the spatial size of the company's service network in recent years, Transport America will discount lanes with higher density, that is lanes with higher shipment volumes and/or more freight available at the destination to build balance within its network.
Thus, our conversations with carriers confirm that truckload transportation is driven more by balance among lanes than simply by increasing traffic proportionally across all lanes. It is important to note, however, that, as in any business, some subtle, underlying economies of scale do exist. This can be seen in that that larger carriers have more purchasing power for fuel, tires, equipment and insurance (CSFB 2000).
2.2
Economies of Density
Economies of Density, according to Oum and Waters (1996), exist when a carrier enjoys a marginal cost savings from increasing the volume of shipments within its
network, but holding the number of lanes it serves and the spatial size of its network constant. Yevdokimov defines returns to density as "a decrease in average total cost of transportation due to increase in capacity utilization of the existing transportation
network." Jara-Diaz and Basso (2002) support this and add that "if network size was optimal (RTS=1) the firm must exhibit increasing returns to density" because RTS<RTD.
Caplice (1996) explains that economies of density result from increasing the number of shippers within given area (economies of customer density) or from increasing the number of shipments from a single shipper (economies of shipment density). Caplice further explains that economies of density tend to be more prevalent in consolidated carriers than in line-haul truckload carriers and are "essentially economies of scale for their local [pickup and drop off] movements."
Thus, while economies of density are present in truckload carrier operations, their effect, according several of the carriers with whom we spoke, is small and relatively insignificant when compared to the impact of economies of scale and scope.
2.3 Economies of Scope
In economics, increasing returns to scope imply adding more outputs to the production line will decrease marginal costs, suggesting it is cheaper for a single firm to product more products. Jara-Diaz, Cortes and Ponce (2001) paraphrase Panzar and Willig (1981) in making the observation that "scope analysis deals with the enlargement of the set of outputs produced, while scale analysis relates with producing more of each component of the same set of outputs."
In terms of truckload transportation, economies of scope suggest that a carrier enjoys a marginal cost savings by supplying / serving more lanes, where each lane is considered a unique "product" or output (Jara-Diaz and Basso, 2002).
Caplice (1996) describes this in more practical terms by explaining that truckload carriers are driven primarily by economies of scope "because the cost of serving [a lane]
-is strongly affected by the probability of finding a follow-on load out of that destination location." According to Caplice (1996), balanced lanes, those in which the volume of freight inbound to one destination point is approximately equal to the outbound volume from that point, should be less expensive for carriers to serve than lanes in which inbound and outbound volumes are different.
Kim Johnson of TMC Transportation supports Caplice's description by saying that her company's pricing department weighs heavily the amount of dead-head miles and layover / dwell times in their pricing strategy and confirms that they will charge more in lanes in which they expect a truck to incur excessive dwell time or deadhead miles.
Tony Colombo, Director of Pricing for Sitton Motor Lines also confirms
Caplice's description and adds that, by understanding the points in its network where the probability of finding a follow-on load is low, his firm is able search for complementary
lanes that increase the probability of getting a follow-on load. For these lanes, Sitton will offer a discounted price so as to avoid dwell time or deadhead costs.
Wayne Hollister of Schneider National, argues that at these points of freight imbalance, a carrier has a relative cost advantage over other truckload carriers because, if the carrier does not secure balancing volume in that lane, it must either wait for a load, deadhead the truck elsewhere, or look to the spot market. Because both dwell time and deadhead reduce a carrier's return on assets and because prices in the spot market tend to be volatile and unpredictable, carriers will prefer to lower their price and secure volume.
Thus, our interviews with truckload carriers confirmed that, because the cost of serving one lane is dependent on the availability of freight in follow-on lanes, economies of scope are the controlling economics of truckload transportation.
2.4 Driving Economics of Truckload Transportation
Understanding that economies of scope drive truckload transportation, we inferred that truckload carriers would try to increase the scope of their networks when bidding in
auctions. In speaking with carriers, we confirmed that many were using combinatorial auctions to increase the number of lanes they served.
Similarly, in a 2003 paper, Song and Regan argue that "the carrier's objective ...
is to find an effective strategy for estimating their valuations on any combination of new lanes and hence construct their bids to win the lanes most profitable for them." Rather than trying to win as many lanes as possible, Song and Regan explain, a carrier seeks only to win those lanes "that can make its current operation more efficient."
Under this rationale, and given that, because of economies of scope, carriers benefit from serving more lanes, each carrier would have a unique valuation for each lane, depending upon all other lanes in the shipper's network and the carrier's network. Thus, we inferred that each carrier would submit a unique bid for each lane in an auction.
In their 2002 paper, Jara-Diaz and Basso suggest that factors both endogenous and exogenous to the carrier drive its lane valuations, and thus how it bids in an auction. Some of the exogenous factors impacting a firm's economies include:
" The Lane Demand Structure -the quantity shipments demanded in each lane; " The location of the Nodes; and
* The Physical Network.
Given these conditions about a shipper's network, a truckload carrier must make decisions about the following endogenous factors:
" A Service Structure - the pattern vehicles will use to serve each of the nodes;
" A Route Structure; and
" A Link Sequence / Operating Rules - the order in which vehicles will visit nodes.
13-Jara-Diaz and Basso (2002) also point out that, while in certain cases, a single carrier may be able to manipulate endogenous factors to create a cost advantage, in most cases, the economics of a network are determined by the externalities; primarily the physical network and the lane demand structure.
Jara-Diaz and Basso (2002) go on to show that by adding new lanes to its existing network (i.e. adding new "products," or more scope) a truckload carrier can improve its asset utilization. Thus, conclude Jara-Diaz and Basso, the economies of a carrier's operations are primarily dependent on exogenous factors such as the shipper's physical network and location of the nodes.
The carriers with which we spoke confirmed that shippers' networks are the primary driver of their economies and reported that the most difficult part of their business was choosing which lanes to serve and at what price. Our interviews suggest that operational-level complexities are the reason why network expansion is often very difficult to plan.
2.5
Operational Complexities
According to the carriers we interviewed, even long-term contracts do not ensure a steady flow of freight, meaning that on any given day, a carrier doesn't know exactly how many shipments its customers are planning or where those shipments are going.
Further complicating matters, carriers often don't know until the very last minute when a shipment is going to be available. Therefore, given the uncertainties described above, carriers may, at times, have to send equipment outside of their network to avoid dead-head or excessive dwell time, or to help a customer who can't get the load moved any other way. Some of the major considerations on carriers minds' each day include:
* Having a re-load available when each truck is empty to minimize waiting or "dwell time";
* Finding a re-load origin in close proximity to the destination point of the truck's previous load so as to minimize unloaded, or "dead-head" miles;
* Selecting a route structure that will allow the driver adequate time at home, while minimizing out-of-route miles.
* Selecting a route structure that maximizes a driver's available hours of driving time, as designated by the U.S. Department of Transportation.
These interviews suggest that, depending upon the networks they are serving and the state of their growth, different carriers enjoy different economies based on their customer's networks, and thus prioritize the above decisions differently.
Because truckload transportation is an asset and labor intensive business, carriers stand to benefit significantly by increasing their fleet and driver utilization. However, depending upon the size of the shipper's network and the traffic within that network, the extent to which economies of scope, scale and density are present may vary.
2.6 Competition
Caplice (1996) relates that, since the deregulation of the motor carrier industry, the number of carriers with revenues greater than $3,000,00 has decreased slightly, the number of carriers with revenues less than $3,000,000 has increased nearly 500%.
Paraphrasing Rakowski, Souther, and Jarrell (1993), Caplice explains that this phenomenon may reflect two separate truckload markets; one perfectly competitive market made up of a large number of commodity-like small, simple carriers; and one differentiated market made up of a few advanced, differentiated carriers.
Though none of the carriers with which we spoke were smaller than $3,000,000 in annual revenue, several confirmed Rakowski, Souther, and Jarrell's description of two separate competitive markets for truckload transportation.
-Chapter 3
Truckload Transportation
Within this chapter, we explore how shippers procure truckload transportation, how and why carriers choose the prices they do, and what experience some truckload carriers have with combinatorial auctions.
3.1 Truckload Transportation Procurement
Shippers procure truckload transportation services by auctioning each of their lanes (an origin - destination pair) using a first price, sealed bid reverse auction. Shippers begin by sending a Request for Proposal (RFP) or Request for Quote (RFQ) to a group of
carriers, and finish by running a set-covering, price minimization problem to find the combination of bids that covers all required lanes and meets all required constraints for the minimum cost.
Sheffi (2002) describes the task of transportation procurement as "inherently burdensome" because "even medium-size bids involve thousands of different, non-independent items/products, each with its own quantity." In addition to prices, Caplice (1996) identifies a number of additional considerations such as reliability, equipment availability and consistency shippers may use in developing the business rules behind an auction and in awarding lanes.
John Gentle, Global Carrier Relations Leader for Owens Coming, leads an effort to maintain competitive rates for all of Owens Corning's truckload transportation in North America. Gentle coordinates procurement auctions for Owens Corning's 113
facilities about every twelve to eighteen months. Though Owens Corning is very selective about the carriers it allows to participate in its auctions, serving its massive network requires over 100 carriers bidding in each auction, confirming the complexities associated with choosing the "right" combination of lanes to award.
To combat this complexity, Gentle runs only one auction at a time. Besides easing the computational strain on his staff, Gentle has found that carriers "pay more attention to each [auction]" when offered only one. While Gentle believes that allowing carriers to bundle lanes from a number of Owens Corning's facilities may result in some price discounts, he has not done so because of the difficulty in administrating larger auctions.
3.2 Truckload Carrier Bidding
In the past decade, truckload carriers have seen a dramatic increase in the number of RFQ's and RFP's they receive. For carriers too, the RFP/RFQ process presents
significant challenges.
The bidding process begins when a truckload carrier receives an RFQ or RFP. In our research, it appeared that the number of requests to which a carrier could respond depended on the size of the carrier. Rick Plummer, the Operations Manager of Bohren Logistics, processes and responds to about half of the roughly 10 small bid requests his company receives monthly.
Kim Johnson, Director of Pricing at TMC Transportation, and her department of four, process the three to four large bid packages they receive weekly, and respond to about 90% of them.
Larry Johnson, the Vice President of Customer Service of Transport America says he receives about 500 RFP's per year. While his pricing department tries to review every
17-bid package they receive, they pay particular attention to those of current or "high potential" customers, and respond to only a fraction of the actual bid requests they receive.
3.3 Detailed Information is Critical
Many carriers told us that, when they receive very specific information, such as the lane-demand structure and physical network described in chapter 2, before an auction begins, they are better able to understand how the new lanes may fit into their network, and thus may be able to offer a better price.
George Kuharick, Director of Pricing for Cannon Express stressed that sharing information about lane demand structures is vital to improving equipment utilization and thus lowering the carrier's prices. By understanding some of his customer's lane demand structures, Kuharick initiated negotiations for combinatorial bids with a number of shippers in the absence of auctions, resulting in lower costs to the shipper and greater profitability for Cannon.
Tony Colombo of Sitton Motor lines adds that most carriers would be able to offer significantly lower prices if shippers were to present detailed information on lane volumes, seasonal fluctuation and shipment times (time of day, day of week, week of year, etc.), so that carriers would be able to plan accordingly when bidding on lanes.
John Gentle of Owens Coming confirmed these claims and adds that he has found when he (the shipper) provides more detailed information, such as the day of the week, the time of day and the season in which freight will ship, carriers are able to provide much more competitive rates. Gentle speculates that carriers can offer more competitive rates when given better information because they have more time to find follow-on loads.
3.4 Carrier Pricing Considerations
After receiving a request, a truckload carrier will take into account a number of different factors in setting its price for each lane. While some of the more sophisticated carriers depend on rigorous processes and expensive software applications, others rely upon their experience.
Larry Johnson of Transport America described the bidding process as beginning with understanding what level of service the customer requires. Not considering
dedicated equipment, some of the factors carriers use in understanding truckload shippers' requirements include the number of drop-trailers required, shipping times, scheduled versus unscheduled loading and unloading times, driver friendliness and shipment consistency.
From these requirements, a carrier then tries to extrapolate the costs to serve a particular lane, including vehicle licensing, truck - to - trailer ratio, driver costs,
administration and overhead, fuel, tolls and other "miscellaneous costs."
In setting rates, we found a fair amount of consistency in what carriers looked for. Rick Plummer of Bohren Logistics cites the following considerations in setting it prices.
* Market rates; 0 Freight characteristics;
* Costs to serve; * Layover requirements; and
* Lane Density / Balance. * Loading / unloading delays.
* Rates in similar lanes;
George Kuharick of Cannon Express adds the following to the above list.
* Dead-head distance; 0 Miscellaneous costs (tolls, etc);
* Delivery time of day; 0 Service Commitment; and
* Overhead / cost to administer; * Shipper's credit risk.
19-Based on costs and the market rates, the carrier will then determine whether the lane can meet his profit and revenue objectives. Though unclear about their true profit objectives, in most cases, we found that truckload carriers establish a rough "base-rate" annually. One carrier we interviewed budgets a "rate-per-all-mile" goal each year, which it seeks to meet or exceed in its bidding. This goal simply says that the company's
revenue divided by the number of miles its trucks traveled that year will be above a certain level.
Another important consideration in carrier's pricing structures is "Lane Density." Carriers described this consideration as a combination of volume in the lane and balance of freight between the origin and destination, reinforcing economies of scope as the dominant economies of truckload transportation.
3.5
Network Balance / Lane Density
In most carriers' pricing models, lanes with higher density, that is lanes with higher shipment volumes and/or more freight available at the destination would carry a lower price than lanes with lower densities. Though this simple logic is embedded in virtually every carrier's pricing model, how a carrier decides when and by how much to adjust prices varies considerably among carriers.
Small, simple carriers tend to rely on experience and "gut feel" when setting prices, whereas larger carriers may have more sophisticated pricing mechanisms and account more for balance in their networks when setting prices. In considering these balance issues, one carrier describes a simple process by which he will lower rates "as he sees fit" to encourage volumes to and from a particular region to be approximately equal.
Rick Plummer of Bohren Logistics adds that when quoting a price on a lane, he will qualitatively consider the information provided from the shipper, as well as the availability of freight in the destination region, the average dwell time of equipment there and cost to dead-head out of that region.
A number of the larger, progressive and advanced carriers with which we spoke use proprietary software applications to determine how much more or less to bid on a lane, given its impact on the balance of the network. Therefore, if a lane provides a backhaul out of a congested area, this system will give the pricing department an idea of how much less they can bid on the lane to compensate for balancing the network.
One such system, which references the previous thirty day's shipments, considers not only the volume of shipments into and out of a zone, the average dwell time and cost of dead-head to a different zone.
Though sophisticated and robust, these pricing systems still allow for human judgment and experience. Kim Johnson of TMC Transportation, who reports using such an application, says that she frequently speaks with field sales reps and will adjust the recommended prices to attract a potentially large or strategically important customer.
3.6 Combinatorial Auctions
Increasingly, these RFP's / RFQ's allow carriers to bid on combinations or lanes or "packages." The price carriers submit for each lane in a package is conditional on the carrier being awarded all lanes in that package.
Song and Regan (2003) describe combinatorial auctions as "those in which the auctioneer places a set of heterogeneous items out to bid simultaneously and in which bidders can submit multiple bids for combinations of these items."
-It is important to note that, while combinatorial auctions may be useful in helping a carrier balance its network, they do not imply continuous moves. As we will explore in more detail later, "continuous moves" are an operation level tool to provide a truckload carrier with a predictable freight pattern that minimizes deadhead and dwell time. Conversely, combinatorial auctions provide a more strategic tool that allows carriers to reflect their true costs when securing freight volumes in unbalanced lanes.
In a combinatorial truckload procurement auction, carriers (bidders) submit not only simple single lane, or "discrete," bids, but also "packaged" bids for combinations of
several lanes. Caplice (1996) describes combinatorial auctions as those that "allow the use of conditional bids," and says that such auctions include the following benefits:
" Efficient Allocation;
" Less threat of exposure for carriers;
" Greater ability for carriers to expose synergies; and " More control for both shippers and carriers.
In addition to these benefits, Caplice (1996) also lists the following downsides: " Complex implementation;
" Shipper must solve a complex optimization problem; * Communication problems;
" Shipper and carrier unfamiliarity with combinatorial auctions.
Examples of Combinatorial Auctions
The first application of combinatorial auctions in transportation took place in the 1995 within Sears Logistics Services (SLS). Motivated by the understanding that
truckload carriers could improve asset utilization by serving multiple lanes, SLS, in partnership with Jos. Swanson & Co (JS&Co) and Net Exchange (NEX), designed a "combined value" auction that lasted 5 rounds and yielded savings of 13% of Sears' total truckload transportation spending (Ledyard et al, 2000).
Ledyard et al (2000) attribute the success of this auction to a number of factors. First, SLS limited the number of carriers participating in the bid to 14. In doing so, SLS assured carriers that they stood to gain more business by participating in the auction. Second, SLS provided carriers with a great deal of very detailed information about lane demand structures, allowing carriers to understand the impact of each lane on their existing networks.
In another example of combinatorial auctions, Elmaghraby and Keskinocak (2000) tell how, in 1999, Home Depot contracted with i2 Technologies to identify synergies between its network and those of its carriers. Unlike SLS, Home Depot encouraged a large number of carriers to submit bids, collecting, in total, bids from 91 carriers in the first round and 36 carriers in the second round.
Like SLS, Home Depot believed that by providing carriers with more "visibility" of its lane demand structure, carriers would submit bids that more accurately reflected their true cost structure. Therefore, in addition to detailed information on origin and destination locations and lane details, Home Depot provided bidders in this auction with demand forecasts, projecting future volumes within each lane.
Not surprisingly, given the large number of participants, some carriers were not as happy with the outcome of the Home Depot auction as with the SLS auction. Though some carriers gave feedback such as "This is great, this is the future," other remarked "This is too complex, it can't work." This lack of satisfaction can also be seen in that only 36 of the 62 carriers invited to participate in round 2 submitted bids.
While Home Depot was pleased with the savings this auction generated, it acknowledged that carriers could have been more satisfied and, for future auctions, planed to spend twice as much time educating carriers before bidding begins.
-Carrier's Experience with Combinatorial Auctions
Surprisingly, a number of the carriers with which we spoke reported at least some experience with combinatorial auctions and conditional / package bids. Though the carriers with package bidding experience did acknowledge that, at least in theory, combinatorial auctions may be able to help truckload carriers improve their asset utilization, many were quick to point out the short coming of package bids.
"Making [a package] bid doesn't work when you can be underbid on any one single lane," said Tony Colombo of Sitton Motor Lines. His experience with package bidding had been that most shippers fail to execute package bids, and instead revert to using either pre-bid prices or single lane prices from the package bid.
In addition to execution problems, several other carriers point out that package bids are only applicable in lanes with a large volume of predictable, consistent freight. Rick Plummer, Operations Manager of Bohren Logistics, suggests that, while conditional bidding has allowed carriers to lower their deadhead miles, the increased pricing pressure they feel from auctions drives their prices lower.
Carriers, leery from shippers' inability (or unwillingness) to execute package bids, sometimes set their prices higher than they would if shippers approached bidding with a more collaborative attitude.
Despite these challenges, many carriers see the possibility for combinatorial auctions / package bids to result in significant savings if shippers focus on a few fundamentals.
1. Execute - Carriers lose faith when shippers request a bid and don't act on it, or
relationship between shippers and carriers begins to deteriorate, carriers will either set their prices higher, or will cease to do participate in new bids.
2. Provide detailed lane demand structure infonnation- Carriers need to know the nitty-gritty details of the freight. Besides annual volumes, they need to know exactly when the freight will be available to ship, the level of shipment fluctuation, and the service level requirements.
3. Minimize auction constraints - Carriers suggest that by being able to secure multiple lanes through packaging, they can more accurately reflect their true cost structure in bidding. However, carriers cite examples of auctions in which the shipper had predetermined to award a large set of lanes to certain carriers before the bidding began. Carriers say that these constraints undermine their ability to win new package bids based on their true cost structure.
-Chapter 4
Carrier Bidding Behavior
To more completely understand the value of combinatorial auctions for Truckload Carriers, we worked with four major vendors of auction software to study how truckload carriers bid when given the opportunity to submit packages. These vendors provided us with actual bid data from thirteen unique auctions, representing 644 truckload carriers,
5233 lanes, and 90908 individual bids, including 1294 packages.
From this analysis, we sought to answer the following questions: " What do package bids "look like;"
* Which lanes do carriers bundle together;
" By how much will a carrier discount his or her unconditional price to be able to bundle lanes together;
" How often do package bids win; and
" What factors drive the price a truckload carrier charges?
4.1 Methodology
We begin by examining the circumstances under which carriers submit package bids. Section 4.2 shows how often carriers submit package bids and the number of lanes for which carriers submit package bids, while section 4.3 examines how many lanes carriers bundle into a single package. In addition, Section 4.4 we explore some of the strategies carriers employed in combining lanes in package bids.
Section 4.5 examines the distribution of package discounts throughout the
different auctions. We define a "package discount" as the percentage by which a carrier is willing to lower its discrete bid on one individual lane to bundle one lane with others. It is
Package Discount
= Discrete Bid -Package BidDiscrete Bid
Section 4.5 goes on to compare the discrete and package bids for each of the 9880 packaged lanes and identified a frequency distribution of package discounts, as well as to project the number of package bids that are the lowest cost in their respective lanes.
Finally, Section 4.6 examines the factors that may drive the price carriers charge for each lane. We built models of carrier price functions for each auction, using ordinary-least-squares (OLS) regression, and explored the impact of volume, distance and number of packaged lanes on package discounts.
4.2 Combinatorial Auction Profiles
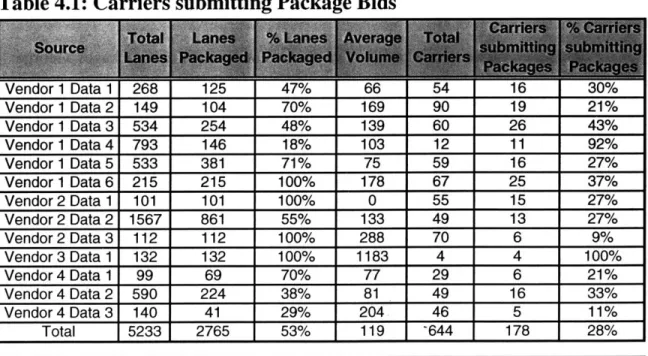
The objective of this section is to explore what combinatorial auctions "look like." In examining how often carriers submit packages we found that, out of a total of 644 carriers, only 178, or 28%, submitted package bids. While in two auctions the majority of carriers submitted packages, and in two others only about 10% of carriers submitted packages, in the majority of auctions, about 30% of carriers submit packages.
Table 4.1: Carriers submitting Package Bids
venaor 1 vata 1 Vendor 1 Data 2 Vendor 1 Data 3 534 254 48% 139 60 26 43% Vendor 1 Data 4 793 146 18% 103 12 11 92% Vendor 1 Data 5 533 381 71% 75 59 16 27% Vendor 1 Data 6 215 215 100% 178 67 25 37% Vendor 2 Data 1 101 101 100% 0 55 15 27% Vendor 2 Data 2 1567 861 55% 133 49 13 27% Vendor 2 Data 3 112 112 100% 288 70 6 9% Vendor 3 Data 1 132 132 100% 1183 4 4 100% Vendor 4 Data 1 99 69 70% 77 29 6 21% Vendor 4 Data 2 590 224 38% 81 49 16 33% Vendor 4 Data 3 140 41 29% 204 46 5 11% Total 5233 2765 53% 119 -644 178 28% -27-149 104 70% 169 S90 19 21%
We asked several carriers to comment on why they may not submit packages in an auction, and found a number of reasons, including:
" Uncertainty of a load actually being available when needed; " Belief that bids rarely win auctions; and
" Lack of faith that the shipper will actually execute on the bid.
Greg Malys of Falcon Transport tells us that his firm has been successful in using packages to improve asset utilization by reducing deadhead miles and dwell time.
However, Malys has found that, when shippers cannot specify when a load will be available, dwell time may increase significantly so that even if a carrier is awarded a package, its asset utilization does not improve because freight does not become available when the carrier has a truck available.
Throughout our conversations, we found comments like those of Mr. Malys to be fairly common, suggesting that some portion of carriers are using package bidding to construct continuous moves. In Chapter 3, we highlighted the differences between package bids and continuous moves, and pointed out that, while in some situations, package bids may create a quasi-continuous move, their real value comes in adding balance to a carrier's network.
In addressing the second reason that carriers may not submit packages, George Kuharick of Cannon Express reports that "more often than not, shippers do not use any of the packaged bids [a carrier submits]." As a result, Kuharick says, carriers such as his lose interest after their initial experience of losing and will not spend the time to create package bids in future auctions.
Carriers have also found that even if they are awarded package bids, shippers may not execute on them. In examining why shippers fail to execute on bids collected in
auctions, we found that shippers may reject bids when their cost are significantly higher than what that shipper is currently paying. John Gentle of Owens Corning confirms this
and adds that, even though shippers try to avoid reneging, they will sometimes accept only part of an auction to avoid exceeding their annual budget.
Another reason we found that shippers fail to execute on packages is that they lack the operational level tools to do so. Matt Harding of Manhattan Associates, reports that, in many circumstances, he has found that shippers lack an IT system capable of tendering awarded packages. Similarly, Josh Martin of i2 Technologies reports that his firm actually had to develop a tool to allow its customers (i.e. shippers) to tender the packages they awarded.
Number of Packages Submitted
Understanding that only a portion of carriers will submit packages, we found that even when carriers do submit package bids, they usually do not submit a large number of them. In this case, of the 28% of carriers that submit packages, most submitted between 2 and 7 packages.
Figure 4.1: Distribution of Packages per Carrier
16 14 12 10 8 0 6 # of Packages - 29
-For each auction, a slightly different distribution of packages per carrier emerged. This suggests that the number of packages a carrier submits is dependent on the shipper's
network and supports Jara-Diaz and Basso's (2002) assertion that the value of any network is unique depending on the location of the nodes and the lane demand structure.
Table 4.2: Distribution of Packages per Carrier
Vendori Data 1 2 18 8 2 b3 _V Vendorl Data 2 1 56 19 1 436 113 Vendor 1 Data 3 2 21 12 12 135 27 Vendor 1 Data 4 14 166 128 - 592 160 Vendor 1 Data 5 2 172 55 12 978 255 Vendor 1 Data 6 2 91 19 56 1514 299 Vendor 2 Data 1 2 15 8 2 51 17 Vendor 2 Data 2 3 117 59 87 645 171 Vendor 2 Data 3 2 19 8 8 57 22 Vendor 3 Data 1 29 60 52 - 106 37 Vendor 4 Data 1 12 26 19 12 50 16 Vendor 4 Data 2 2 24 19 15 89 22 Vendor 4 Data3 3 13 8 24 24 11 Total 1 64 19 2 1514 160
Package Size
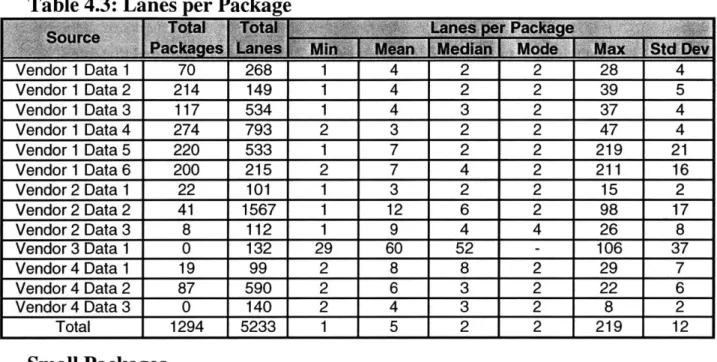
In further examining how carriers package lanes, we found that the vast majority of packages submitted were small, usually containing between two and four lanes.
Figure 4.2: Distribution of Lanes per Package
Unlike the number of carriers submitting packages, the number of lanes per package appears to be relatively stable among auctions.
Table 4.3: Lanes per Package
Vendor 1 Data 1 70 268 1 4 2 2 28 4 Vendorl Data 2 214 149 1 4 4 2 239 5 Vendor2 Data 3 117 534 1 4 3 2 37 4 Vendor2 Data 4 274 793 2 3 2 2 47 4 Vendor2 Data 5 220 533 1 7 2 2 219 21 Vendor3 Data 6 200 215 2 7 4 2 211 16 Vendor 2 Data 1 22 101 1 3 2 2 15 2 Vendor 2 Data 2 41 1567 1 12 6 2 98 17 Vendor 2 Data 3 8 112 1 9 4 4 26 8 Vendor 3 Data 1 0 132 29 60 52 - 106 37 Vendor 4 Data 1 19 99 2 8 8 2 29 7 Vendor 4 Data 2 87 590 2 6 3 2 22 6 Vendor 4 Data 3 0 140 2 4 3 2 8 2 Total 1294 5233 1 5 2 2 219 12
Small Packages
In speaking with carriers, we found that the primary reason packages tend to be small is that many carriers receive a large number of RFQ's and lack the resources to commit a great deal of time to each auction.
As we highlighted in Chapter 3, Rick Plummer, the Operations Manager of Bohren Logistics is responsible for all of the company's pricing, in addition to the daily operations of the fleet, leaving him little time to compile package bids.
Wayne Hollister of Schneider National reports that his company, one of the largest fleets in the nation, can spend up to three weeks analyzing each combinatorial auction in which they are involved. Wayne speculates that few other carriers have the ability to conduct as thorough an analysis as Schneider.
Kevin McCarthy of C.H. Robinson, the nation's largest freight broker, confirms these statements and tells us that in his experience, most truckload carriers not only lack
-31-the complex modeling systems required to complete a robust combinatorial auction, but also the personnel and time to do so.
Large Packages
Though most packages contained between 2 and 4 lanes, we found that a few contained significantly more. In trying to understand why carriers submit large packages, we analyzed five of the largest, containing 219, 211, 98, 47 and 39 lanes, respectively. Four of these five packages were made up of a disparate collection of disjointed lanes, with multiple origin and destination points, while one consisted of outbound shipments from a single point to multiple destinations.
Surprisingly, we found that the carrier's package bids were lower than their discrete bids in only two of these five large packages and in none of the packages did the packaged price "beat" the lowest total cost of the discrete bids for those same lanes.
Some hypothesize that large, uneconomical packages, such as these may result from carriers negotiating with shippers before the auction begins. As we discussed in Chapter 3, George Kuharick of Cannon Express has been successful in approaching shippers outside of an auction to propose conditional bids. Similarly, John Gentle of Owens Coming reports negotiating with carriers before, during and after an auction to ensure all lanes are covered at an acceptable price and by a carrier capable of delivering the level of service required in that lane.
4.3 Packaged Lanes
Within this section, we explore how carriers use the lanes within a combinatorial auction. Specifically, we examine how many lanes, from a given auction, carriers will
combine into packages and, if a lane were combined into a package, how many different packages would include that lane.
Surprisingly, we found that in 4 of the 13 auctions we reviewed, all lanes were used in packages. Even more surprisingly, in 8 of the 13 auctions, more than 50% of lanes were contained in packages, suggesting that the carriers who submit packages reflect a diverse set of networks that can increase their respective lane balances by incorporating portions of other shippers' networks.
Table 4.4: Packages per Lane
Vendor. Data6 215ge 67umh 2La84 E00% n4e
Vendor1 Data 1 268 54 47% 1 2 2 1 9 2 Vendor2 Data 2 149 90 70% 1 10 7 1 70 12 Vendor2 Data 3 534 60 48% 1 2 2 1 11 2 Vendor3 Data 4 793 12 18% 1 12 9 1 41 10 Vendor 1 Data 5 533 59 71% 1 7 5 3 45 7 Vendor 1 Data 6 215 67 100% 2 11 8 4 54 9 Vendor 2 Data 1 101 55 100% 1 2 1 1 13 1 Vendor 2 Data 2 1567 49 55% 0 1 1 1 5 1 Vendor 2 Data 3 112 70 100% 1 1 1 1 1 0 Vendor 3 Data 1 132 4 100% 1 2 2 2 2 0 Vendor 4 Data 1 99 29 70% 1 2 2 1 7 1 Vendor 4 Data 2 590 49 38% 1 2 1 1 8 1 Vendor 4 Data 3 140 46 29% 1 2 1 1 5 1 Total 5233 644 53% 0 4 2 1 70 6
In examining the distribution of packages per lane, we found that both the
percentage of lanes used in packages and the number of packages in which each lane vary significantly between auctions. This deviation suggests that not only is it difficult for auctioneers to predict how many lanes from a given auction will be bundled, but also that
it is difficult to predict how often any given lane will be bundled.
In chapter 3, we discussed literature and interviews which suggested that the combinatorial auctions were particularly valuable in lanes with high volumes because such lanes offered a higher probability of quickly reloading a vehicle, and thus
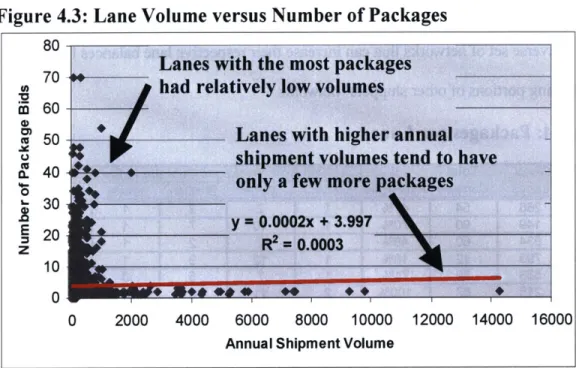
-33-minimizing both deadhead and dwell times. In testing this notion however, we found little relationship between lane volume and the number of package bids. The following scatter plot compares the number of packages in which each lane was included with the annual shipment volume in that lane.
Figure 4.3: Lane Volume versus Number of Packages 80
70 Lanes with the most packages 7V had relatively low volumes 60
CM 50 Lanes with higher annual
shipment volumes tend to have only a few more packages 30
y 0.0002x + 3.997
2 0 1 0 *R 0.0003 )
0
0 2000 4000 6000 8000 10000 12000 14000 16000
Annual Shipment Volume
As Figure 4.3 shows, a lane with 10,000 annual shipments is most likely to be included in only 2 more package bids than a lane with 1 annual shipment. Surprisingly, however, we found that the vast majority of package bids are for lanes with relatively small volumes. Therefore, while certain lanes are more likely to be packaged than others, high shipment volumes do not imply that a lane is more likely to be packaged.
In further testing, we found a very weak positive correlation between the number of carriers and number of packages (p = 0.189), suggesting that adding carriers to an auction increases the occurrence of package bids. This is not to say that each additional carrier will cause the rest to create more packages, but rather that adding carriers increases the likelihood of including a carrier who will submit a lot of packages.
4.4 Carrier Bidding Strategies
As we mentioned in chapter 2, Song and Regan (2003) present the case that "the carrier's objective in [a combinatorial] auction is to find an effective strategy for
estimating their valuations on any combination of new lanes and hence construct their bids to win the lanes most profitable for them." Song and Regan continue and argue that
a carrier seeks not to win as many lanes as possible, but rather only those lanes "that can make its current operation more efficient." Under this rationale, each carrier would have a unique valuation for each lane, depending upon that carrier's existing network.
Though not widely explored in literature, our interviews suggest that not all carriers share a common strategy and that several levels of complexity exist in the way carriers construct packages.
One group of carriers, simple, small companies with limited resources for pricing and constructing bids, seeks only to build continuous moves. Rick Plummer of Bohren Logistics explains that his organization uses conditional bids to secure volumes in single lanes or makeshift continuous moves including two or three lanes, but lacks the time and resources to compile robust package bids.
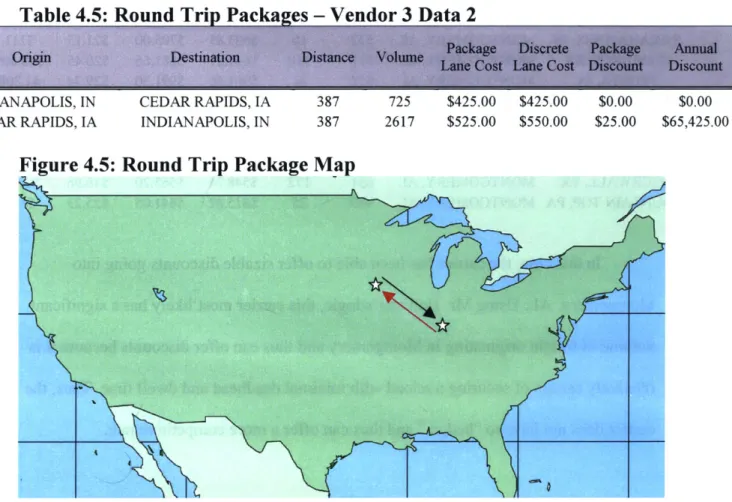
Another group of carriers, progressive medium-sized companies using some network optimization software, will bundle lanes on a regional basis. Greg Malys of Falcon Transport tells us that medium-sized, somewhat sophisticated firms like his use Origin and Destination packages to leverage their existing shipment volumes and create balance within in a given region.
A third group, the largest, most advanced carriers, uses sophisticated software applications to gauge the impact of all lanes in every auction they participate on their