Ceramic Filter Manufacturing in Northern Ghana: Water Storage and Quality Control By
Shanti Lisa Kleiman B.A. Interdisciplinary Studies
New York University New York, NY, 10003
Submitted to the Department of Urban Studies and Planning and the
Department of Civil and Environmental Engineering in Partial Fulfillment of the Requirements for the
Degrees of MASSACHUSETTS INSTI
E OF TECOLO 0GY
Master in City Planning
JUN 3 0 2011
andL
Master of Engineering in Civil and Environmental Engineering
ARCHIVES
at theMASSACHUSETTS INSTITUTE OF TECHNOLOGY June 2011
@ 2011 Shanti Lisa Kleiman. All Rights Reserved
The author here by grants to MIT the permission to reproduce and to distribute publicly paper and electronic copies of the thesis document in whole or in part
in any medium now known or hereafter greated. Author
Department of Civil and Environmental Engineering Department of Urban Studies and Planning A May 6th 2011 Certified by
Ce e bSusan M urcott
Senior Lecturer of Civil and Environmental Engineering -. ,Thesis Supervisor
Accepted by
Heidi M. Nepf
Chair, Departmental Committee for Gra uate Students
Accepted by
Professor Joseph Ferreira Chair, MCP Committee Department of Urban Studies and Planning
Ceramic Filter Manufacturing in Northern Ghana: Water Storage and Quality Control By
Shanti Lisa Kleiman
Submitted to the Department of Urban Studies and Planning and the Department of Civil and Environmental Engineering on May 6th, 2011 in Partial Fulfillment of the Requirements for the Degrees of Master in City Planning and Master of Engineering in Civil
and Environmental Engineering
In 2009, Pure Home Water (PHW), a Ghana based non-profit organization working to provide affordable and safe drinking water to people in the Northern Region of Ghana, began the construction of a ceramic pot filter (CPF) factory near the city of Tamale. By 2011, the factory had the molds, supplies, and kiln necessary for large-scale filter production, but needed to both increase its own water storage capacity, and to implement quality control standards. This thesis documents elements of PHW's efforts to bring household water treatment and safe storage (HWTS) to scale through local manufacturing of ceramic pot filters. Specifically, it records work done between January and April 2011 to build water infrastructure for the PHW factory and to improve quality control for CPF production. Detailed documentation of the design and construction of an underground water storage system, observations about the iterative process of establishing standardized quality control procedures, and recommendations for additional research, are provided to serve as a practical guide for PHW management and others who may engage in similar work in the future.
Thesis Supervisor: Susan Murcott
Acknowledgements
This is dedicated to my mother Carin Brown, and my grandfather Philip Stoddard Brown, who have taught me everything I know about compassion, human decency, and love.
I would also like to extend my gratitude to the people at MIT who have enriched my learning and my life. Dr. Eric Adams, thank you for your fair and broad-minded character. Your willingness to leave the door open when it would have been as easy and justified to do otherwise, has introduced a new world to me, and I am deeply grateful. To Chelsea Humbyrd, Gaj Sivandran, and Tony Parolari for taking TAships to a whole new level -thank you for your time and dedication and for turning lectures and pages into understanding. To Professor Hemond and Professor Madsen, thank you for your commitment to your students' learning experience and for the snacks and stories. To Judy Layzer, Amy Smith, and Susan Murcott, inspiring and dedicated women, in whom I am fortunate enough to have found mentors and friends.
To Susan, thank you for your inexhaustible optimism and enthusiasm. You have supported me during this entire process through your example and your kindness. I have immense respect for your work and the non-exclusivity that permeates everything you do. You are a free and kindred
spirit and the best storyteller I know!
To Amy Smith, who has taught me purposeful spontaneity and fearlessness and how many tetherballs can fit in a suitcase. You are joyful. You put fun in work and faith in the good of individuals and the possibility of transformation. Thank you for your friendship.
My Family. Chosen and given. You are the most beautiful examples of living values I know. Josh Kleiman, Amanda Brown, Carin Brown, Rex Brown, Adele Brown, Annie Murphy, Amy Margolies, and Kofi Taha, everyday I am so grateful for the lessons, the love, the inspiration, and the sweetness that you bring into my life. Without you this would not be.
Many thanks to partners in work, mischief, movement, growing up, and late night kitchen
philosophy; Yanina Seltzer, Christopher Horne, Linda Ciesielski, Elijah Hutchinson, Najiyah Edun, David Quinn, Theodore Golfinopoulos, Derek Brine, Muyiwa Oni, Emilio Domingos, Asante Johnson, Idil Levitas, Mary Murphy, Eva Ackerman, Melissa Slaker, Joshua Friedman, Pedro Nunes, Pedro Modesto, Vanessa Menezes de Andrade, Marilia Felipe, Camille Kurowsky, Pedro Strozenberg, Ailton Bichara, Claudio Napoleao, Mike Norman, Amit Sarin, and An Duong.
To the Ghana Team 2011! Joanna Cummings, Sam O'Keefe, Jonathan Lau, Joshua Hester, Zachary Dearing, Steve Hendel, Mitch Westwood, Manny Hernandez, Curt and Cathy Bradner, Reed Miller (honorary). To Mary Kay Jackson and Charlie Jackson and PHW staff, especially those I worked most closely with, John Adams, Sadat, Al Hasan, Shani, Awal, Frank Kuma, and Daniel. I am grateful to all for the dusty fun, hard work, sharing knowledge, and hospitality. I am especially grateful to one Mr. Westwood who I respect immensely for making himself an invaluable resource in every situation.
Thanks also goes to Bob Nanes whose impact on the trajectory of my learning and work cannot be understated. Thank you.
MITLibraries
Document Services Room 14-0551 77 M aschuscota Avenue Cambridge MA 02139 Ph: 617.253.200 Email: docc@mft edubrftillirarie mndo eaudece
DISCLAIMER
MISSING PAGE(S)
Page 6
There also appears to be a page numbering inaccuracy throughout the thesis.
8 Production Recommendations... 65
9 M anagement Recommendations ... 66
10 Conclusion...---... 67
Bibliography ...----....--..---... 68
Appendix A: Tank Calculator (Ludwig 2005 b)(Oasis Design n.d.) ... 71
Appendix B: Underground Water Storage Tank Costs... 78
Appendix C: Ferro-cement Materials Calculator (Ludwig 2005)... 80
Appendix D: Calculations for PHW Water Demand ... 81
Appendix E: Measurements of Filter Capacity with Change in Height (Miller 2010) ... 82
Appendix F: Filter Factory Quality Control Logs... 83
Appendix G: Bradner Recommendations for Filter Flow Rate Test Protocol ... 86
Abbreviations
CMWG Ceramic Manufacturing Working Group
CT Ceramica Tamakloe Filtron Filters
CPF Ceramic Pot Filters
ET Evapotranspiration
HWTS Household Water Treatment and Safe Storage
JMP
Joint Monitoring ProgrammeMEng Master of Engineering
PHW Pure Home Water
POU Point of Use
RWHS Rainwater Harvesting System
UN United Nations
UNDP United Nations Development Programme
UNICEF United Nations Children's Fund
1 Project Background
In 2009, Pure Home Water (PHW), a Ghana based non-profit organization working to provide affordable and safe drinking water to people in the Northern Region of Ghana, began the construction of a ceramic pot filter (CPF) factory near the city of Tamale. By 2011, the factory had the molds, supplies, and kiln necessary for large-scale filter production, but needed to both increase its own water storage capacity, and to implement quality control standards. This thesis documents elements of PHW's efforts to bring household water treatment and safe storage (HWTS) to scale through local manufacturing of ceramic pot filters. Specifically, it records work done between January and April 2011 to build water infrastructure for the PHW factory and to improve quality control for CPF production. Detailed documentation of the design and construction of an underground water storage system, observations about the iterative process of establishing standardized quality control procedures, and recommendations for additional research, are provided to serve as a practical guide for PHW management and others who may engage in similar work in the future.
1.1 Household Water Treatment
The United Nations and the WHO use the terms "improved" and "unimproved" as standard metrics for determining water safety. "Improved" refers to protected water sources including household connections, public standpipes, boreholes, and protected dug wells, protected springs, and rain harvested water. "Unimproved" refers to any type of open surface water, uncovered, or unprotected well.
Improved Unimproved
Piped water into dwelling, yard or plot Unprotected dug well
Household connection Unprotected spring
Public tap or standpipe Cart with small tank or drum
Tubewell or borehole Tanker-truck provided water
Suface water (river, dam, lake, pond,
Protected dug well stream, canals, imgation ctiannel)
Protected Spring Uttled water
Rntnwater collection
Table 1: Improved and Unimproved Drinking Water Sources (Adapted from MP
WHO/UNICEF 2010)
These standards are used to define Millennium Development Goal Target to halve the population without sustainable access to safe drinking water by 2015 (UNDP 2011). However, while these metrics are indicators of infrastructure improvements that may correlate with safe water, they are not truly indicative of the quality of the water being consumed, because pathogens or other contaminants can even be transmitted via
"improved" sources. The pathogens of concern include the bacteria, viruses, and protozoa responsible for causing cholera, typhoid, hepatitis, guinea worm, and other water-related diseases. Despite the international and national efforts to improve drinking water supply and sanitation in Ghana, diarrhea still accounts for 12 percent of all deaths of children under five, and Ghanaian children lose an average of 3.4 million school days annually because of diarrhea-related diseases (WHO 2006, WaterAid 2008).
In fact, Fewtrell and Colford published a ground-breaking World Bank study in 2004 suggesting that improvements in water quality, specifically point of use treatment (POU), and hygiene education have a greater impact on reducing diarrheal disease than increased access to sanitation and water supply (Fewtrell and Colford 2004). Adequate water supply and sanitation are very important for improving health, and reducing both the time spent and physical burden of carrying water from distant sources. However, this study showed that water and sanitation "hardware" alone are not sufficient, and that other approaches to reduce diarrheal disease need to be explored, validated, and funded (WHO 2006).
In 2003 and 2004 Clasen, et. al., published two studies demonstrating that contamination often occurs during collection, transport, and storage of drinking water from improved sources and emphasized the importance of point of use interventions, such as household water treatment and safe storage (HWTS), to improved health. (Clasen et al 2003, Clasen et al 2004). Below, Table 2 shows performance comparisons of various household water treatment options.
colodl"
Lab Studio$ Fi*1d Studi0 ~D0Z~X~ ~ A~cipt~ ~1~3ht~ ~r~poc~? or'? ~Ase's? Q~&rK~on 'V'~d urn ~oSon~ Fdiroiion N~h F i~4on U4ncw~
Solo; Dnkoov igki
Mei u H igh No Yes Yes g Ne way wA 6gb Scie Snge Y Y ,4 4es U',kncw C~sc~n~ C~kwe Y05 Y&S and no c Unknown and -e-oia sc~
Table 2: Household Water Treatment Comparison (Lantagne et al 2006)
. g L'
A more recent meta-analysis by Waddington and Snilstveit challenges the research of
Fewtrell & Collford and Clasen & Barnstable by highlighting the importance of sanitation "hardware" in reducing diarrheal disease and morbidity over time. According to their study, when long-term studies of 12 months or longer are compared, sanitation hardware has a significant impact advantage over point-of-use water treatment in reducing diarrheal morbidity. They found an inverse relationship between HWTS efficacy and the length of time from installation. However, they also find that household water supply and POU water supply interventions, such as household standpipes or piped water connections or, tend to be more effective than source water supply and source water treatment interventions. Waddington and Snilstveit emphasize that they are not advocating one intervention approach over another, and that local context best determines which intervention is most suitable in a given situation. However, they do challenge the dominant consensus that POU water treatment and hygiene interventions are more effective than sanitation hardware interventions (Waddington and Snilstveit 2009).
A further challenge comes from Schmidt and Cairncross, who argue that scale-up of HWTS
may be premature given the lack of conclusive evidence on the effect of household water treatment on diarrheal reduction. They assert that current evidence that links HWTS to reductions in diarrheal disease does not take bias into account, and therefore, double-blinded studies are needed to definitively prove the efficacy of HWTS interventions
(Schmidt and Cairncross 2009)
Other evaluation criterion not mentioned in Table 2 but with relevance to Northern Ghana include cost and effectiveness with highly turbid water. Cost is critical in determining the effectiveness of treatment because consumer ability and willingness to pay will often dictate the scale a given intervention can reach. In rural parts of northern Ghana, the average annual income is estimated at US$442 or about US$1.2 per day (Greene 2009); cost is going to be of vital importance in determining feasibility. Additionally, it is not unusual to find extremely turbid water with 1,000 to 2,000 NTU in Northern Ghana. Given this high level of turbidity, the effectiveness of a filtration system over time will determine whether it can compete with other methods in terms of sustained positive health impact.
Cost and accessibility can potentially be enhanced when products are made and supplied locally. Pure Home Water is committed to local manufacturing as a part of a strategy for producing and selling ceramic water filters at a low enough price point to achieve its mission of providing safe drinking water through HTWS.
1.2 Water Resources and Access in Ghana
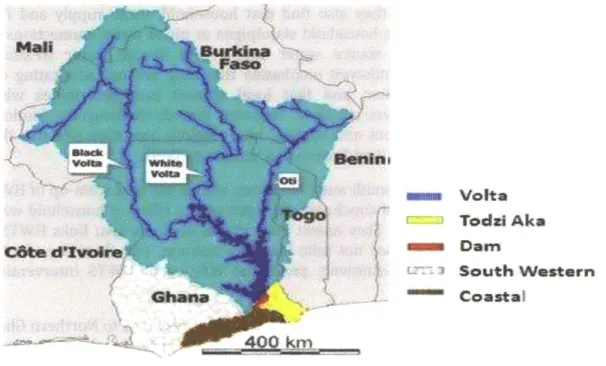
The Volta basin, the largest river system in Ghana, is made up of the Black and White Volta sub basins, the Oti River, and the lower Volta, and drains 70% of the country's total land
area (Figure 2). The remaining 30% of surface water resources are provided by the southwestern, and costal river systems (not depicted).
Most of Ghana's central and southern regions have two rainy seasons from April to July and September to November while the north is a semi-arid region that has one rainy season per year (Obeng-Bekoe, 2010). Annual rainfall in Ghana varies regionally with the southernmost part of the country receiving an average of 2,100mm/yr and gradually declining to an average of 1,100 mm/yr in the north (Obeng-Bekoe, 2010). This is
Vona= Volta
Todzi Aka
Cabe dl mnaa Dorn
L South Western
Ghana " Coastal
Figure 2: Major Basins and Sub-basins of Northern Ghana (Obeng -Bekoe, 2010)
significant given that only an estimated 0.2% of y X_3
cropland in Ghana is irrigated under public or IR t, '1
informal irrigation schemes (Earth Trends 2003). The problem of water scarcity in the north, therefore, has an impact on water availability for drinking and sanitation, as well as productive purposes, pressuring people to compete with plants and animals for this vital resource. Water
vulnerability is compounded in the north by
extreme variability as well as a gradual trend of an average annual decline in precipitation of about 1.37mm/yr (Amekudzi, 2010)
YONf
Figure 1: Annual Rainfall in Northern Region
Water access in Ghana is provided primarily by surface and groundwater with little access to piped water supply. Twenty percent of the country's population rely on unimproved water sources such as water from the river systems, in addition to open dams known as "dugouts" because they have been "dug out" of the earth in an effort to collect and store rainwater during the rainy season in order to provide a daily water supply for washing, cooking, drinking and productive use (WHO 2010). In the Northern Region, this figure is much higher with 50% of the population relying on unimproved sources as the main water supply (Ghana Statistical Service 2004). The Ghana Water Resources Commission estimates that there are over 10,000 boreholes countrywide while Water-Aid, a UK-based
NGO, estimates that NGOs have partnered with the government to implement 14,000
drilled boreholes with hand-pumps, 12,000 hand-dug wells with hand-pumps, and 800 small piped systems for rural water supply (WaterAid 2008). Piped water supply is limited with an estimated 30% of urban residents and 3% of rural residents connected to piped supply (WHO/UNICEF IMP 2010). An overview of 2010 countrywide statistics on urban and rural water supply is shown below.
Improved Piped Connection Other Improved Unimproved
Urban 90% 30% 60% 10%
Rural 74% 3% 71% 26%
Total 84% 13% 71% 16%
Table 3: Improved and unimproved water sources in Ghana (Adapted from WHO/UNICEF
JMP
2010)1.3 PHW Organizational History
Founded with local partners by MIT Senior Lecturer Susan Murcott in 2005, Pure Home Water (PHW) is a non-profit organization in Ghana whose mission is to provide safe drinking water to people in Northern Ghana. The organization's goal is to be a self-sustaining non-profit that is able to sell enough water treatment systems and related products to cover its costs. Early student teams from MIT conducted research on HWTS performance, consumer preferences in water treatment techniques, and willingness to pay in order to find the best systems for the region. After also considering bio-sand filters, ceramic candle filters, chlorination systems, and solar water disinfection (SODIS), PHW determined that ceramic pot filters (CPFs) with safe storage containers promised the simplest and cheapest method to effectively clean water in Northern Ghana at a household scale. From 2005-2009, PHW focused on distributing CPFs that were made in Accra, Ghana, teaching people how to use them, and monitoring how effectiveness and durability over
time. PHW chose the Kosim water filter because it is effective in removing E. coli (Johnson et al 2008), has been shown to be linked to the reduction of cases of diarrhea (Johnson et al 2008), can be manufactured almost entirely out of local materials, and is culturally appropriate given that water in Northern Ghana is generally stored in large clay vessels (Watters, 2010).
1.4 PHW Factory
Reason to Build the Factory
As PHW grew, shipping filters from Accra became less efficient. Initially, many filters were broken on the trip from Accra to Tamale. Over time, PHW had trouble with the supplier providing pots behind schedule and with inconsistent quality. In order to eliminate these problems in the supply chain and to better serve Northern Ghana, PHW began constructing its own factory in Tamale in late 2009. While the construction of the building is still ongoing the factory has the molds, supplies, and kiln necessary for production. In January of 2010, a four-person team of MIT students began work on developing a set of best practices in filter production for the factory. Reed Miller and Travis Watters recommended clay recipes based on the flow rate and durability of test filters made with different proportions of combustible material and clay. Preliminary pot production in the summer of 2010 resulted in pots that were too brittle to be sold. Further work and research has been carried out by the 2010-2011 MIT Ghana team, local management and staff, and Manny Hernandez. The factory currently has orders pending from NGO groups to supply filters for Northern Ghana. Before meeting these orders, quality controls are being established in order to ensure that quality production is achieved.
Rammed Earth Blocks and Factory Business Model
Early attempts to sell Kosim filters at their true production price were unsuccessful because the $18 price of the system was well above the willingness to pay of rural families, particularly the more vulnerable, rural households that PHW aims to serve. In order to meet its goal of being self-sustaining PHW is testing out the financial feasibility of selling select construction materials-- earth blocks, concrete blocks, and fire-bricks-- as a revenue stream to subsidize Kosim filters for rural families. PHW currently owns standard rammed earth block molds and produces these earth blocks for its own factory construction, but has not yet developed a point of sale for the blocks or contracts with other vendors.
Key Areas of Support Needed
At this stage in the factory's development, PHW needs support in a few key areas: Development of new HWTS and/or water/sanitation/hygiene products to attract a larger consumer base; materials research to ensure standard clay composition and firing; water and wastewater recycling infrastructure; and a review of quality control protocols as part of the larger effort to standardize CPF production processes. In terms of quality control protocols, PHW has considerable experience in Ghana with HWTS and ceramic pot filters, and is an associate with the Ceramic Filter Manufacturing Working Group, which recently
released Best Practice Recommendations for Local Manufacturing of Ceramic Pot Filters for Water Treatment (Ceramic Manufacturing Working Group 2011).
1.5 Ceramic Filter Manufacturing
Ceramic filters are available around the world in different forms: candle filters, disc filters, and ceramic pot filters. Many of these products are enhanced with colloidal silver or silver nitrate. The type of filter that Pure Home Water manufactures is the colloidal enhanced ceramic pot filter. In total there are about 35 operational filter factories in 18 countries producing the colloidal silver enhanced pot filter (Rayner 2009).
The filter was originally developed by Dr. Fernando Mazariegos in Guatemala, and later, beginning in 1999, standardized and disseminated by Ron Rivera of Potters for Peace
(PFP). In 2010, the Ceramics Manufacturing Working Group (CMWG) published a study on the Best Practices for Ceramic Filter Manufacturing, which surveyed 25 CPF factories on their production and quality control procedures. Based on an extensive literature review and survey results, they produced best practice protocol and standardization recommendations for existing and future factories.
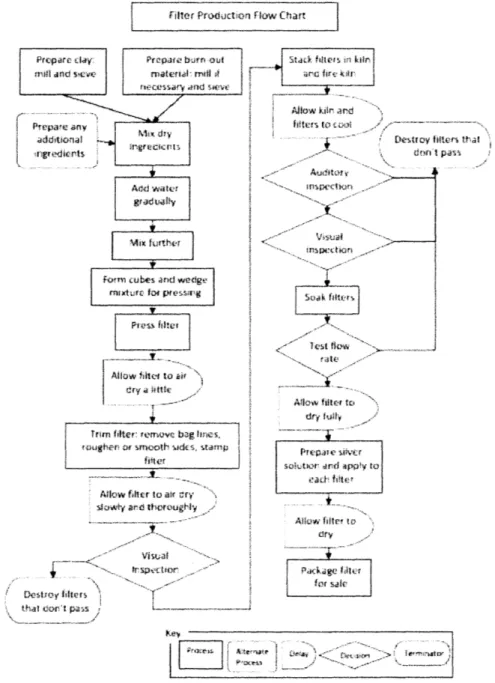
Manufacturing the filter is a multi-stage process that requires quality checks and standardized procedures at each step. The production process can broadly be broken down into the areas listed below adapted from the CMWG manual. A more detailed flow chart from the CMWG manual can be found below in Figure 3.
>
Sourcing material>
Mixing clay & burnout material>
Pressing clay into filter pots>e
Trimming pressed filters>
Drying> Firing
>
Quality Controlo Flow rate testing
o Visual and auditory inspection o Pressure (crack) tests
o Bacteriological testing
>
Applying Silver>
PackagingThe goal of PHW is to get production capacity up to 350 filters per month by the end of the 2011, but actual production will be determined by retail customer demand and wholesale contracts. Maximum capacity is currently limited at 75 filters per day based on kiln capacity. However, reaching that level is dependent on having certain mechanized equipment (mixer, hammer-mill, pug-mill), which are currently not available and need to be build or procured (Getachew 2011). Two important factors in reaching this scale will be
improvement and standardization of quality control procedures, as well as the construction of a water storage and recycling system for production and employee use. Implementing quality control procedures will enable PHW to produce quality filters, which will build the company's brand while saving both time and money. At the same time, the water storage and recycling system will help Pure Home Water conserve their water for reuse in the
Kosim production process and improve the working environment for all employees. Filter Prodoction Rkow Chart
Prepae any
additional
ngrederts
Allow *or o ank
lrrters to eto Ilns fire kxar
Auitor~ petiont
Forn cubes and wedge rmxturi fot pressmg
prvso- filter
Allow fit 't to ai
Trim filter: remove bag ntfrios roughen of smooth -odes, Starnp
Allow fifer to air Cry
slow y and thVrouglvy
that- I ftportio
-Ma fer tct
A itpte lito N
soiL-tior -wjrd A IV~ to3
Arrow hlref to
drV
N.KkJdkc fille
Figure 3: Ceramic Filter Production Chart (CMWG 2011)
Destroy ffters tht'
den i pan'
Lit* < J
1.6 Research Methodology, Structure, and Work Objectives
The main purpose of this work is to help Pure Home Water use their water resources as efficiently as possible and to improve flow rate testing procedures in the PHW factory. These goals were approached through application of the recommendations from the CMWG best practices manual and engagement with a team of experts, including PHW staff and PHW consultants, Manny Hernandez, and Curt and Cathy Bradner.
Participant observation was another significant element of the fieldwork conducted in Ghana. During January 2011, the author collaboratively designed, documented, and participated in water infrastructure construction at the PHW factory. We began the construction of one rainwater storage tank in January and it was completed in April 2011, with the plan to build multiple water storage units for harvested rainwater as finances permit. In addition, we constructed a saturation tank for soaking filters prior to flow rate testing. These two tanks will be connected so that it will be possible to recycle water used in the saturation tanks and the flow rate tests, thereby conserving water and reducing PHW's operating costs.
Flow rate testing procedures were documented during January with further improvements and documentation by PHW consultants Curt and Cathy Bradner in March and April 2011. This thesis compiles the lessons learned from tank construction and flow rate procedure work in January, and incorporates the latest quality control improvements and recommendations for standardization from Curt and Cathy Bradner. Together these projects intend to contribute to the improved efficiency and quality of PHW Kosim Filter production and to enable the organization to scale up for increased sales and distribution. Beyond the PHW factory, documentation of the process of building a large capacity (30m3) underground water tank will be useful to other organizations or businesses with water storage needs.
The thesis can be divided into two main parts: chapters 2 and 3 cover water storage, including a review of the literature on storage tank construction and then a discussion of the construction undertaken at PHW; chapters 4, 5 and 6 cover one aspect of quality control, namely flow rate testing, with a discussion of the literature and then a detailed look at results from testing at PHW. Chapter 7 concludes the thesis with synthesis and discussion.
A central objective of this project was to create a practical document that both provides a
record of the water storage design and construction process at the PHW factory, and that documents the iterative process of establishing a new filter factory committed to quality assurance. The author's observations and recommendations are provided as fuel for future areas of research and organizational advancement.
2 Literature Review: Water Storage 2.1 Tank Design: Material, Shape, Placement
Tank placement, shape, and materials are critical to constructing a water storage tank (cistern) that will be effective for a long period of time. More specifically, the following elements should be carefully considered:
>
Materials efficiency>
Structural integrity>
Materials availability>
Local construction expertise.> Aesthetics
(Ludwig 2005a, Gould and Nissen 1999)
Materials efficiency is the ratio of material used to construct the cistern to the volume of
water enclosed, which is important in reducing both cost and consumption of natural resources. Structural integrity is calculated in order to avoid water leakage, safety hazards, and/or wasted investment from a poorly constructed tank. Designing a tank according to materials availability and local construction expertise can help avoid
wasted materials and ensure a structurally sound tank. If the tank is not designed to withstand internal and external forces, varying weather, and inconsistent use conditions, the tank will have a high likelihood of failure, regardless of the skill or experience of the builders, (Ludwig 2005a). Tanks should be constructed using conservative calculations that include an appropriate safety factor for failure. In flood zone areas, a safety factor of about
1.25 can be used to protect against uplift (Gougen and Thronton 2010). In addition to
practical usage considerations, tanks do not need to be ugly or obtrusive in their natural or urban environment. Aesthetics is a worthwhile factor in determining tank placement, size, and shape (Ludwig 2005a).
Tank Shape
From a structural and materials standpoint, a spherical or egg shaped tank is most efficient. However, depending on the tank size, available materials, and construction expertise, the most suitable tank shape for a given project may change (Ludwig 2005a). The Portland Cement Association recommends that beyond the bottom and top of the tank, joints should be avoided wherever possible, as this is where leaks are most likely to occur. Ludwig and Gould & Nissen recommend avoiding rectangular tanks and tanks with sharp corners because they are less effective in both materials efficiency and structural integrity, while
USAID suggests that rectangular tanks are appropriate in some circumstances but should
tanks as the most practical shape for tanks holding water of over Oim3 holding capacity (Ludwig 2005, Gould and Nissen 1999, USAID 1982)
Building Materials
Water tanks can be built out of a number of materials including, ferro-cement, galvanized steel, stainless steel, rocks and mortar, concrete, bricks, low toxicity plastics, clay, and a combination of masonry in and over plastic (Ludwig 2005a). Concrete construction can be divided into three main methods; ferro-cement, cast concrete, and concrete block. Ludwig and Gould focus on ferro-cement tanks as their design of choice because of structural integrity, ease of construction, and low comparative materials cost. However, Ludwig, Gould, the University of Warwick, and USAID all accept masonry as a viable option when working with experienced builders. They caution that masonry has a tendency to leak and has trouble withstanding pressure forces, so these types of tanks must be reinforced and sealed with cement stucco or another type of water proof liner (Ludwig 2005, Gould and Nissen 1999, USAID 1982).
Placement
Water tanks can be built above or below ground. Advantages of in ground or partially buried tanks include cool water year round, improved taste and quality, little or no evaporative loss, structural support from the surrounding soil walls, preservation of above ground space, overall aesthetics, and reduction of the risk of accidental drainage. (USAID
1982, Ludwig 2005) Disadvantages of underground tanks include greater difficulty with
repairs, inspection, and cleaning; they are more structurally challenging to build; and gravity feeding is not possible so water must be pumped out mechanically. Moreover, surface water and shallow ground water can contaminate a tank if seepage occurs (Ludwig 2005).
Ludwig recommends siting tanks with elevation, soil stability and ground slope, security, and aesthetics in mind. Elevated tanks can be an advantage because they allow water to be gravity fed. If elevation is an option, the tank placement should be designed with the spatial layout of water use in mind to avoid common design errors like pumping water downhill (Ludwig 2005). It is best to build tanks in or on "native" soil, meaning soil that is undisturbed and freshly excavated. Building on tilled soil or fill can be hazardous because the soil may not support the weight of the tank causing it to sink, slide or lift. Similarly building on sloped land requires extra analysis to ensure that the tank does not slide down the hill (Ludwig 2005). Security is comprised of both structural security and water quality. Placing tanks away from potential hazards like falling trees or other hazards such as chemical and microbial contamination sources is also necessary (Ludwig 2005a).
2.2 Tank Design: Common Tank Features
Acceeo Vent
Inlet
Max etorage level
Owr(1ow
Outlet ghut -off valve L
Low level ote
Sloped floor mns p
Figure 4: Common Tank Features (Ludwig 2005)
Ludwig (2005), Gould (1999), and USAID (1982) recommend the following tank features in order to avoid some of common problems with water storage.
> Inlet
>
Outlet>
Drainage at base of tank>
Impermeable reinforced concrete cover>
Service access>
Overflow pipe>
Screen to keep out rodents and insects>
Air vent>
Protection from the sunInlet
Placement of the inlet depends on the location of the water source. If the water source is gravity fed to the tank, then it can be placed in the roof dome. In rainwater harvesting systems the inlet can be connected to a first-flush device, which flushes waters from the first rain in order to allow dirt and possible contaminants to be diverted from the storage unit (Ludwig 2005 and Figure 5). When the inflow is conveyed from the roof, it is important that there is a sufficient angle from the roof to the tank in order to prevent
If these losses are accurate, a tank of 60M3
is too large, unless extra capacity for the storage of tanker water is desired. After design adaptations and modifications, we built a tank with a capacity of about 27 M3
. Currently, there is no production of CPFs during the rainy
season and consequently, no water withdrawals from the tank during the three-month rainy season. PHW should therefore be able to assess if the rough estimate of 2mm/day of evaporation is an over or under estimate based on whether the tank fills to capacity during that time.
Construction Method and Costs
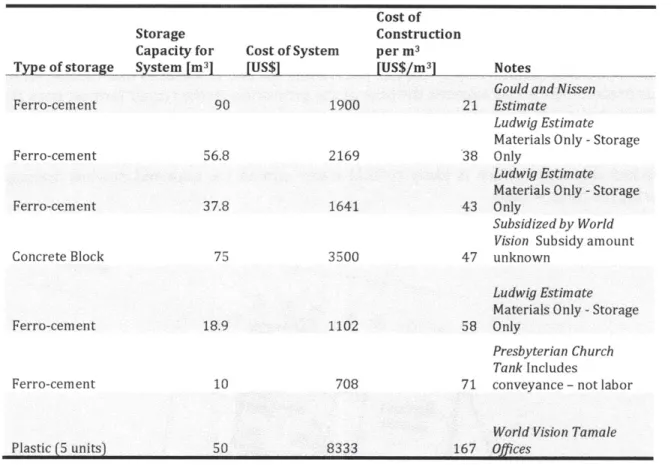
In his 2009 survey of rainwater harvesting systems in Tamale Ghana, Barnes did a cost comparison of tanks built in the area, finding examples of plastic storage tanks, ferro-cement tanks, concrete block tanks, as well as informal storage systems. The plastic storage option had the highest costs at USD$100-125/m 3, whereas most of the storage options
surveyed had a construction cost of between USD$71-$167/m 3 of storage capacity (Barnes
2009). While storage costs for a large capacity RWHS are high, it will allow PHW to reduce
the amount of money spent on purchased of water. Currently PHW is paying USD$28-35/m 3 for the purchase of trucked water.
The three most viable storage options available locally included plastic tanks, ferro-cement tanks, and concrete block tanks. Plastic tanks were excluded because of the prohibitive cost for the large 60 m3
(15,850 gallon), storage capacity needed for the PHW water
factory. The examples of concrete block tanks constructed in the vicinity cost $3,500 for 75
M3 (USD$46.6/m 3
) including conveyance, hardware, and labor. However, these $3,500 tanks were subsidized by the NGO, World Vision, and the amount of subsidy is unknown. Therefore, it is difficult to assess the actual price/m 3
of water. The Presbyterian Church of Tamale builds 10m3
capacity ferro-cement tanks which cost $708 (USD$70.8/m 3),
including conveyance, but excluding labor costs, which in their case, is often provided by the community in which the tanks are installed (Barnes 2009). Ludwig (2005b) estimates the cost of a 56,000 L tank to be about USD$38/m 3, although his estimates are
approximate, excluding labor and not calculated using Ghanaian material prices (see Appendix B), while Gould and Nissen (1999J estimated large capacity underground ferro-cement tanks to cost approximately USD$21/m 3.
Despite lower cost estimates for larger ferro-cement tanks, the choice was made to use concrete block construction because we knew of no local contractors with experience building large ferro-cement storage units (above lOm3), and so both the ferro-cement tank construction method and cost savings were only theoretical, whereas there was tangible local knowledge in working with concrete block for tanks over 10m3. We also considered using poured concrete and forms instead of blocks to build the walls, but again, while poured concrete is a commonly used method to build water tanks in many parts of the world, there were no local resources that we were aware of in and around Tamale. Concrete block, on the other hand, is readily available in Tamale, and the local masons are familiar with concrete block construction.
Cost of
Storage Construction
Capacity for Cost of System per m3
Type of storage System [m3
] [US$] [US$/m 3] Notes
Gould and Nissen
Ferro-cement 90 1900 21 Estimate
Ludwig Estimate Materials Only -Storage
Ferro-cement 56.8 2169 38 Only
Ludwig Estimate Materials Only -Storage
Ferro-cement 37.8 1641 43 Only
Subsidized by World Vision Subsidy amount
Concrete Block 75 3500 47 unknown
Ludwig Estimate
Materials Only -Storage
Ferro-cement 18.9 1102 58 Only
Presbyterian Church Tank Includes
Ferro-cement 10 708 71 conveyance -not labor
World Vision Tamale
Plastic (5 units) 50 8333 167 Offices
Figure 12: Cost comparisons of different tank types common (Barnes 2009; Ludwig 2005b; Gould and Nissen 1999)
in Tamale, Ghana
Tank Design and Adaptation
The tank was initially designed to be a rectangular concrete tank, however, after discussion and basic force calculations on uplift using the "Tank calculations" tool from (Ludwig
2005b) on tank design, we found that the cylindrical tank had a slightly better safety factor
against uplift (1.17 vs. 1.35)(see Appendix A). Based on the literature review for this thesis, the author did rough designs for the inlets and outlets, but most of the tank design for the foundation and reinforcement happened on the ground and in the sketchbook of PHW factory consultant Manny Hernandez. Tank design was a collaborative process. The foundation and the initial design for reinforcement was the work of Manny Hernandez and the author, with the input of other engineers on site: Mary Kay Jackson, Joanna Cummings, Mitchell Westwood, Susan Murcott, and Chris Shultz. As Manny's other factory construction responsibilities took precedence, the decision was made to contract a local RWHS expert, Frank Kuma, who assumed project management responsibility for completion of the RWH tank after the initial design and during foundation construction. Frank Kuma contributed design evaluations, modifications, as well as construction oversight and management based
on his experience as a contractor for water infrastructure projects and his previous work building concrete block tanks. To increase the safety and stability of the tank, we decided on a 1ft deep reinforced footing under the wall, and a 6-inch overhang, which would extend beyond the wall. In addition, Frank Kuma and Manny Hernandez recommended that the blocks be turned to sit on the 9 inch x 18 inch surface for the underground portion of the tank to increase stability. After the site excavation, we also discovered that the soil strata was predominantly clay towards the base of the excavation on the corner farthest from the factory, and predominantly laterite on the corner of the excavation closest to the factory. Frank suggested that we place the cylindrical tank towards the factory side closer to the laterite soil and away from the clay to protect against leakage into the tank from the cracked clay layer, which is likely to hold water around the tank and prevent drainage during the rainy season.
Section 2
Site Location for Underground Water Tanks(s) For Rainwater
Harvested & Tanker Truck Water
Section 4
0 S 10
The Shrinking Tank -A Cautionary Tale
While the initial tank was designed to accommodate 60 m3 of water, the final tank can hold
about 27 m3, less than half of that the original calculations.
The 1st reduction: The tank began as 15 x 20 x 8 feet; the first reduction resulted from the excavation of the rectangular hole in advance of the design, which set certain constraints. The difficulty of hand digging though laterite and clay and the 3-week schedule in Ghana meant that whatever shape the tank was, it would be confined to fit within 15 x 20 feet. The 2nd reduction: When the team decided that, for structural reasons, the tank should be cylindrical, this meant that the maximum possible tank outer radius was 7-feet 6-inches. To compensate for the loss in cubic feet of storage, we increased the tank height to 10-feet. Still, this change reduced the capacity by 33%, from 60,258L to 43,568L.
The 3rd reduction: The next decision was that a 6-inch footing (a reinforced foundation that extends beyond the outer radius of the wall) would provide extra stability and security against uplift forces, as well as space for masons to work on the outside of the tank from inside of the hole. The original rectangular design allowed for a 6-inch footing while still achieving 60,OOOL capacity. The footing on the cylindrical tank, however, reduced the outer radius of the tank to 7-feet and the holding capacity a further 14%, to 37,565L.
The 4th Reduction: The decision to turn the blocks on the long edge, so that the space from the exterior to the interior of the wall was 18-inches, resulted in another large reduction. While we originally allotted for 6-inches of the radius to be taken by block thickness, now blocks occupy an additional 12-inches of space. This was the correct decision for sound tank design, but reduced the inner radius to 5-feet 6-inches and storage capacity by 28%, to
26,897L.
In total, the tank capacity was reduced to 55% of the original design. Because this was a process that was unfolding on the ground with workers already hired, materials already purchased, and a time frame of 3 weeks to get the project underway, it's difficult to imagine that any of the decisions would have been made differently. They were the correct decisions in the moment and the logical next steps in a process that was already initiated, but, because these decisions were determined on the ground, we didn't have time to analyze their impact on our larger goal of providing storage for half of PHW factory's productive needs. The implications of this are that we ended up with a tank that was smaller than it otherwise would have been if we had anticipated some of these choices in advance. On the other hand, we ended up with a tank that was designed based on the best decisions taken under the pressure of time.
Construction Schedule
The construction of the rainwater tank is complete as of April 2011. The following is the construction schedule:
Nov/Dec 2010 -Excavation: Workers at PHW excavated the pit for the rainwater tank. The
excavators used pick-axes and head pans to dig and clear the material from the pit. It took
January 2011 -Foundation
February 2011 -Walls and Roof
March and April2011 -Inlets, Outlets
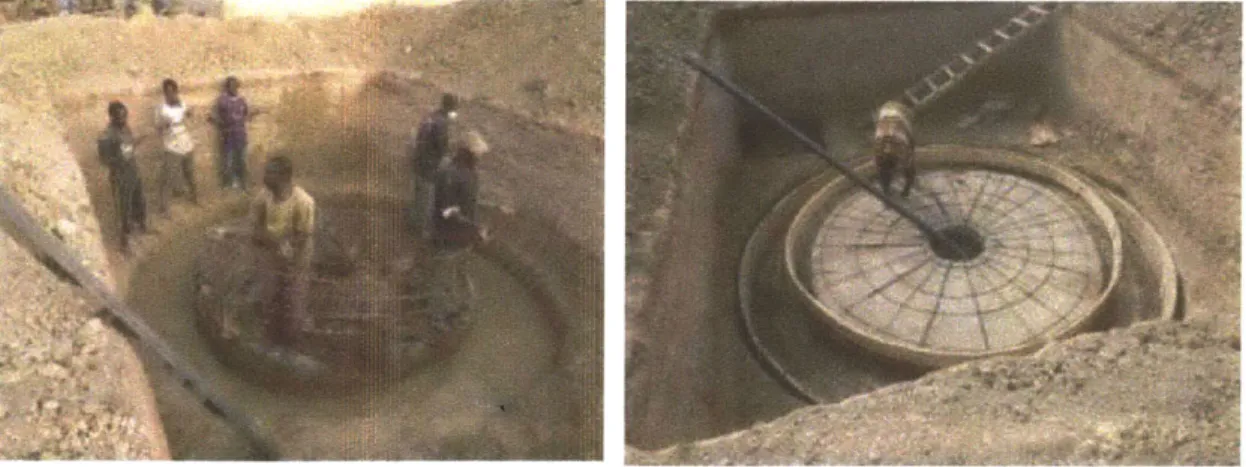
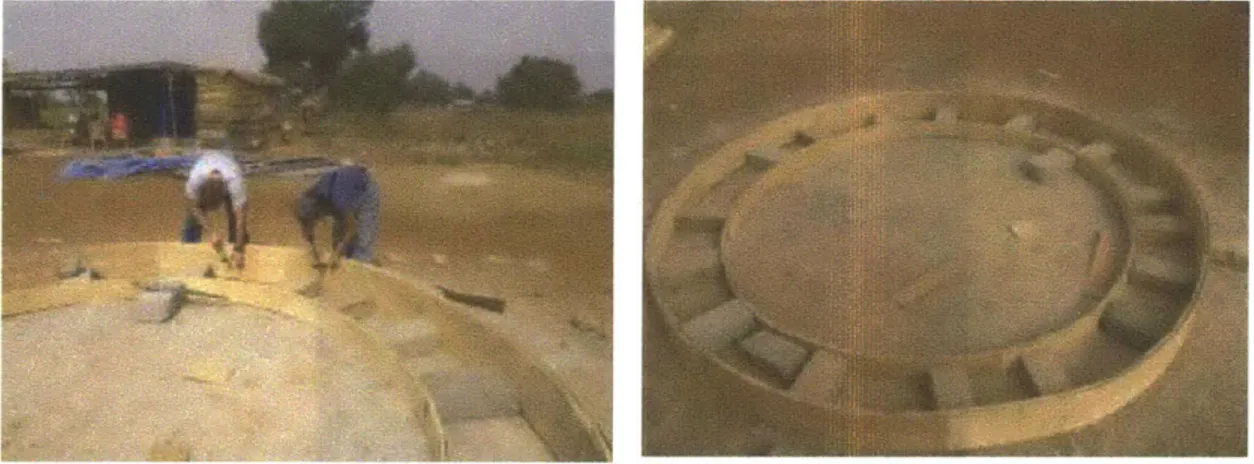
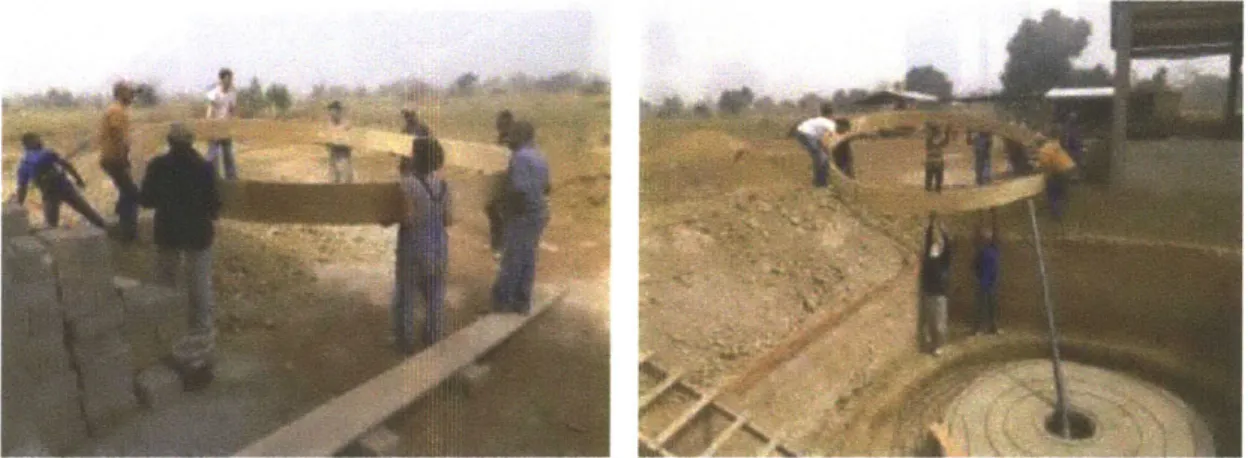
3.2 Building the rainwater harvesting tank foundation: Picture Log
Figure 14: Hernandez and Kleiman Figure 15: Using pic-axes to break up measuring radius of tank inside of the ground and dig the tank footing excavated pit
Figure 16: Footing and center hole dug
and ready for 2-inch base layer center pole hole.
Figure 17: The mason applies a
2-inch base layer (1:3 cement to sand ratio) to the bottom of the footing, tank base
Figure 18: 2-inch base layer applied
Figure 19: This layer was kept moist with wet
burlap bags for two days while it dried
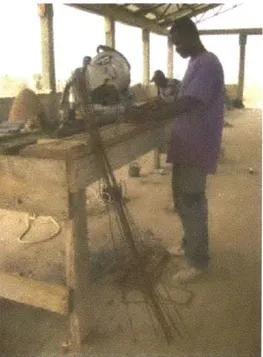
--Figure 20: The steel bender bending
1/2 inch rebar
Figure 22: Close up of the jig used
by the steel bender to bend rebar rod
Figure 21: Close up of rectangular
pieces that binds concentric circles of rebar together for the footing
Figure 23: Frank Kuma explains the design for reinforcement
Figure 24: Rebar reinforcement Figure 25: The steel bender links
lifted down into excavated area for reinforcement for tank floor with
the footing reinforcement for footing
Figure 26: The steel bender begins radial
Figure 27: Mitch Westwood kerfs planks of wood for the formwork
Figure 29: Shanti Kleiman and Mitch
Westwood patch up the circular forms after bending the wood into a circle
Figure 28: Shanti Kleiman and Zachary
nail plywood to the kerfed boards
Figure 31: Carrying the outer form over to the excavated site
Figure 32: Lowering the outer form
over the center-pole and around the rebar reinforcement
Figure 34: Lowering the inner form
Figure 35: Raising center pole
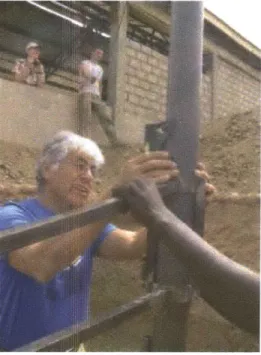
Figure 36: Securing and
positioning pole exactly at tank center using a level and 4 cables
Figure 37: Using rotating arm on the
center pole to ensure accurate placement of the inner form. Cutting a hole in the outer form for the placement of a 4 inch PVC outlet and drainage pipe
Figure 38: Roof support pole
raised and centered. The steel bender continues work on rebar reinforcement
Figure 39: Stone chips are delivered Figure 40: Water is delivered for for use in the foundation cement mixing the cement for the
mixture foundation
Figure 41: Pile of cement, sand, and
aggregate (1:2:4 ratio) ready for manual mixing
Figure 42: Foundation pouring happens
one head-pan at a time. Westwood stands on the stairs ready to pass down another head-pan full of cement to Sadat, who passes to Mr. Kuma, to pour into the foundation
Figure 43: The team works from 9am
until 9:30 pm, using the head lamps of Mr. Kuma's truck as work lighting
Figure 45: Finished Foundation
Figure 44: The forms are removed the
next day
Figure 46: Finished foundation is covered
with wet burlap sacks to keep it moist while concrete dries
Figure 47: Post-January work: Wooden roof supports inside of tank
Figure 48: Post-January work: Tank walls are plastered
with stucco
3.3 Building the tank: Results
After tank completion we ended with a tank of 26,897L capacity with a cost of GHC
$6108.46 (USD$4183.80, or a cost of USD $155/M3. The cost per cubic meter is
approximately the same as the plastic storage option and higher than other local options. However, the concrete block tank should have a design life of 20-30 years, whereas a plastic storage tank has a design life of only about 10 years due to UV and weather degradation. Therefore, there may be a clear advantage in the long term of investing in concrete tank storage rather than plastic storage. The decision matrix below is based on the cost of construction of the PHW concrete block tank during January-April and the costs of known alternative options to concrete block tanks in Tamale. Note that it is possible that a lower cost could be secured for the construction of the concrete block tank depending on contractor and materials procurement. A next step for PHW will be to inquire with World Vision about their concrete block tank costs, whether they include labor, and to whom they contracted the construction work.
Tank Type Options Cost Product Life Supports Local Total Economy Plastic (10m3 x 3) * * * 3 Concrete Block * ** 6 (30m3) Ferro-cement (10M3 *** ** 8 x 3)
Table 4: Decision Matrix for Future PHW storage tanks -ranked *Fair, **Good, and
***Best.
Based on existing information, the author recommends that for the construction of additional tanks, PHW should consider contracting the Presbyterian Church to build ferro-cement tanks on the PHW factory site. It is possible that the Presbyterian Church can build tanks with greater than 1Om 3 capacity, which would have greater materials efficiency and
be lower cost than three 1Om 3 tanks. However, even if they cannot build large capacity
tanks, the cost per m3 of the 1Om 3 tank is 54% less than the current 30m3 concrete block
tank. If a concrete block tank is desired, the author recommends hiring a local contractor to see the project through from start to finish with a pre-drafted budget for materials and labor.
4 Literature Review: Flow Rate Testing & Removal Efficacy 4.1 Filter Mechanism and Purpose of Flow Rate Test
Flow rate testing is the most commonly used quality control parameter to determine filter efficacy (Rayner 2009). While a more definitive quality control parameter is microbial testing of filter effluent, microbial testing is generally expensive and requires a certain level of technical experience. Therefore, other proxies for water quality, such as flow rate testing, are used to test each filter before it goes to market. Out of 18 factories surveyed, 16 flow test 100 percent of their filters (Rayner 2009). Flow rate is important both as a proxy for water quality, and to ensure that the filter can provide enough drinking water per household, estimated to be 3 liters per person, per day for a family of six (Howard and Bartram 2003). To ensure sufficient water, the minimum acceptable flow rate recommended by PFP for a new filter is 1.5 to 2.5 L/hr (PFP website retrieved 3/19/11). However, there is research suggesting that maximum flow rate could be increased without compromising effluent quality (Bloem et al. 2009).
The Kosim and other CPF enhanced with colloidal silver remove harmful pathogens from water in two main ways. The filter acts as a sieve to remove protozoa and bacteria that are too large to pass through to the safe storage receptacle, while the colloidal silver acts as a bactericide that limits bio-film growth. The filter has not demonstrated efficacy at removing viruses (D. Van Halem 2009). See Table 5 for the size ranges of bacteria, helminthes, protozoa, and viruses.
Maximum flow rates vary depending on the holding capacity of the filter. Initially a flow rate range of 1-2 liters per hour was developed by PFP because the instructions for water disinfection on the 0.32 solution of silver Microdyn commonly sold in Nicaragua are to add one drop to 2 liters of water and wait 20 minutes. Ron Rivera, founder of PFP, determined that with a safety factor of three, 60 minutes for 2 liters of water, the minimum flow rate should be 1 liter/hour (Lantagne 2001a). Faster flow rates may indicate that there are cracks in the filter that compromise filter quality, the pore size is too large, and/or the water has not had sufficient time to interact with the colloidal silver. To achieve this flow
rate, PFP set a target pore size of 1 micron. While the actual pore size of the filter was found to vary between 0.6-3 microns (Lantagne 2001a) and 33-52 microns (Halem 2006), filters with larger pore sizes are still effective at trapping all protozoa and a significant portion of bacteria because other filtering mechanisms are at work (Lantagne 2001a; Halem 2006). The filtering occurs not only through mechanical screening but also through sedimentation, adsorption, diffusion, inertia, turbulence, tortuosity, chemical activity, and biological activity (Halem 2006). This is supported by research that showed a 46 percent reduction in diarrheal diseases among filter users versus non-users (Brown and Sobsey
Organism Disease Remarks Size Range
Bacteria 0.3-100 [im
Escherichia coli Gastroenteritis Diarrhea
Salmonella typhi Typhoid Fever Fever, diarrhea
Salmonella Salmonellosis Food poisoning
Heavy diarrhea,
Vibrio cholerae Typhoid Fever dehydration
Viruses 0.02-0.2 [tm
Gastroenteritis,
Enteroviruses (67 types heart anomalies,
including polio & echo) meningitis
Hepatitis A Infectious hepatitis jaundice, fever
Rotavirus Gastroenteritis
Protozoa 8-100 tm
Cryptosporidium Cryptosporidiosis Diarrhea
En tamoeba histolytica AmeFiasis Diarrhea, bleeding Diarrhea, nausea,
Giardia lamblia Giardiasis indigestion
Table 5: Commonly Known Waterborne
and Eddy, 1991)
Disease-Causing Organisms (Metcalf
4.2 Flow rate and removal efficacy
Performance studies of the filter element range widely in methodology. Of thirteen studies surveyed for this literature review, five studies were of new filters, twelve studies were of filters no older than 2-years, and one study, a longevity study, sampled filters of varying age. Studies range from n=1 filter to n=72 filters and vary from one time sampling to sampling over 6 months. About half of the filters studies tested the Potters For Peace "Filtron" filter from Nicaragua, while two studies tested RDIC's filter (Cambodia), one study tested Filter Pure's filter (Dominican Republic ), four studies tested Tamakloe filters (Ghana) distributed by PHW, and one study tested the PHW filter manufactured in Tamale (Ghana). Five of the thirteen explicitly explore the relationship between flow rate and efficiency, while the others investigate areas such as filter longevity, hydraulic modeling, comparison with other water treatment methods, performance of filters under field conditions, silver application, optimal ceramic filter composition, and knowledge of physical characteristics of the filters such as pore size distribution (Bloem et al. 2009; Duke, Nordin, and Mazumder 2006; Campbell 2005; Fahlin 2003; Klarman 2009; Lantagne
2001b; Lantagne 2001a; Miller 2010; Napotnik et al. n.d.; Halem 2006).
The performance of CPF in removing pathogens is generally measured by log(10) reduction values (LRV) for indicator organisms (Brown and Sobsey 2006). Log(10) reductions below
1 are unacceptable for treatment system performance (Brown and Sobsey 2011). The most
studies have also measured the removal efficiency of protozoan oocysts and MS2 bacteriophages (D. Van Halem 2009). LRV is calculated as a function of the influent and the effluent concentration of indicator organisms. Therefore, if the effluent has a non-detectable level of indicator organisms, the maximum log 10 reduction cannot be found (Brown and Sobsey 2006). Brown and Sobsey recommend taking log reduction value to be minima, while Van Halem and Bloem spiked the influent water with high levels of E.coli to ensure that there would be detectable levels in the effluent (Brown and Sobsey 2006; D. Van Halem 2009; Bloem et al. 2009). Despite the absence of the maximum log(10) reduction for most of these studies, the majority show a log (10) reduction between 2-3 and Van Halem achieves a log(10) reduction of 7 (D. Van Halem 2009).
The studies that specifically investigate the relationship between flow rate and removal efficiency do not show strong consistency in testing conditions, methods, or results. Klarman found that filter flow rates increased over the 5-week duration of the study. She also found that when filter flow rate increased above 1.7L/hr, TC removal dropped below
99% and that there was no clear correlation between flow rate and turbidity. Klarman's
influent water, however, had a 5-week average turbidity of 3.0 NTU, which is very low in comparison to influent used in other studies. E. coli levels in Klarman's influent were also too low to measure reductions (Klarman 2009).
Bloem, on the other hand found, that filter flow rate decreased rapidly over the 6 month duration of the study due to clogging. Although filters with a faster initial flow rate decreased more rapidly than those with a lower starting point, they still had a higher ending flow rate than the filters that started with a lower rate. Bloem also found that filters with initial flow rates of up to 7.2L/hr and filters with initial flow rates of 1.8 L/hr perform equally well in their removal efficiency for bacteria. The filters in Bloem's study that were dipped in silver did better at removing E. coli than un-dipped filters (3.05 vs. 5.9 LRV). Based on these findings, Bloem recommends investigating the impact of increased flow rate on removal efficiency (Bloem et al. 2009).
Lantagne studied n=4 filters in her flow rate and removal efficiency comparison, both before and after silver application in filters with flow rates ranging from 1-3L/hr. In pre-silver investigations, Lantagne found that 3 out of 4 filters remove E. coli and none of the filters removed total coliform or H2S producing organisms. In post silver tests, the E. coli in the influent water was not present, and therefore removal efficiency could not be tested. However, all 3 filters that advanced to this testing phase removed 100 percent of total and fecal coliform (Lantagne 2001b).
Van Halem tested filters from Nicaragua, Cambodia, and Ghana and used Delft canal water spiked with E. coli to obtain microbial reduction results. Van Halem recommends testing increased filter flow rates stating that the PFP recommended flow rate (1-2 L/hr at the time of Halem's analysis) is not enough for the water needs of a family and that filters with higher discharges (CT Ghana) perform as well as filters with low discharges (RDIC Cambodia) in the removal of micro-organisms. Van Halem questions the reliability of flow rate testing as an optimal quality control test because low discharge does not necessarily mean higher removal efficiencies, but it can indicate consistency of manufacturing procedures. She recommends a combination of the bubble-point test and audio check as
additional testing protocol. In addition, she states that the exact upper limit of flow rate must be determined at the production location in conjunction with standardization of the manufacturing procedure (Halem 2006, italics mine). Napotnik et al supports further field research on the relationship between flow rate and removal efficacy. All of the filters in Napotnik's study performed well at removing TC and F. coli, however the flow rates varied both between filter pair types and within each filter pair (Napotnik et al. n.d.).
In a 2009 paper, Halem argues that factories should consider eliminating the practice of silver dipping to reduce filter cost because the removal of sulfite removing Clostridium spores was equally effective with and without silver, retention of MS2 bacteriophages was better in filters without silver application, and the removal of E. coli K12 was found to be very high without silver application (D. Van Halem 2009). Filter flow rate depends on the quality of influent water, the hydraulics of the filtering element (shape, size, composition), the average pore size and consistency of pore size distribution achieved from the manufacturing process, the height of the water in the filtering element, and the frequency with which it is filled (Rayner 2009). Lantagne found that silver application does not affect flow rate (Lantagne 2001a). Because quality of influent water (both turbidity and organisms present), filter hydraulics, input materials, and the fact that consistency of manufacturing practices will vary widely from factory to factory, it is important to take the best practices guidelines as starting points for factory specific investigations in filter performance under local conditions (Halem 2006; Ceramic Manufacturing Working Group 2011).
N E.coli
- N Protozoan oocysts MS2 bacteriophages
Lantagne Fahlin Campbell van Halem Duke et al. (2001) (2003) (2005) (2006) (2006)
4.3 Flow Rate Procedure
In Rayner's 2009 study on the current practices in CPF manufacturing, of 18 respondents,
16 perform flow rate tests on 100 percent of their filters, and 15 soak their filters before
flow rate tests. The soaking time varies from 2-24 hours. Measuring methods also vary with nine factories measuring effluent and eight factories use a calibrated T-device to measure the amount of water filtered (Rayner 2009). Maximum acceptable flow rates and volume of filter element of each factory that responded to this portion of the survey are shown in the figure below.
Filter Flow Rates 6 4 3-.12 0-8 10 11 XX 6 71 11 9 8 10 8 7 xx 10
County and Fffar Capac#y (tras)
Figure 50: Maximum Flow Rates and Filter Element Capacity (Rayner, 2009)
Recommended practice is to soak filers for 12-24 hours in order to ensure both consistent
and maximum flow rates (Halem 2006; Hagan.
J.
M. 2008; Rayner 2009; CeramicManufacturing Working Group 2011). While both measuring effluent and using a T-device work, the T-device allows measurement without removal of the filter element from the bucket while partially full. In addition, it ensures that for testing purposes, the filter is being filled to the same level each time, which provides more consistent testing conditions. Nardo suggests that maximum flow rate can be measured in the first 15 minutes and multiplied by 4 to get the maximum flow rate per hour (Nardo 2005). This method would be representative of a maximum flow rate for a household that tops their filter up with water every fifteen minutes, but not of the flow rate in the first hour as the rate of filtration decreases as the filter empties. Rayner, RDI-C, and CMWG recommend taking measurements after an hour of filtration. The flow rate for all filters destined for distribution should be tested and recorded in a log that corresponds with the filter's unique
8 8 7 7.1 ... . .. . ... ..
identification method. After the filter elements are measured, the filters should be set out on racks to dry in preparation for silver application (Halem 2006; Hagan.