Received: 27 September 2002 Accepted: 25 February 2003 Published online: 9 April 2003 © Springer-Verlag 2003
An editorial regarding this article can be found at the same issue
(http://dx.doi.org/10.1007/s00134-003-1766-3)
Abstract Objective: To compare
two methods of assessing a change
in stroke volume in response to fluid
challenge: esophageal Doppler and
thermodilution with the pulmonary
artery catheter. Design: Prospective
study. Setting: Department of
Inten-sive Care of a university medical
center. Patients: 19 adult patients,
intubated and sedated, with a
pulmo-nary catheter and a clinical
indica-tion for a fluid challenge.
Interven-tions: Two examiners independently
assessed the effect of a fluid
chal-lenge on stroke volume and cardiac
output with esophageal Doppler.
Thermodilution performed by an
in-dependent clinician was used as the
reference. Between-method variation
and interobserver variability of the
Doppler method were assessed.
Measurements and results: There
were no differences in stroke volume
and cardiac output before volume
challenge when measured with either
of the two methods or by the two
ex-aminers using the esophageal
Dopp-ler. Despite a small bias between the
methods and the two examiners
us-ing the esophageal Doppler (overall
bias for cardiac output 0.3 l/min),
the precision was poor (1.8 l/min).
Conclusions: The esophageal
Dopp-ler method is a non-invasive
alterna-tive to the pulmonary artery catheter
for the assessment of stroke volume
in critically ill patients.
Measure-ment of stroke volume response to
fluid challenge using esophageal
Doppler shows substantial
interob-server variability. Despite the poor
precision between methods and
in-vestigators, similar directional
chang-es in stroke volume can be measured.
Keywords Cardiac output · Stroke
volume · Esophageal Doppler ·
Thermodilution · Volume challenge
Margareta Roeck
Stephan M. Jakob
Thomas Boehlen
Lukas Brander
Rafael Knuesel
Jukka Takala
Change in stroke volume in response
to fluid challenge: assessment using
esophageal Doppler
Introduction
Hypovolemia in patients in intensive care units (ICU) is
common. The assessment of volume status is not
straightforward and must often be based on
hemody-namic response to a fluid challenge. The response to
a fluid challenge can be assessed by observing changes
in stroke volume. While cardiac output measurement
using a pulmonary artery (PA) catheter (the
thermodilu-tion method) remains the standard in clinical practice
[1, 2, 3, 4], stroke volume monitoring with esophageal
Doppler provides an attractive, less invasive alternative
[5, 6, 7].
Esophageal Doppler was first introduced in the early
1970s and more recently has been successfully approved
for optimizing fluid management perioperatively and in
intensive care patients [8, 9, 10]. Although stroke
vol-ume measurement using esophageal Doppler is simple in
principle, several sources of error may interfere with its
clinical application. The aim of this study was to assess
the hemodynamic changes occurring after a clinically
in-dicated volume load, using both the esophageal Doppler
and the thermodilution method. Furthermore, we aimed
to assess the inter-investigator variability of the
esopha-geal Doppler method.
M. Roeck · S. M. Jakob (
✉
) · L. Brander J. TakalaDepartment of Intensive Care Medicine, University Hospital Bern,
3010 Bern, Switzerland e-mail: [email protected] Tel.: +41-31-6323916 Fax: +41-31-6329644 T. Boehlen · R. Knuesel Department of Anesthesiology, University Hospital Bern, 3010 Bern, Switzerland
Materials and methods
The study was approved by the Ethics Committee of the Canton of Bern, according to the Declaration of Helsinki. Since informed consent by the patients or the family was not considered possible due to the emergency clause, an independent physician was desig-nated to give consent.
Inclusion and exclusion criteria
The indication for inclusion in the study was the treating intensive care resident’s decision to give a volume challenge. The inclusion criteria were: age greater than 16 years; patient on mechanical ventilation and sedated; and pulmonary catheter (Edwards Life Sciences, Irvine, Calif.) already in place. The exclusion criteria were: need for an urgent volume infusion (volume load given within 15 min to quickly stabilize a hemodynamically unstable sit-uation); atrial fibrillation or flutter; relevant intra-cardiac shunt-ing; presence of an intra-aortic balloon pump; fluid requirement of >500 ml within the last 2 h or changing requirements of vasoac-tive drugs (>20% within the last 30 min); coagulation abnormali-ties (increased thrombin time, thrombocytes <100×103µ/l); and prior enoral or esophageal surgery.
Esophageal Doppler
The esophageal Doppler probe (Cardio Q, Deltex Medical Limit-ed, Chichester, UK) is approved for clinical use, and is routinely used in several institutions [11, 12, 13]. It is placed into the esoph-agus either through the mouth or the nose. The esophageal probe (90 cm length, 6 mm diameter) holds a 5.1-MHz Doppler device which sends out ultrasound signals at an angle of 45°. Based on the relation between emitted and reflected waves, the blood flow velocity of the descending aorta can be computed. Blood flow ve-locity is measured at a depth of 35–40 cm after the dental row. Placement is assumed to be correct if well-reproducible, sharply defined wave forms can be seen on the screen of the monitor.
Introduction of the method
The monitoring of an optimal Doppler signal depends largely on the examiner [14]. According to the manufacturer, reliable results can be obtained after five measurements (Operation Handbook, Deltex Medical Limited, Chichester, UK). In our department, all attending specialists (n=10) received a theoretical introduction and a practical demonstration of the method, and felt confident with the method within 8 weeks. The exact number of measurements performed to reach this goal was not registered.
Study protocol
The protocol is shown in Fig. 1. After the resident made the deci-sion for volume administration, the independent physician (a se-nior specialist of the Department of Anesthesia) rechecked inclu-sion and excluinclu-sion criteria. If appropriate, the patient was included in the study. The study coordinator (one of the co-authors) inserted the Doppler probe. The probe was placed into the esophagus either through the mouth or the nose to a depth of 35–40 cm from the dental row. The sensor was placed in an anterior direction. Correct placement was assumed when well-reproducible, sharply defined wave forms appeared on the screen of the monitor.
The monitor was connected, and two of eight attending spe-cialists not involved in the care of the patient were defined as ex-aminers based on availability. Stroke volume and cardiac output
were measured with the esophageal Doppler by the first examiner and then by the second. The study coordinator changed the posi-tion of the probe after the first measurement, so that the second examiner was blinded to the results obtained by the first examiner. After the Doppler measurements, the treating resident measured cardiac output with the thermodilution method using a cardiac out-put monitor (Vigilance TM, Baxter Lab, Santa Ana, Calif.). There were four randomly assigned measurements over the entire respi-ratory cycle using 10 ml of 0.9% sodium chloride at room temper-ature [15] with maximal injection speed. The arithmetic mean of these four measurements was calculated. The clinician was blind-ed to the results obtainblind-ed by the two examiners who usblind-ed the Doppler measurement. After all the measurements had been performed, the patient was given 200 ml of a gelatin solution (Physiogel, B. Braun, Emmenbrücke, Switzerland) over 15 min either via a peripheral venous line or through the port of the pul-monary artery catheter. After the volume load, stroke volume mea-surements were performed by the second examiner, followed by the first examiner, hence in reverse order. Between the measure-ments, the probe was displaced by the study coordinator and the examiner had to reposition it. Next, the resident repeated the mea-surements using the thermodilution method. The time interval between two sets of Doppler measurements was a few minutes, depending on how fast the second investigator found the optimal signal. Thermodilution cardiac output was measured immediately after the second Doppler measurement. During each measurement (Doppler and thermodilution method), representative values for systolic and diastolic blood pressure, pulmonary artery pressure, pulmonary artery wedge pressure, and central venous pressure were recorded.
Statistics
With the relatively small number of examinations (n=20) we used non-parametric tests. To compare the two methods before volume load, the Kruskal-Wallis Test (heart rate, all pressure values) and the Mann-Whitney U test (cardiac output, stroke volume) were used. For the two latter parameters the mean Doppler values of the two examiners were computed. The effect of the volume challenge for both methods was examined with the Wilcoxon test. The same test was used to analyze the results of both examiners with the Doppler: the Mann-Whitney U test was used to compare the val-ues before the volume challenge, and the Wilcoxon test was used
to assess the effect of volume administration. Statistical signifi-cance was assumed at a p value <0.05. Results are given as mean values (±SD), if not stated otherwise.
Results
Between September 2000 and April 2001, 19 patients
participated in the study and 20 measurements were
per-formed (1 patient had measurements on two different
days). There were 6 women and 13 men with a median
age of 62 years (range 21–78 years) and a median
Sim-plified Acute Physiologic Score II (SAPS II) [16] of 47
(range 25–87; Table 1).
Thirteen of the 19 patients were on one or more
continuously infused vasoactive drugs (see Table 1).
Ta-bles 2 and 3 summarize the results of the hemodynamic
parameters.
There were no significant differences in heart
fre-quency or in the measured pressure values between the
Doppler and thermodilution methods (Table 2). While
heart rate and systemic blood pressure remained constant
during the whole procedure, mean pulmonary artery
pressure and central venous pressure increased slightly.
Stroke volume and cardiac output values are displayed in
Table 3. The coefficient of variation of all four bolus
measurements using the thermodilution method was 7%
(4%) before and 8% (6%) after volume load. There were
no differences in stroke volume and cardiac output
be-fore volume challenge when measured with either of the
two methods or by the two examiners using the
esopha-Table 1 Patient profiles. NPT natrium–nitroprusside, NE norepinephrine, E epinephrine, DOB dobutamine, SAPS Simplified Acute
Physiologic Score, ARDS adult respiratory distress syndrome, MODS multiple organ dysfunction syndrome
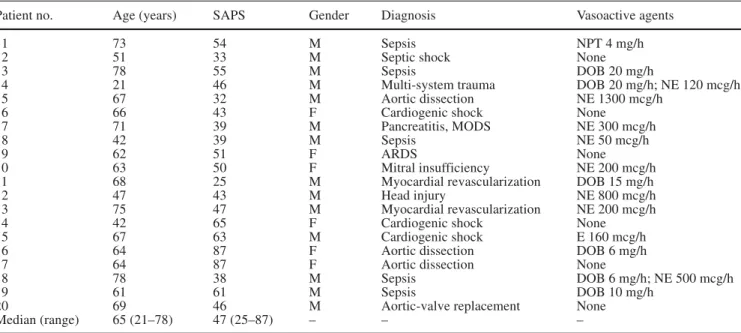
Patient no. Age (years) SAPS Gender Diagnosis Vasoactive agents
1 73 54 M Sepsis NPT 4 mg/h
2 51 33 M Septic shock None
3 78 55 M Sepsis DOB 20 mg/h
4 21 46 M Multi-system trauma DOB 20 mg/h; NE 120 mcg/h
5 67 32 M Aortic dissection NE 1300 mcg/h
6 66 43 F Cardiogenic shock None
7 71 39 M Pancreatitis, MODS NE 300 mcg/h
8 42 39 M Sepsis NE 50 mcg/h
9 62 51 F ARDS None
10 63 50 F Mitral insufficiency NE 200 mcg/h
11 68 25 M Myocardial revascularization DOB 15 mg/h
12 47 43 M Head injury NE 800 mcg/h
13 75 47 M Myocardial revascularization NE 200 mcg/h
14 42 65 F Cardiogenic shock None
15 67 63 M Cardiogenic shock E 160 mcg/h
16 64 87 F Aortic dissection DOB 6 mg/h
17 64 87 F Aortic dissection None
18 78 38 M Sepsis DOB 6 mg/h; NE 500 mcg/h
19 61 61 M Sepsis DOB 10 mg/h
20 69 46 M Aortic-valve replacement None
Median (range) 65 (21–78) 47 (25–87) – – –
Table 2 Hemodynamic parameters
Esophageal Esophageal Thermo- pa pb
Doppler Doppler dilution
Investigator 1 Investigator 2
Heart rate before volume (b/min) 102 (15) 102 (16) 102 (16)
After volume (b/min) 101 (16) 102 (17) 101 (16)
Mean arterial pressure before volume (mm Hg) 65 (8) 65 (7) 64 (6)
After volume (mm Hg) 67 (7) 66 (9) 66 (8)
Mean pulmonary–arterial pressure before volume (mm Hg) 26 (5) 26 (5) 26 (5)
After volume (mm Hg) 28 (6) 28 (6) 28 (5) <0.01 <0.01
Central venous pressure before volume (mm Hg) 12 (4) 11 (4) 11 (4)
After volume (mm Hg) 12 (4) 12 (4) 12 (4) 0.03 <0.01
Pulmonary capillary wedge pressure before volume (mm Hg) 14 (3) 14 (3) 14 (3)
After volume (mm Hg) 15 (4) 15 (4) 15 (4) <0.01 <0.01
a p: Effect of volume load (Wilcoxon test): esophageal Doppler b p: Effect of volume load (Wilcoxon test): thermodilution
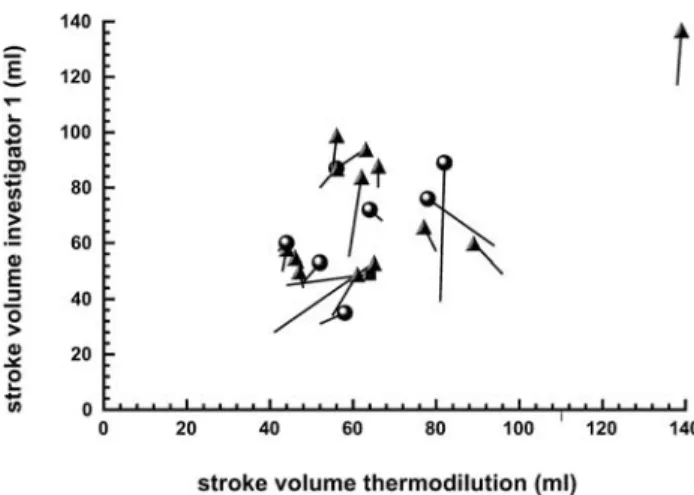
Fig. 2 Esophageal Doppler: investigator 1 vs investigator 2.
Comparison of changes in stroke volume in association with volume application. Each line shows the data of 1 patient. Data
markers: values after volume load; triangles: patients with
cate-cholamines (epinephrine, norepinephrine, dobutamine); squares: patients with natrium–nitroprusside; circles: patients without vasoactive agents
Fig. 3 Esophageal Doppler: investigator 1 vs thermodilution.
Comparison of stroke volume change after volume application. Each line shows the data of one patient. Data markers: values af-ter volume; triangles: patients with catecholamines (epinephrine, norepinephrine, dobutamine); squares: patients with natrium– nitroprusside; circles: patients without vasoactive agents
Fig. 4 Esophageal Doppler: investigator 2 vs thermodilution.
Comparison of stroke volume change after volume application. Each line shows the data of one patient. Data markers: values af-ter volume. triangles: patients with catecholamines (epinephrine, norepinephrine, dobutamine); squares: patients with natrium– nitroprusside; circles: patients without vasoactive agents
Fig. 5 Bland-Altman graph: investigator 1 vs investigator 2.
Grey data points: value before volume; black data points: value
after volume; triangles: patients with catecholamines (epineph-rine, norepineph(epineph-rine, dobutamine); squares: patients with natri-um–nitroprusside; circles: patients without vasoactive agents;
solid line: mean values; dotted lines: mean values ±1.96 standard
deviation
Table 3 Stroke volume and cardiac output before and after volume challenge
Esophageal Doppler Thermodilution pa pb
Investigator 1 Investigator 2 Mean
Stroke volume before volume (ml) 60 (23) 65 (24) 62 (22) 63 (24)
After volume (ml) 69 (24) 69 (25) 69 (24) 66 (22) <0.01 0.02
Cardiac output before volume (l/min m2) 5.96 (2.12) 6.52 (2.17) 6.24 (1.97) 6.35 (2.30)
After volume (l/min m2) 6.85 (2.03) 6.81 (2.12) 6.83 (1.97) 6.57 (2.26) 0.01 0.09
a p: Effect of volume load (Wilcoxon test): esophageal Doppler b p: Effect of volume load (Wilcoxon test): thermodilution
geal Doppler. With both methods, and with both
examin-ers using the esophageal Doppler method, there was a
significant increase in the stroke volume after a volume
challenge, while the increase in the cardiac output
mea-sured by thermodilution was not significant (Table 3).
While the overall correlation between the two methods
was relatively good both before and after volume load
(correlation coefficients between 0.6 and 0.9; p<0.01),
individual differences between the methods and the
examiners using esophageal Doppler were obvious
(Figs. 2, 3, 4). The Bland-Altman analysis (Fig. 5)
dem-onstrates that the bias is small (overall bias for cardiac
output 0.3 l/min) but the precision is poor (1.8 l/min).
Discussion
The main finding of this study was the great variability
in the measured changes in stroke volume after a volume
load, as assessed by two different methods –
thermodilu-tion and esophageal Doppler – as well as by two
differ-ent examiners both using the esophageal Doppler
method.
There are several possible explanations for these
dis-crepancies. Firstly, the differences could be real, i.e.,
they could reflect an unstable hemodynamic situation.
We investigated critically ill, mechanically ventilated
and sedated patients, who were often dependent on
vaso-active drugs. Their cardiac function may well have
shown greater variance than is normally expected.
Con-sequently, the examiners could have measured correct
values. We could not find differences between patients
with or without vasoactive agents (Figs. 2, 3, 4).
Second-ly, the differences could be due to stimulation of the
pa-tient. The placement and manipulation of the esophageal
probe could have provoked an adrenergic stimulation in
the patient so that the examiners again correctly
mea-sured a change in the hemodynamic situation. The
great-er diffgreat-erence between the examingreat-ers using the Dopplgreat-er
method before the volume load as compared with
after-wards supports this hypothesis. The esophageal probe
had to be placed before the volume load, whereas after
the volume load, the probe remained in situ with a
small-er manipulation. A third explanation could be a study
bias of the examiners, who eventually were convinced
that they would measure a higher stroke volume at the
second measurement because they were aware that the
patients received additional volume between the two
measurements; thus, it is possible that the search for the
optimal signal lasted longer during the second
measure-ment. Another explanation for the inter-individual
differ-ences in the obtained hemodynamic parameters is the
fact that the measurements after volume load were
per-formed over a relatively wide time frame for medical
reasons (mean after-fluid loading: 8.6 min; range
1–32 min). Early measurements may not have included
the volume effect, whereas during late measurements the
volume effect may have been abated. Nevertheless, we
could not find a time dependency of changes in stroke
volumes. Moreover, in a few patients the thermodilution
method may well have been incorrect, since the
differ-ences between the four bolus measurements was greater
than the predicted 10% [17]. Finally, when supra-aortic
branches are preferentially perfused, for some reason,
cardiac output and descending aortic blood flow may not
change in parallel.
Several authors have demonstrated that optimizing
cardiac function, i.e., increasing the oxygen delivery to
the tissues perioperatively and in the ICU, improves the
outcome of the patients [18, 19, 20]. In order to increase
stroke volume and cardiac output, preload has to be
opti-mized. The clinical diagnosis of an insufficient preload
is easy in hypovolemic patients but is difficult when
myocardial dysfunction, altered vessel reactivity, and
in-creased endothelial permeability co-exist, e.g., in septic
patients [21, 22] and in patients after cardiac surgery
[23]. The preload and the effect of a volume challenge
can be measured with echocardiography in these
pa-tients, but this technique is not suitable for continuous
monitoring. In these patients, the pulmonary artery
cath-eter is generally used to obtain continuous or
semi-con-tinuous values of cardiac output and other
hemodynami-cally relevant values. This method is invasive and the
overall benefit has been questioned [1,3,4, 24, 26, 27,
28, 29, 30].
As an alternative, esophageal Doppler allows a
nonin-vasive estimation of cardiac output. Since esophageal
Doppler measures aortic blood flow but not the flow to
supra-aortic arteries, the absolute value underestimates
total cardiac output. Furthermore, esophageal Doppler
measures beat-to-beat flow velocity, which is then
con-verted to cardiac output, whereas thermodilution
mea-sures an average cardiac output over a certain time
(a mean value of several measurements is calculated).
Esophageal Doppler has been used to estimate the
prog-nosis in cardiac surgery patients [31]. Furthermore, initial
hemodynamic values can be obtained faster than with
pulmonary artery catheterization [32]. The use of the
Doppler method has been associated with improved
peri-operative morbidity and shortening of hospital stay [33].
The great inter-individual differences we found
be-tween the measurements of the two examiners using the
Doppler are inconsistent with the results obtained by
others [6, 10, 34]. These authors found a closer
inter-in-dividual correlation between the esophageal Doppler and
continuous thermodilution methods. The most probable
explanation for the difference, however, is lack of
expe-rience with the esophageal Doppler technique. There is a
correlation between the accuracy of the obtained signal
and the training time [14].
Since the aortal diameter is not measured, variability
in accuracy in the absolute values can be expected. A
significant pathology, such as a rigidity or manifest
scle-rosis of the aorta, results in a discrepancy between
esti-mated and real cardiac output values. There are
esopha-geal Doppler devices with integrated ultrasound that
allow the aortic diameter to be measured individually.
Using these devices increases the reliability of the
cardi-ac output value [35]; however, since the esophageal
Doppler signal is highly position dependent, and the
method used to define the best signal and its drift over
time may be different both among and between
individu-als, the accuracy of this method remains limited. On the
other hand, poor contractility in some patients may also
have limited the accuracy of the “gold standard”
thermo-dilution method.
Conclusion
We conclude that the esophageal Doppler method is a
non-invasive method for the monitoring of some cardiac
functions. Its use, however, is not as easy as described in
the literature. If the method is not learned systematically,
the probability of obtaining non-reproducible data is
great. Future studies should evaluate the reproducibility
of this method after a standardized teaching period with
final examinations. Nevertheless, this study
demon-strates that a clinically indicated volume load often, but
not always, leads to an increase in stroke volume.
Acknowledgements Acknowledgements. We thank all our
col-leagues from the Institute of Anesthesia and our nursing staff from the Intensive Care Unit at the University Hospital of Bern.
References
1. Vincent JL, Dhainaut JF, Perret C, Suter P (1998) Is the pulmonary artery catheter misused? A European view. Crit Care Med 26:1283–1287 2. Rackow EC (1997) Pulmonary Artery
Catheter Consensus Conference. Crit Care Med 25:901
3. Connors AF, Speroff T, Dawson NV, Thomas C, Harrell FE Jr, Wagner D, Desbiens N, Goldman L, Wu AW, Califf RM, Fulkerson WJ Jr, Vidaillet H, Broste S, Bellamy P, Lynn J, Knaus WA (1996) The effectiveness of right heart catheterization in the initial care of critically ill patients. SUPPORT Investigators. J Am Med Assoc 276:889–897
4. Connors AF (1997) Right heart catheterization: Is it effective? New Horiz 5:195–200
5. Singer M, Bennett ED (1991) Noninva-sive optimization of left ventricular filling using esophageal Doppler. Crit Care Med 9:1132–1137
6. Singer M, Clarke J, Bennett ED (1989) Continuous hemodynamic monitoring by esophageal Doppler. Crit Care Med 17:447–452
7. Singer M, Allen MJ, Webb AR, Bennett ED (1991) Effects of altera-tions in left ventricular filling, contractility, and systemic vascular resistance on the ascending aortic blood velocity waveform of normal subjects. Crit Care Med 19:1138–1144 8. Haxby EJ, Gray MR, Rodriguez C,
Nott D, Springall M, Mythen M (1997) Assessment of cardiovascular changes during laparoscopic hernia repair using oesophageal Doppler. Br J Anaesth 78:515–519
9. Rodriguez RM, Berumen KA (2000) Cardiac output measurement with an esophageal Doppler monitor in critically ill emergency department patients. J Emerg Med 18:159–164
10. Bernardin G, Tiger F, Fouche R, Mattei M (1998) Continuous noninvasive measurement of aortic blood flow in critically ill patients
with a new esophageal echo-Doppler system. J Crit Care 13:177–183
11. Djaiani G, Hardy I (1997) Periopera-tive use of the oesophageal Doppler probe (ODM II) on a patient scheduled for transmyocardial revascularization. Br J Anesth 78:760–761
12. Addy E, Higgins D, Singer M (1993) Use of the oesophageal Doppler to facilitate resuscitation. Emergency Med 5:37–39
13. Gan TJ (2000) The esophageal Doppler as an alternative to the pulmonary artery catheter. Curr Opinion Crit Care 6:214–221
14. Lefrant JY, Bruelle P, Aya AG, Saissi G, Dauzat M, Coussaye JE de la , Eledjam JJ (1998) Training is required to improve the reliability of esophageal Doppler to measure cardiac output in critically ill patients. Intensive Care Med 24:347–352
15. Jansen JR, Schreuder JJ, Settels JJ, Kloek JJ, Versprille A (1990) An adequate strategy for the thermodilu-tion technique in patients during mechanical ventilation. Intensive Care Med 16:422–425
16. Le Gall JR, Lemeshow S, Saulnier F (1993) A new simplified acute physiology score (SAPS II) based on a European/North American multicen-ter study. J Am Med Assoc
270:2957–2963
17. Medin DL, Brown DT, Wesley R, Cunnion RE, Ognibene FP (1998) Validation of continuous thermodilu-tion cardiac output in critically ill patients with analysis of systematic errors. J Crit Care 13:184–189 18. Boyd O, Grounds RM, Bennett ED
(1993) A randomized clinical trial of the effect of deliberate perioperative increase of oxygen delivery on mortali-ty in high-risk surgical patients. J Am Med Assoc 270:2699–2707
19. Shoemaker WC, Appel PL, Kram HB, Waxman K, Lee TS (1988) Prospective trial of supranormal values of survivors as therapeutic goals in high-risk surgi-cal patients. Chest 94:1176–1186 20. Wilson J, Woods I, Fawcett J, Whall R,
Dibb W, Morris C, McManus E (1999) Reducing the risk of major elective surgery: randomised controlled trial of preoperative optimisation of oxygen delivery. Br Med J 318:1099–1103 21. Suffredini AF (1998) Myocardial
dysfunction in sepsis: clinical and experimental investigations. Schweiz Med Wochensch 128:1444–1452 22. Lush CW, Kvietys PR (2000)
Microvascular dysfunction in sepsis. Microcirculation 7:83–101
23. Fransen EJ, Maessen JG, Hermens WT, Glatz JF, Buurman WA (2000) Peri-operative myocardial tissue injury and the release of inflammatory mediators in coronary artery bypass graft pa-tients. Cardiovasc Res 45:853–859 24. Ivanov R, Allen J, Calvin JE (2000)
The incidence of major morbidity in critically ill patients managed with pul-monary artery catheters: a meta-analy-sis. Crit Care Med 28:615–619
25. Murdoch SD, Cohen AT, Bellamy MC (2000) Pulmonary artery catheteriza-tion and mortality in critically ill patients. Br J Anaesth 85:611–615 26. Dalen JE, Bone RC (1996) Is it time to
pull the pulmonary artery catheter? J Am Med Assoc 276:916–918 27. Elliott CG, Zimmermann GA,
Clemmer TP (1979) Complications of pulmonary artery catheterization in the care of critically ill patients. Chest 76:647–652
28. Singer M, Bennett D (1989) Pitfalls of pulmonary artery catheterization highlighted by Doppler ultrasound. Crit Care Med 17:1060–1061
29. Raper R, Sibbald WJ (1986) Misled by the wedge? Chest 89:427–434 30. Morris AH, Chapman RH, Gardner
RM (1985) Frequency of wedge pressure errors in the ICU. Crit Care Med 13:705–708
31. Poeze M, Ramsay G, Greve JW, Singer M (1999) Prediction of postoperative cardiac surgical morbidity and organ failure within 4 h of intensive care unit admission using esophageal Doppler ultrasonography. Crit Care Med 27:1288–1294
32. Lefrant JY, Muller L, Bruelle P, Pandolfi JL, L’Hermite J, Peray P, Saissi G, Coussaye JE de la, Eledjam JJ (2000) Insertion time of the pulmo-nary artery catheter in critically ill patients. Crit Care Med 28:355–359 33. Gan TJ, Soppitt A, Maroof M (1999)
Intraoperative volume expansion guided by esophageal Doppler im-proves postoperative outcome and shortens hospital stay. Anesthesiology 91:A537
34. Baillard C, Cohen Y, Fosse JP, Karoubi P, Hoang P, Cupa M (1999) Haemody-namic measurements (continuous cardiac output and systemic vascular resistance) in critically ill patients: transoesophageal Doppler versus continuous thermodilution. Anaesth Intensive Care 27:33–37
35. Cariou A, Monchi M, Joly LM, Bellenfant F, Claessens YE, Thebert D, Brunet F, Dhainaut JF (1998) Noninva-sive cardiac output monitoring by aortic blood flow determination: evaluation of the Sometec Dynemo-3000 system. Crit Care Med 26:2066–2072