P. Pascale B. Quartenoud J.-C. Stauffer
Isolated large inverted T wave
in pulmonary edema due to hypertensive crisis:
a novel electrocardiographic phenomenon
mimicking ischemia?
Received: 28 July 2006 Accepted: 10 January 2007 Published online: 26 February 2007
Dr. Patrizio Pascale, MD ())
Division of Cardiology, Department of Medicine University Hospital Lausanne
1011 Lausanne, Switzerland Tel.: +41-2 13 14 00 69 Fax: +41-2 13 14 00 13
E-Mail: patrizio.pascale@chuv.ch
Dr. Patrizio Pascale, MD · B. Quartenoud, MD Intensive Care Unit
Cantonal Hospital Fribourg, Switzerland J.-C. Stauffer, MD Division of Cardiology University Hospital Lausanne, Switzerland
Sirs: Large T wave inversion recorded in an isolated region of the precordial electrocardiographic (ECG) leads during an acute cardiac event most frequently signifies myocardial ischemia. The characteristic as-sociation between the ECG pattern of deeply in-verted T waves, mainly in leads V2 and V3, and crit-ical stenosis of the proximal left anterior descending coronary artery was first described by Wellens in 1982 [1]. Because of the high incidence of extensive anterior myocardial infarction when such patients are treated medically and the occurrence of T wave changes during pain-free interval (or when other evidence of ischemia are absent), the development of dynamic isolated T wave inversion is a subject of considerable concern.
A variety of non-coronary events are known to re-sult in global or isolated giant T wave inversion. To our knowledge, acute cardiogenic but non-ischemic pulmonary edema has not been previously asso-ciated with dynamic isolated giant T wave inversion. The purpose of the present study is to describe three patients who developed this characteristic ECG pat-tern after resolution of acute pulmonary edema without significant coronary disease.
Method
Over a three-year period (May 2000 to November 2003) three cases were identified in our department with the following clinical characteristics: 1) acute pulmonary edema based on mode of presentation, clinical evaluation, chest X-ray and response to ther-apy, 2) development of isolated large T wave inver-sion (≥10 mm) defined as occurring in one or more precordial leads on a 12-lead ECG and surrounded by positive T waves after the initial presentation, 3) significant coronary artery disease excluded with a high degree of certainty. All patients underwent echocardiography. Rate correction for the QT inter-vals (QTc) was performed using Bazett’s formula. Serum markers of myocardial injury were creatine kinase (CK) and troponin Ic, samples were drawn at least twice, 6 h apart.
Results
Clinical characteristics of the three study patients are summarized in Table 1. Ages ranged from 50 to 72 years old. The three patients were women and two of them had a history of end-stage renal disease
on intermittent hemodialysis. None of the patients presented with chest pain, neurological symptoms or clinical suggestion of a central nervous system event or pheochromocytoma. The results of initial labora-tory data were unremarkable. Other causes of large T wave inversion, including alteration of the ventri-cular activation sequence, were absent. Patients re-sponded promptly to conventional management of acute pulmonary edema and did not require endo-tracheal intubation. They remained stable and asymptomatic thereafter. Echocardiographic results are summarized in Table 1. Significant coronary ar-tery disease was ruled out by coronary angiography in two patients. For the third patient, coronary ar-tery disease could be excluded with a high degree of certainty by absence of history of chest pain with in-dex event, initial ECG, negative serum markers of myocardial injury, absence of segmental wall motion abnormalities and a normal coronary angiography performed two years earlier. The etiology in each case of pulmonary edema was a hypertensive crisis. In the two patients on intermittent dialysis a volume overload contributed to the clinical presentation.
The electrocardiographic findings are summa-rized in Table 1 and illustrated in Figures 1–3. All patients had left ventricular (LV) hypertrophy by voltage. QTc at presentation was normal. T wave in-version developed within 6 h in the three cases with the maximum amplitudes ranging from 1.1–2.0 mV. Inverted T waves were recorded in the anterior chest leads V1–V4. The QT intervals were variably pro-longed with corrected QT exceeding 600 ms in one case during T wave inversion.
In each case there was a gradual resolution of the T wave inversion and QT prolongation.
Discussion
Isolated T wave inversion recorded during an acute cardiac event generally signifies myocardial ischemia [1–3]. However it has long been recognized that cor-onary artery disease is less likely responsible when transient large T wave inversion with marked prolon-gation of the QT interval develops after an acute
Table 1 Clinical characteristics of the three study patients
Patient 1 2 3
Age (years) 50 72 60
Gender Female Female Female
Past medical history End-stage renal disease due to familial nephronophtisis on intermittent hemodialysis, diabetes, hypertension
Hypertension, nontoxic goiter End-stage renal disease with 4 cerebral aneurysms due to adult polycystic kidney disease on intermittent hemodialysis, hypertension
Etiology Hypertensive crisis + volume overload Hypertensive crisis Hypertensive crisis + volume overload
Heart rate at presentation 130 135 100
Blood pressure at presentation (mmHg)
230/120 220/110 240/160
Localization of inverted T wave (leads)
V1–V4 V1–V3 V1–V3
Maximum amplitude of inverted T wave (mV)
1.4 2.0 1.1
QTc at presentation (ms) 443 435 424
Longest QTc in subsequent ECG (ms)
581 626 458
Markers of myocardial injury Negative Troponin Ic (up to 0.4lg/l) Negative
Echocardiogram LV hypertrophy, anteroapical hypokinesis, EF 50%
Moderate LV dilation, moderate mitral and aortic valve regurgitation, normal wall motion, EF 50%
No left ventricular dilation or hypertrophy, moderate mitral valve regurgitation, no segmental wall motion abnormalities, EF 45% Coronary angiography Coronary sclerosis with
no significant stenosis
No coronary disease Not performed
Left ventriculography Anteroapical hypokinesis, EF 52% Normal wall motion, EF 60% Not performed
event. The most commonly reported association with this characteristic ECG pattern seems to be acute central nervous system disorders, primarily subarachnoid hemorrhage but also subdural hemato-ma, ischemic stroke, trauma and intracranial hemor-rhage [4–6]. Similar T wave changes have been re-ported after bilateral carotid endarterectomy [7]. The massive T wave inversion seen in some patients following Stokes-Adams syncope may be related to a similar neurogenic mechanism [8]. Transient large T wave inversion has been associated with a variety of other conditions including pulmonary embolism [9– 10], non-convulsive status epilepticus [11],
theophyl-line toxicity [12], spontaneous pneumomediastinum [13], emotional stress [14], pheochromocytoma [15], cocaine use [16] and severe aortic regurgitation [17]. A novel cardiac syndrome, the transient left ventricular apical ballooning syndrome, also known as takotsubo cardiomyopathy, characterized by pecu-liar transient apical “ballooning” of the left ventricle and ECG changes mimicking acute myocardial in-farction despite the absence of obstructive epicardial coronary artery disease is also associated with evolu-tionary deep inverted T waves [18, 19].
Furthermore there is an interesting form of T wave inversion consecutive to the alteration of the
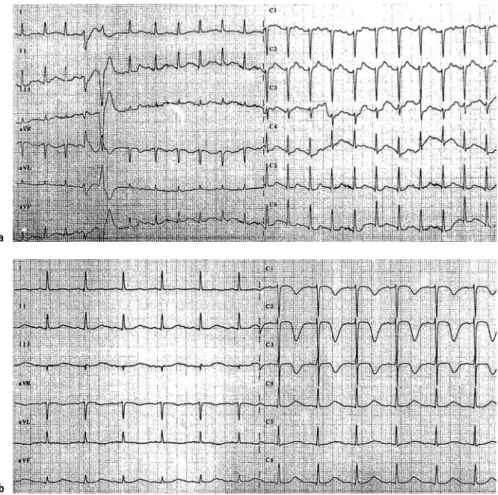
Fig. 1 Patient 1. a ECG on admission for acute
pulmonary edema. b 16 h later, the ECG shows giant inverted T waves in leads V1–V4 and marked prolongation of the QT interval (QTc 581 ms)
a
ventricular activation sequence. The term “cardiac memory T wave changes” has been used in such cir-cumstances. It was first noted following ventricular pacing, with inverted T wave persisting long after re-sumption of sinus rhythm [20]. Similar T wave in-version has been recorded in intermittent left bundle branch block [21], following radiofrequency ablation of the accessory pathway in WPW [22], ventricular tachycardia [23] and other alteration of ventricular activation.
The cases presented here were accumulated over a 3 year period from a community-based hospital. Three patients were identified with large T wave in-version occurring in an isolated region of the pre-cordial ECG leads after resolution of an acute pul-monary edema. The cause of pulpul-monary edema was a hypertensive crisis in each case. In two cases pa-tients had a history of end-stage renal disease on in-termittent hemodialysis and volume overload con-tributed to clinical presentation. The combination of acute pulmonary edema (which could have been in-terpreted as an angina equivalent) and delayed iso-lated inverted T waves was suggestive of the clinical and ECG criteria of the Wellens’ syndrome. However, coronary artery disease was excluded by coronary
angiography in two cases. In the third case, signifi-cant coronary artery disease was not excluded by an-giography but could be ruled out with a high degree of certainty. The prompt response to conventional management of acute pulmonary edema and the fact that patients remained asymptomatic thereafter sub-stantiate the postulated etiology of pulmonary ede-ma.
Marked QT interval prolongation occurred in two cases, whereas in the third case the corrected QT in-terval was only slightly prolonged. The T wave inver-sion and QT prolongation developed after normali-zation of the clinical symptoms and within 6 hours after initial presentation. There was a gradual and simultaneous resolution of the T wave inversion and QT prolongation.
Our report does not allow a characterization of patients who present the described ECG pattern after resolution of acute pulmonary edema. However, it is important to notice that in each reported case the patient was female. A striking female preponderance has also been observed in various series of patients with large T wave inversion [5, 24, 25].
The evolutionary deep T wave inversions with prolongation of the QT interval and the female
pre-Fig. 2 Patient 2. a ECG on admission for acute
pulmonary edema. b 8 h later, the ECG shows giant inverted T waves in leads V1–V3 and marked prolongation of the QT interval (QTc 626 ms)
a
ponderance were also suggestive of the left ventricu-lar apical ballooning syndrome since this condition is triggered in many cases by a physical stress (acute dyspnea in these particular cases). However, the pe-culiar transient apical ballooning of the left ventricle that defines this condition was not observed in the echocardiography performed in the acute phase.
To our knowledge acute pulmonary edema not re-lated to an acute coronary event has not previously been recognized to cause delayed giant isolated T wave inversion after resolution of clinical symptoms. Littmann described a report of nine patients without known or suspected coronary artery disease who presented with acute pulmonary edema and subse-quently developed diffuse T wave inversion and QT prolongation [25]. However, in that report, the ECG was characterized by diffuse negative T waves occur-ring in all precordial leads, whereas in our study T wave inversions occurred in an isolated region of the precordial leads.
We remain uncertain as to the cause of T wave in-version. Although significant coronary disease was essentially ruled out, a subendocardial ischemia may still be implicated. The hypertrophied left
ventricu-lar muscle mass, the increased systolic pressure and the prolongation of ejection time all elevate myocar-dial oxygen consumption. Myocarmyocar-dial perfusion is impaired by the abnormally heightened pressure on the coronary arteries branches, the shortening of diastole and by the elevation of left ventricular end-diastolic pressure which lowers the coronary perfu-sion pressure gradient, thus leading to an imbalance between myocardial oxygen supply and demand. However, because of the prompt response to man-agement of acute pulmonary edema with consecutive normalization of myocardial oxygen supply and de-mand, subendocardial ischemia would not explain why the ECG modifications took hours to occur and persisted for several days.
An alternative explanation for the observed T wave inversion in the precordial leads could involve the characteristic ECG pattern produced by acute right heart strain secondary to the sudden increase of pulmonary vascular resistance as described in pulmonary embolism. However, other signs of acute right ventricular overload as the S1Q3 or S1Q3T3 pattern, the rightward shift of the QRS axis, the right ventricular conduction defects and the
clock-Fig. 3 Patient 3. a ECG on admission for acute
pulmonary edema. b Hours later, the ECG shows giant inverted T waves in leads V1–V3 and slight prolongation of the QT interval (QTc 458 ms)
a
wise rotation were absent. Furthermore, this hypoth-esis would not explain the time lag between the acute phase of the pulmonary edema and the onset of ECG signs after clinical stabilization with conse-cutive normalization of the right ventricular load.
The ECG changes in our patients share many fea-tures with those occurring in patients with sub-arachnoid hemorrhage. These changes were initially thought to be the result of neural influences rather than myocardial damage. However microscopic evi-dence of myocardial injury was subsequently re-ported in these patients [26, 27]. Patients with sub-arachnoid hemorrhage and ECG abnormalities may also demonstrate corresponding regional wall mo-tion abnormalities without stenosis or spasm of the epicardial coronary arteries [28, 29]. The myocardial contraction abnormalities improve in the chronic stage as those in the postischemic stunned myocar-dium. Similar reversible anterior apical wall motion abnormalities were reported with a variety of other acute noncardiac illnesses in patients who developed deep T wave inversion in precordial leads [5]. All pa-tients were acutely ill and coronary angiography ex-cluded significant stenosis in the likely culprit artery in most patients. Thus evidence suggests that revers-ible myocardial contraction abnormalities may occur via mechanisms other than reduction in epicardial coronary blood flow. The sympathetic nervous sys-tem has been considered to be the genesis of the cardiac injury, probably mediated by vasoconstric-tion of intramural coronary arteries or by the direct toxic effect of catecholamines. Pharmacologic adren-ergic stimulation has been shown to induce histolog-ical myocardial damage probably related to cyclic AMP-mediated calcium overload of the cell [30, 31]. Experimentally, myocardial damage after brain death induced by a rapid increase in intracranial pressure could be prevented by total sympathectomy [32]. One study assessing the effect of propanolol and phentolamine on the clinical course of subarachnoid
hemorrage showed that necrotic myocardial lesions were prevented by the pharmacologic sympathetic blockade [33]. While evidence suggests catechola-mines can induce a reversible myocardial damage, it is unclear why the damage would be regional. Re-gional differences in sympathetic innervation could be one possible explanation.
A similar mechanism may have been operative for the observed T-QT changes in our study. ECG abnormalities were similar and all patients undoubt-edly had intense activation of the sympathetic ner-vous system. Interestingly, the left ventriculogram performed in the acute phase demonstrated an ante-roapical hypokinesis in one patient while echocar-diography performed in the two other patients did not show any significant regional wall motion ab-normality but rather a diffuse involvement of the left ventricle.
Thus, our case series describes three patients with large T wave inversion occurring in an isolated re-gion of the precordial ECG leads after resolution of acute pulmonary edema. The cause of pulmonary edema was a hypertensive crisis in each case. The delayed development of this characteristic ECG pat-tern after an acute cardiac event was suggestive of the clinical and ECG criteria of the Wellens’ syn-drome but significant coronary disease was subse-quently ruled out.
Prospective evaluation of patients who present with acute pulmonary edema would allow further knowledge of this ECG phenomenon. It would give us indications about the clinical and ECG criteria as-sociated with noncoronary rather than coronary etiology. A better identification of these patients would allow hospital stays to be shortened without the need to proceed with further invasive diagnostic workup that would otherwise be warranted given the high incidence of anterior myocardial infarction within a matter of days in patients with the Wellens’ syndrome treated medically.
References
1. De Zwann C, Bär FW, Wellens HJJ (1982) Characteristic electrocardio-graphic pattern indicating a critical stenosis high in left anterior descend-ing coronary artery in patients ad-mitted because of impending myocar-dial infarction. Am Heart J 103:730– 736
2. De Zwann C, Bär FW, Janssen JHA et al (1989) Angiographic and clinical characteristics of patients with un-stable angina showing an ECG pat-tern indicating critical narrowing of the proximal LAD coronary artery. Am Heart J 117:657–665
3. Haines DE, Raabe DS, Gundel WD, Wackers FJT (1983) Anatomic and prognostic significance of new T-wave inversion in unstable angina. Am J Cardiol 52:14–18
4. Macaulay W, Nikolic G (1988) Giant T wave inversion. Heart Lung 17:582– 583
5. Sharkey SW, Shear W, Hodges M, Herzog CA (1998) Reversible myocar-dial contraction abnormalities in pa-tients with an acute noncardiac ill-ness. Chest 114:98–105
6. Perron AD, Brady WJ (2000) Electro-cardiographic manifestations of CNS events. Am J Emerg Med 18:715–720
7. Baur HR, Pierach CA (1974) Electro-cardiographic changes after bilateral carotid endarterectomy. New Engl J Med 291:1121–1122
8. Jacobson D, Schrire V (1966) Giant T wave inversion associated with Stokes-Adams syncope. S Afr Med J 40:641–646
9. Ferrari E, Imbert A, Chevalier T (1997) The ECG in pulmonary embo-lism: predictive value of negative T waves in precordial leads – 80 case reports. Chest 111:537–543
10. Medd WE, McBrien DJ (1962) Acute pulmonary embolism with electrocar-diographic changes mimicking coro-nary-artery disease. Lancet 1:944–947 11. Spencer RGS, Cox TS, Kaplan PW
(1998) Global T-wave inversion asso-ciated with nonconvulsive Status Epi-lepticus. Ann Intern Med 129:163– 164
12. Kolander SA, Nydegger CC, Porter RS (1989) T wave inversion associated with severe theophylline toxicity. Chest 96:429–431
13. Sakabe K, Fukuda N, Wakayama K, Nada T, Shinohara H, Tamura Y (2004) Spontaneous pneumomediasti-num: a cause of T-wave inversion in electrocardiogram. Int J Cardiol 94: 123–126
14. Smith KL, Hancock EW (1993) Glo-bal T-wave inversion after a car acci-dent. Hosp Pract 28:55–59
15. Cheng TO, Bashour TT (1976) Strik-ing electrocardiographic changes as-sociated with pheochromocytoma. Chest 70:397–399
16. Kossowsky WA, Lyon AF, Chou SY (1989) Acute non-Q wave cocaine-re-lated myocardial infarction. Chest 96:617–621
17. Weston CFM, Fonfe G, Wahbi Z, Wil-son JI (1996) Giant T wave inversion associated with severe aortic regurgi-tation. Int J Cardiol 54:277–282
18. Tsuchihashi K, Ueshima K, Uchida T, Oh-mura N, Kimura K, Owa M, Yoshiyama M, Miyazaki S, Haze K, Ogawa H, Honda T, Hase M, Kai R, Morii I, for the Angina Pectoris-Myo-cardial Infarction Investigations in Ja-pan (2001) Transient left ventricular apical ballooning without coronary artery stenosis: a novel heart syn-drome mimicking acute myocardial infarction. J Am Coll Cardiol 38:11– 18
19. Villareal RP, Achari A, Wilansky S, Wilson JM (2001) Anteroapical stun-ning and left ventricular outflow tract obstruction. Mayo Clin Proc 76:79–83
20. Chatterjee K, Harris A, Davies JG, Leatham A (1969) T-wave changes after artificial pacing. Lancet 1:759– 760
21. Denes P, Pick A, Miller RH, Pietras RJ, Rosen KM (1978) A characteristic precordial repolarization abnormality with intermittent left bundle-branch block. Ann Intern Med 89:55–57 22. Wood MA, DiMarco JP, Haines DE
(1992) Electrographic abnormalities after radiofrequency catheter ablation of accesssory bypass tracts in the Wolff-Parkinson-White syndrome. Am J Cardiol 70:200–204
23. Kernohan RJ (1969) Post-paroxysmal tachycardia syndrome. Br Heart J 31: 803–806
24. Walder LA, Spodick DH (1991) Glo-bal T wave inversion. J Am Coll Car-diol 17:1479–1485
25. Littmann L (1999) Large T wave in-version and QT prolongation asso-ciated with pulmonary edema. A re-port of nine cases. J Am Coll Cardiol 34:1106–1110
26. Koskelo P, Punsar S, Sipila W (1964) Subendocardial haemorrhage and E.C.G. changes in intracranial bleed-ing. Br Med J 1:1479–1480
27. Doshi R, Neil-Dwyer G (1980) A clin-icopathological study of patients fol-lowing a subarachnoid hemorrage. J Neurosurg 52:295–301
28. Pollick C, Cujec B, Parker S, Tator C (1988) Left ventricular wall motion abnormalities in subarachnoid he-morrage: an echocardiographic study. J Am Coll Cardiol 12:600–605 29. Kono T, Morita H, Kuroiwa T, Onaka
H, Takatsuka H, Fujiwara A (1994) Left ventricular wall motin abnormal-ities in patients with subarachnoid hemorrage: neurogenic stunned myo-cardium. J Am Coll Cardiol 24:636– 640
30. Todd GL, Baroldi G, Pieper GM, Clayton FC, Eliot RS (1985) Experimental cate-cholamine-induced myocardial necro-sis. II. Temporal development of isopro-terenol-induced contraction band le-sions correlated with ECG, hemody-namic and biochemical changes. J Mol Cell Cardiol 17:647–656
31. Mann DL, Kent RL, Parsons B, Coop-er G (1992) AdrenCoop-ergic effects on the biology of the adult mammalian car-diocyte. Circulation 85:790–804 32. Novitzky D, Wicomb WN, Cooper
DK, Rose AG, Reichart B (1986) Pre-vention of myocardial injury during brain death by total cardiac sympath-ectomy in the Chacma baboon. Ann Thorac Surg 41:520–524
33. Neil-Dwyer G, Walter P, Cruickshank JM, Doshi B, O’Gorman P (1978) Ef-fect of propanolol and phentolamine on myocardial necrosis after sub-arachnoid haemorrhage. Br Med J 2:990-992