Timely detection of bacterial meningitis epidemics at district level:
a study in three countries of the African Meningitis Belt
Lydiane Agier
a,b,*, He´le`ne Broutin
c,d, Eric Bertherat
a, Mamoudou H. Djingarey
e, Clement Lingani
e,
William Perea
aand Ste´phane Hugonnet
aaEpidemic and Pandemic Alert and Response, World Health Organization, Geneva, Switzerland;bCombining Health Information,
Computation and Statistics, Lancaster Medical School, Lancaster University, Lancaster LA1 4YD, UK;cDivision of International Epidemiology and Population Studies, Fogarty International Center, National Institutes of Health, Bethesda, MD, USA;dMIVEGEC,
UMR 5290 CNRS-224 IRD-UM1-UM2, Centre IRD, Montpellier, France;eIntercountry Support Team for West Africa, WHO, Ouagadougou, Burkina Faso
*Corresponding author: Tel:+44 1524 5 94622; Fax: +44 1524 5 93747; Email: [email protected]
Received 4 February 2012; revised 26 August 2012; accepted 17 September 2012
Background: Bacterial meningitis is a major public health problem in the African ‘Meningitis Belt’, where recur-rent unpredictable epidemics occur. Despite the introduction in 2010 of the conjugate A vaccine, the reactive strategy remains important for responding to epidemics caused by other bacteria and in areas not yet vacci-nated. Review of weekly numbers of suspected cases in Niger, Mali and Burkina Faso identified spatial disparities in the annual patterns of meningitis, which suggested a more local way of defining epidemics and initiating a timely vaccination campaign.
Method: We defined an epidemic district-year as an excess of cases compared to the incidence previously experienced in the given district. Groups of similar districts in terms of seasonal patterns were identified by cluster analysis. We investigated a cluster-specific criterion of early epidemic onset to anticipate epidemic dis-trict-years.
Results: These were encouraging, as epidemic district-years were fairly efficiently captured, with an average time gained of 2.5 weeks over the current strategy.
Conclusion: This early-onset criterion could help ensure timely implementation of vaccination campaigns without the need to modify the implemented surveillance system. The next step is to extend this study to other countries of the Meningitis Belt, and to explain the differences in seasonal patterns in the different clusters.
Keywords: Bacterial meningitis, Africa, Epidemic timing, Spatiotemporal dynamics, Cluster analysis, Epidemic definition
Introduction
Bacterial meningitis (which we will subsequently refer to as meningitis) is a major public health problem in the Meningitis Belt, a region in Sub-Saharan Africa extending from Senegal to Ethiopia with an estimated population of 400 million people.1,2 Meningitis, which is caused mainly by Neisseria meningitidis but also by Streptococcus pneumoniae or Haemophilus influen-zae type B, is a contagious disease transmitted person-to-person via respiratory droplets. Incidence rates in the Belt are among the highest in the world; they show a marked seasonal increase during the dry season (December to June),3,4 and there are recurrent pluriannual epidemic waves
on a larger regional scale.5–7The mortality rate is about 10%
even with appropriate treatment, and 10 –15% of survivors ex-perience long-term neurological sequelae.8 Asymptomatic
car-riage is a notable feature of the disease; carcar-riage rates vary between 3% and 30% of the population across countries and seasons.9,10 While Neisseria meningitidis serogroup A is the main cause for large epidemics, serogroups W135, C and X are also responsible for localised outbreaks;11–14 however a lack of data makes it difficult to differentiate the dynamics of the different strains.
Public health policies in countries of the Meningitis Belt are based on a reactive vaccination strategy, mostly because menin-gitis epidemics are unpredictable and the polysaccharide vaccine is in short supply and induces only short-term immunity. The WHO introduced two epidemiological thresholds to trigger
#Royal Society of Tropical Medicine and Hygiene 2012. All rights reserved. For Permissions, please email: [email protected]
ORIGI N AL AR T ICLE
implementation of this reactive strategy: when the ‘alert’ threshold (i.e. five cases per 100 000 population per week) is reached, surveillance and epidemic preparedness measures are enhanced. Once the ‘epidemic’ threshold (i.e. 10 cases per 100 000 population per week) is exceeded, a mass vaccination campaign is launched in the affected district.16Timely immunisa-tion could avoid 60% of the cases.17However, the efficacy of the
mass vaccination strategy is often reduced because of delays in the surveillance process and in obtaining laboratory confirmation, and then in finalising logistics before the launch of a vaccination campaign.
In parallel to this reactive strategy a new conjugate vaccine, MenAfriVac, was introduced in the Belt in 2010 as a potential pre-vention tool to protect against Neisseria meningitidis serogroup A. It is hoped to dramatically decrease the burden of the disease in this region: unlike the polysaccharide vaccine, the con-jugate vaccine is expected to have an impact on carriage (hence providing herd immunity), and could induce long-term protec-tion.9,18,19 However, the main reactive control strategy will
remain a priority at least for the next decade: vaccinating the whole population at risk within the Belt with the conjugate vaccine will take 5 –10 years. During this period, outbreaks of Neisseria meningitidis serogroup A are still anticipated in non-vaccinated areas, and other bacteria will continue to circulate in the whole population. Moreover, we cannot predict what the dynamic of the other bacteria will be after immunisation of the population with this new vaccine.
Therefore the epidemiology of the disease needs to be better understood. If epidemics could be anticipated earlier than at present, with an adequate degree of specificity, the reactive strategy would be more effective; earlier introduction of vaccin-ation in highly epidemic situvaccin-ations would allow more cases to
be prevented. Statistical modelling has not yet succeeded in helping policy makers to forecast epidemics at the spatio-temporal level they are dealing with, namely the district-level weekly scale.
In this study, we aimed to explore the annual patterns of meningitis at district level and thus identify new parameters to anticipate epidemic years. We focused on three highly affected countries: Mali, Niger and Burkina Faso. Using district-level sur-veillance data collected over more than a decade, we performed a cluster analysis and grouped similar districts in terms of annual patterns. We then provided a new district-specific definition of an epidemic year and compared the annual patterns between epi-demic and non-epiepi-demic years in the different clusters. Finally, we defined a cluster-specific criterion that could help anticipate an epidemic year, and tested its potential to do so.
Materials and methods
Data
Relying on the national enhanced health surveillance system supported by WHO,15 epidemiological data were collected in
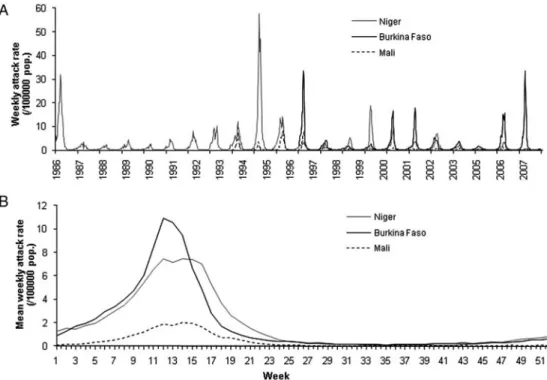
Niger (1986 –2007, 38 districts), Mali (1994– 2007, 52 districts) and Burkina Faso (1997–2007, 55 districts). Suspected cases of meningitis were identified by use of a standard clinical case def-inition (laboratory confirmation is not mandatory), and were reported as weekly aggregated numbers of cases per district. A district-year (DY) refers to data for a given district in a given cal-endar year. Over the study period, the epidemiology of meningi-tis showed important seasonal fluctuations and regular major epidemic waves (Figure1A). Districts are heterogeneous both in
Figure 1. Meningitis time series and mean annual pattern of weekly incidence for Niger, Mali, and Burkina Faso. (A) Time series of weekly incidence and (B) mean annual pattern of weekly incidence, in cases per 100 000 population, for Niger (grey line), Burkina Faso (black line) and Mali (dotted line).
terms of areas covered and population size, and uneven levels of incidence were recorded (Table1).
We counted 33 instances of missing data (i.e. no declaration during a week for a given district) in the Niger time series, three in Mali and 2890 (9.7% of the country data) in Burkina Faso. These gaps in the record mostly occurred in low-incidence periods, and were corrected as follows. A linear smoothing was applied when fewer than 4 consecutive weeks were missing (we do not expect incidence to change dramatically over short periods). When data remained missing for a given week w, we referred to incidence for the given district in week w over the other years of the study, and if it never exceeded 10 cases (in which case it could be considered a low-incidence time of year), the mean number of cases was imputed. Only one DY was noticed in Burkina Faso for having data missing over most of the year: this DY was not considered in our analysis.
Census-based estimates of district-level population denomi-nators were available for Niger for 1977, 1988 and 2001; in other years, denominators were estimated by linear interpol-ation. Over the study period, one census was held in Mali (1998), and one in Burkina Faso (1996). Population denominators were extrapolated back and forth from these censuses by apply-ing the national annual population growth rate provided by the WHO Statistical Information System (now incorporated into WHO Global Health Observatory www.who.int/gho).
Cluster analyses
We performed cluster analyses to identify groups of districts with similar annual patterns. For each district we computed the weekly annual incidence in number of cases per 100 000 popula-tion. We then calculated the mean annual pattern by averaging the incidence per calendar week across years (see Figure1B for an example at country level). For each curve, we extracted six variables: the mean, the maximum, the standard deviation, the week of maximum and the skewness and kurtosis indices of the curve (i.e., respectively, the curves’ symmetry and ‘peaked-ness’ coefficients). A principal component analysis20 was
performed on this set of six variables, to eliminate their redun-dancy and detect outliers. The first three output variables,
which summarised more than 95% of the heterogeneity of the original variables, were used as input for the cluster analysis.
The aim of the cluster analysis was to enhance similarities between districts by grouping them according to a set of selected characteristics. We used a hierarchical ascendant method with Ward’s distance: it unifies districts step-by-step, by minimis-ing the increase in intra-group heterogeneity.21 We arbitrarily decided to stop the iteration process after obtaining three clusters. We have analysed data separately for Niger, Burkina Faso and Mali, as the incidence levels are very heterogeneous between coun-tries. When the clustering method was applied to data of the three countries together, low within-country heterogeneity was observed, and the analysis was not discriminative at a national level (Supplementary Figure S1). As a consequence, no sub-country observation of epidemics was enabled, and no sub-country scale strategy could be suggested for responding to epidemics.
Comparison of epidemic and non-epidemic years
The large heterogeneity of meningitis incidence between districts pushed us to provide a district-specific definition of an epidemic that might be more appropriate than the current definition, which is unique for the whole belt. An epidemic DY was accord-ingly defined as a DY for which the annual incidence is higher than the mean annual incidence over the DYs of the given district.
Within each group defined by the cluster analysis, we com-pared meningitis annual patterns in epidemic and non-epidemic DYs as follows. For each annual curve, we estimated the mean, maximum, standard deviation, week of maximum, skewness and kurtosis indices of the curve. For the WHO alert and epidemic thresholds, we considered three additional variables: the first week when the threshold was exceeded (as a proxy of epidemic onset), the number of weeks between crossing the threshold and reaching the incidence peak of the season (as a proxy of the rap-idity of the seasonal increase), and the number of weeks above the threshold (as a proxy of the length of the epidemic season). A t-test at the 5% level was performed to compare mean values, with a Welch modification in case of unequal vari-ance (results are not shown).22
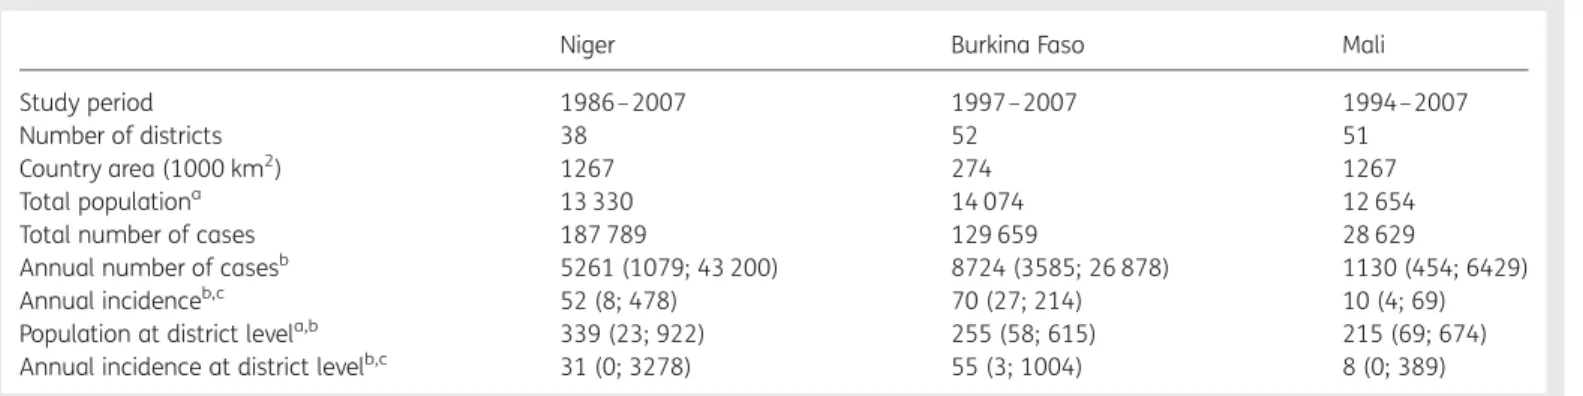
Table 1. General and epidemiological country-level characteristics for Niger, Burkina Faso and Mali
Niger Burkina Faso Mali
Study period 1986– 2007 1997–2007 1994–2007
Number of districts 38 52 51
Country area (1000 km2) 1267 274 1267
Total populationa 13 330 14 074 12 654
Total number of cases 187 789 129 659 28 629
Annual number of casesb 5261 (1079; 43 200) 8724 (3585; 26 878) 1130 (454; 6429) Annual incidenceb,c 52 (8; 478) 70 (27; 214) 10 (4; 69)
Population at district levela,b 339 (23; 922) 255 (58; 615) 215 (69; 674) Annual incidence at district levelb,c 31 (0; 3278) 55 (3; 1004) 8 (0; 389) ain 1000 population (2007 estimates);bgiven as median (minimum; maximum);cin cases per 100 000 population.
Diagnostic test performance
Our aim was to anticipate epidemic DYs. We thus used the first week that the WHO alert threshold was exceeded to define an early epidemic onset, and tested how efficient this criterion could be to predict an epidemic DY. To do so, we needed to define an upper limit to characterise an early epidemic onset. We compared at a DY-level the fact that the incidence rate exceeded the WHO alert threshold earlier than week x (i.e. the diagnostic test) to the fact that the DY was considered epidemic (i.e. the gold standard).23We retained the value of x maximising altogether the resulting sensitivity, specificity and positive pre-dicted value (PPV) (formulae provided in Supplementary Figure S2) - more precisely, the one minimising the sum of their squared distance to 100%. We further calculated the number of weeks that would be gained (when applicable) if the decision to launch a vaccination campaign depended on the WHO alert threshold being exceeded before week x instead of the WHO epidemic threshold being exceeded (i.e. the current strategy), together with the proportion of DYs in which vaccination would have been implemented. This upper limit for an early epidemic onset was defined at a regional level (i.e. a unique upper limit for all districts), at the country level (i.e. con-sidering country-specific upper limits), and at the cluster level (i.e. considering cluster-specific upper limits).
As the overall proportion of epidemic DYs is small, high sensi-tivity and specificity can coincide with low PPV (for an example, see Supplementary Figure S2), which reflects the potential loss of vaccine resources distributed in non-epidemic DYs. Hence, PPV is accounted for when defining x.
Statistical analyses were performed using the R software (R Project for Statistical Computing, http://www.r-project.org). Maps were drawn using the HealthMapper software (http:// www.who.int/health_mapping/tools/healthmapper/en/).
Results
Cluster analysis
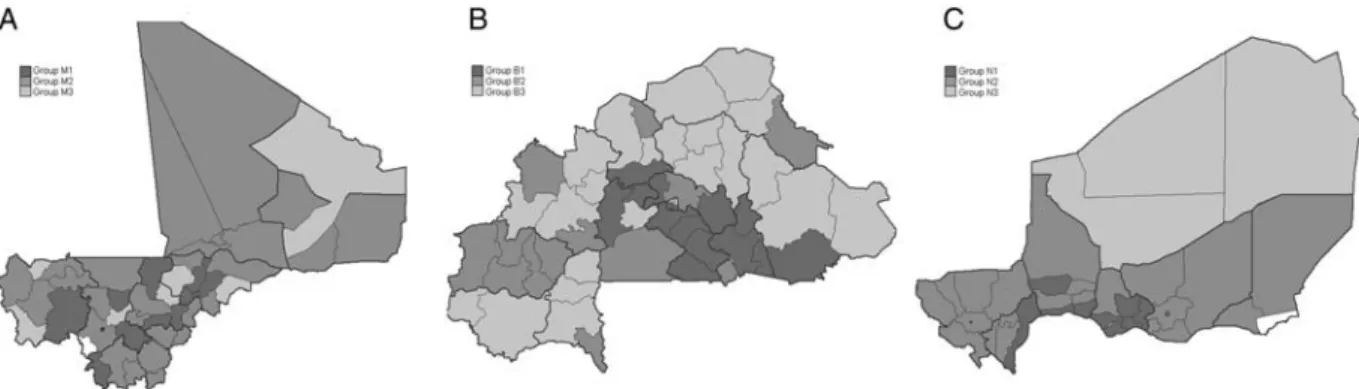
We assembled districts within each country into three clusters, Groups M1 –3, N1–3 and B1 –3 in decreasing order of averaged weekly incidences. Groups were spatially clustered, mostly in Niger and Burkina Faso (Figure 2). Three districts (two in Niger and one in Mali) were considered as outliers: two notified
unusually high average weekly incidences and one reported one high weekly incidence in a low-incidence period. These dis-tricts were not included in the cluster analysis to avoid distorting the results.
Cluster comparisons
Supplementary Table S1 summarises the clusters’ profiles in both epidemic and non-epidemic DYs. In the following, the epidemic onset, length of epidemic season and rapidity of the seasonal in-crease refer to both the WHO alert and epidemic threshold, when applicable. In all clusters, the average mean and the maximum weekly incidence was significantly greater in epidemic than in non-epidemic DYs, the epidemic onset occurred significantly earlier (except Group B2), and the length of the epidemic season was significantly longer. When comparing epidemic DYs across clusters, a significantly higher mean and maximum weekly incidence was observed for Group 1 vs Group 2 and for Group 1 vs Group 3, together with a significantly earlier epidemic onset and longer length of epidemic seasons. When observing Group 2 vs Group 3, the same pattern was observed for Niger; in Burkina Faso, Group 2 experienced shorter epidemic seasons than Group B3 yet with higher peaks of weekly incidences.
Overall, in a given DY, the higher the annual weekly incidence, the earlier the WHO epidemic threshold is exceeded (Pearson correlation coefficient of –0.48/ –0.55 considering the WHO alert/epidemic thresholds, respectively) and the longer the epi-demic season (Pearson correlation coefficient of 0.77/0.82 con-sidering the alert/epidemic thresholds, respectively).
Among the epidemic DYs, the WHO alert and epidemic thresh-olds were exceeded in 90% and 72% of the cases, respectively; and in 24% and 8% respectively for non-epidemic DYs (Supple-mentary Table S2). The WHO epidemic threshold was never exceeded in non-epidemic DYs in Mali, and in Group M3 the WHO alert threshold was exceeded in only one DY.
Comparison between countries
Supplementary Table S1 displays the characteristics of the groups’ seasonal patterns. The highest annual weekly incidences at national and district levels were recorded in Niger (Table1), whereas districts were affected in a more homogeneous manner in Burkina Faso (standard deviation of annual incidence:
Figure 2. Mapping of groups obtained by cluster methods, by country. Maps of clusters for (A) Mali, (B) Burkina Faso, and (C) Niger. Outliers are depicted in white (two districts in Niger, one in Mali).
121 vs 195 for Niger). Overall similar incidences were recorded for these two countries over the study period (Table1). During epidemic DYs, the WHO alert threshold was first exceeded on average at the same time in Niger and Burkina Faso (mean week number of 7.9 and 7.7, respectively), whereas the WHO epi-demic threshold was first exceeded earlier in Burkina Faso (mean week number of 9.2 vs 10.1 in Niger). The averaged weekly inci-dence peak was significantly higher in Burkina Faso than in Niger (46.5 vs 35.2, respectively), was reached earlier (mean week number of 12.5 vs 14.2), and the epidemic seasons were shorter (on average 8.6 vs 10.6 weeks above WHO alert thresh-old). In Mali, meningitis seasons were of lower magnitude. When the WHO alert threshold was exceeded, it happened on average more than 3 weeks later than it did in Niger or Burkina Faso, and the epidemic seasons were significantly shorter.
Epidemic onset criterion
As a consequence of early epidemic onset being concomitant with high incidences, we focused on the WHO alert threshold being exceeded early as a marker to anticipate epidemics; a diagnostic test performance was carried out (Table2). At all re-gional, country and cluster levels, the overall sensitivity, specifi-city, positive predictive value (PPV) and negative predictive value (NPV) remained greater than 65%. Defining an early epi-demic onset at a country level slightly improved all criteria values as compared to the regional level; while the cluster level gave higher specificity and PPV, together with a small decrease
in sensitivity, and fewer DYs targeted for vaccination. The mean time gained (by switching from the WHO epidemic threshold to the WHO alert threshold) was similar regardless of the definition level that was considered: between 2.47 and 2.58 weeks. For 28% of the epidemic DYs, no time could be gained as the WHO alert and epidemic thresholds were first exceeded in the same week. Highest incidence DYs were better identified when defining a unique criterion for all countries: annual incidence and cumu-lative incidence after the WHO alert threshold was exceeded were on average the highest when defining the criterion at the regional level and the lowest when defining the criterion at the cluster level.
Discussion
Main findings
By observing the meningitis seasonal patterns at a district level in Mali, Burkina Faso and Niger over more than a decade, significant differences were highlighted across districts and regions in terms of levels of incidence reached and timing of epidemic onset. This suggested that we should investigate epidemics at a more local level, by formulating a district-level definition of an epidemic and by investigating local criteria to anticipate them. Accordingly, we have defined an epidemic as a local excess of cases compared to an average annual incidence in the given district. This definition gives more emphasis to the unusual character of a situation compared to the local history, rather than compared to other
Table 2. Diagnostic test performance, using as a gold standard the definition of an epidemic DY, and comparing it to the diagnostic test of an early epidemic onset (defined as a DY for which the WHO alert threshold is exceeded before week x). The upper limit x for defining an early epidemic onset was defined at cluster, country and regional levels. Epidemic DY: an excess of cases compared to the incidence previously experienced in the given district
Group Limit week x Sensitivity (%) Specificity (%) Positive predictive value (%)
Negative predictive value (%)
Proportion of DYs with an early epidemic onset (%)
N1 8 84.2 87.0 66.7 94.7 29.8 N2 11 66.4 93.0 77.3 88.5 22.7 N3 25 79.0 95.7 88.2 91.8 25.8 B1 8 50.0 84.2 58.1 79.3 26.2 B2 8 41.5 87.3 56.7 78.8 21.0 B3 10 53.4 88.1 69.1 79.1 25.8 M1 15 84.5 94.7 86.0 94.1 27.1 M2 22 69.4 97.1 91.3 87.7 23.5 M3 21 80.0 98.5 96.0 91.8 25.5 Cluster levela – 66.6 91.8 76.7 87.2 24.9 Niger 11 70.6 87.8 66.7 89.6 27.3 Burkina Faso 10 57.5 83.4 61.3 81.1 29.4 Mali 22 76.1 95.7 88.3 90.4 25.7 Country levelb – 68.6 89.3 72.0 87.6 27.3 Regional level 12 65.2 87.6 68.0 86.2 27.5
aAggregation of individual results at the cluster level (N1-N3, B1-B3, M1-M3). bAggregation of individual results at the country level (Niger, Burkina Faso and Mali).
geographic areas. Considering this definition, we suggested the criterion of an early epidemic onset to anticipate an epidemic. An early onset was defined from the WHO alert threshold. If ap-propriate, this criterion would represent an improvement, as time would be gained over the current strategy. We tested defining this criterion at regional (i.e. over the three countries), country and cluster level (defined through the cluster analysis). Retro-spectively, when defined at cluster level, this criterion had en-couraging properties: an epidemic DY could be anticipated with sensitivity 67%, specificity 92%, PPV 77% and NPV 87%; for an average time gained of 2.5 weeks over the current strategy. Al-though defining this criterion at a regional level better captures the high-incidence DYs, a cluster-level definition gave compar-able results in terms of capturing epidemic DYs and better high-lights the locally extreme situation compared to what the population has previously experienced. This definition of an epi-demic DY would avoid the phenomenon of vaccination cam-paigns being launched in the same district 2 years in a row, as has happened in recent years with the current strategy. Finally, this criterion could be used to anticipate epidemic DYs, and could trigger the preparation of materials in readiness for, if not the launching of, vaccination campaigns.
Early epidemic onset concurring with high annual incidence has been noted previously in several publications.16,24–27De Cha-balier et al.24defined an early epidemic onset as a DY for which the WHO alert threshold was exceeded before week 10. In our study, we have extended the analysis to three countries over longer study periods. As spatial disparities were highlighted, we have investigated which scale was most appropriate to define an early epidemic onset. Paireau et al.27and Tall et al.26recently investigated defining an epidemic at a sub-district level in Niger and Burkina Faso, respectively. Despite encouraging results, turning the resulting recommendations into public health action requires a modification of the surveillance protocol, which might be politically problematic. In comparison, our results are easy to use and directly applicable without any modi-fication of the surveillance system.
Spatial disparities
We noticed differences between countries in the incidence levels and in the timing of seasonal patterns (which could be partly attributed to differences in the reporting systems and in the im-plementation of public health policies) and between groups defined in the cluster analyses. The lower within-country hetero-geneity in Burkina Faso could be a result of population density being more homogeneous in this country than in Mali or Niger. Higher risk could be attributed to an increased person-to-person contact rate: the highest-incidence regions are located in the south of the studied area, where the population movements and axes of communications are dense. In particular, the loca-tion of high-risk districts in Niger along the Nigerian border could mirror specific exchange routes between the two coun-tries, including health-seeking behaviours.
Limitations
Although meningitis symptoms are well known in susceptible populations under-reporting can easily occur, particularly in remote districts where patients may not be able to reach the
health centres where incidence is recorded. Nevertheless, popu-lation concern is high, and health professionals are trained to report suspected cases according to a consistent WHO case def-inition.15Any bias in reported incidence is therefore likely to be consistent in time and space. Moreover, the definition of inter-vention thresholds resulted from analyses of cases data that were collected according to the same guidelines, i.e. that suf-fered similar bias.
Applying a national annual population rate could be unrealis-tic, given the uneven population distribution in Mali and Burkina Faso. However, population size should not change dramatically from one year to the next in the absence of a major climatic or political event. The potential impact of our estimation bias is therefore not considered to be of any consequence.
We disregarded vaccination history. Although its impact on meningitis is expected to be substantial, no reliable data were systematically collected over our study period. However, vaccin-ation campaigns affect the end of the epidemic season and the 3 years following vaccination during which the population is believed to be protected. Immunity should impact the epidemic onset (which we mostly focus on in this study) to a small extent, with an homogeneous effect across countries as the vaccination strategy is implemented following WHO recommendations.15
Conclusion
To conclude, a cluster-specific criterion of early epidemic onset could facilitate the anticipation of epidemic DYs. Specifying a local definition of an epidemic DY and characterising relevant cri-teria for epidemic anticipation could be an important step forward because, as we showed, the seasonal patterns differ fairly substantially between countries and even within countries. This easy-to-use criterion could help trigger more timely responses to epidemics, and improve the effectiveness of the re-active vaccination strategy, without any modification of the sur-veillance protocol. It could be further investigated, especially for other countries (applicable when at least 15 years of data are available) to confirm its value as a new parameter in the reactive vaccination decision process. Other follow-up research should explore the determinants of the differences of epidemiological patterns between clusters, including environment, population immunity and dynamics, societal organisation, and ecology of pathogens. Finally, a better understanding of the epidemiological process and its determinants will help improve integrative math-ematical modelling to inform the long-term preventive strategy.
Supplementary data
Supplementary data are available at Transactions Online (http:// trstmh.oxfordjournals.org/).
Authors’ statement: LA, EB, MHD, CL, WP and SH are staff members of the WHO. The authors alone are responsible for the views expressed in this publication and they do not necessarily represent the decisions, policy or views of the WHO.
Authors’ contributions: LA, HB, SH, EB and WP conceived the study and designed the study protocol. MHD and CL were responsible for data
collection. LA and HB conducted all data analyses. LA, HB and SH interpreted the results and drafted the manuscript. SH, EB, MHD, CL and WP critically revised the manuscript for intellectual content. All authors read and approved the final manuscript. LA and HB are guarantors of the paper.
Acknowledgement: Grateful thanks to Emily Firth, who kindly accepted the task of reviewing the language.
Funding: LA was funded by WHO, Geneva, Switzerland and the Health and Climate Foundation, Washington DC, USA. HB was supported by the intramural research group of Fogarty International Center, US National Institutes of Health, Bethesda, MD, USA. No funding bodies had any role in the study design, data collection and analysis, decision to publish, or preparation of the manuscript.
Competing interests: None declared. Ethical approval: Not required.
References
1 Molesworth AM, Thomson MC, Connor SJ et al. Where is the meningitis belt? Defining an area at risk of epidemic meningitis in Africa. Trans R Soc Trop Med Hyg 2002;96:242– 9.
2 Lapeyssonnie L. La me´ningite ce´re´bro-spinale en Afrique. Bull World Health Org 1963;28(Suppl.1):3–114.
3 Greenwood BM, Bradley AK, Wall RA. Meningococcal disease and season in sub-Saharan Africa. Lancet 1985;2:829–30.
4 Sultan B, Labadi K, Gue´gan J-F, Janicot S. Climate drives the meningitis epidemics onset in West Africa. PLoS Medicine 2005;2:e6. 5 Broutin H, Philippon S, Constantin De Magny G et al. Comparative study of meningitis dynamics across nine African countries: a global perspective. Int J Health Geographics 2007;6:29.
6 Mueller JE, Gessner BD. A hypothetical explanatory model for meningococcal meningitis in the African meningitis belt. Int J Inf Dis 2010;14:e553– 9.
7 Greenwood BM. Manson Lecture. Meningococcal meningitis in Africa. Trans R Soc Trop Med Hyg 1999;93:341 –53.
8 Smith AW, Bradley AK, Wall RA et al. Sequelae of epidemic meningococcal meningitis in Africa. Trans R Soc Trop Med Hyg 1988;82:312 –20.
9 Terranella A, Cohn A, Clark T. Meningococcal conjugate vaccines: optimizing global impact. Infect Drug Resist 2011;4:161–9. 10 Trotter CL, Greenwood BM. Meningococcal carriage in the African
meningitis belt. Lancet Infect Dis 2007;7:797– 803.
11 Forgor AA, Leimkugel J, Hodgson A et al. Emergence of W135 meningococcal meningitis in Ghana. Trop Med Int Health 2005;10:1229 –34.
12 Mueller JE, Borrow R, Gessner BD. Meningococcal serogroup W135 in the African meningitis belt: epidemiology, immunity and vaccines. Expert Rev Vaccines 2006;5:319– 36.
13 Teyssou R, Muros-le-Rouzic E. Meningitis epidemics in Africa: A brief overview. Vaccine 2007;25(Suppl 1):A3 –7.
14 Traore´ Y, Njanpop-Lafourcade B-M, Adjogble K-L-S et al. The rise and fall of epidemic Neisseria meningitidis serogroup W135 meningitis in Burkina Faso, 2002–2005. Clin Infect Dis 2006;43:817– 22.
15 WHO. Control of epidemic meningococcal disease. WHO practical guidelines. 2nd edn. Geneva: WHO; 2009.
16 WHO. Detecting meningococcal meningitis epidemics in highly-endemic African countries. Weekly Epidemiology Record (WER) 2000;38:306 – 9.
17 Woods CW, Armstrong G, Sackey SO et al. Emergency vaccination against epidemic meningitis in Ghana: implications for the control of meningococcal disease in West Africa. Lancet 2000;355:30 – 3.
18 Kshirsagar N, Mur N, Thatte U et al. Safety, immunogenicity, and antibody persistence of a new meningococcal group A conjugate vaccine in healthy Indian adults. Vaccine 2007;25(Suppl 1):A101–7.
19 LaForce FM, Konde K, Viviani S, Pre´ziosi M-P. The Meningitis Vaccine Project. Vaccine 2007;25(Suppl 1):A97– 100.
20 Joliffe IT. Principle Component Analysis, 2nd edn. New York: Springer; 2002.
21 Aldenderfer MS, Blashfield RK. Cluster Analysis. Beverly Hills, CA: Sage; 1984.
22 Welch BL. The generalization of ‘Student’s’ problem when several different population variances are involved. Biometrika 1947; 34:28 –35.
23 Azevedo ADC, De Souza PJ. Sensitivity, specificity and predictive value of diagnostic tests. Arq Bras Cardiol 1980;127:173– 5.
24 De Chabalier F, Djingarey MH, Hassane A, Chippaux JP. Meningitis seasonal pattern in Africa and detection of epidemics: a retrospective study in Niger, 1990–98. Trans R Soc Trop Med Hyg 2000;94:664 – 8.
25 Lewis R, Nathan N, Diarra L, Belanger F, Paquet C. Timely detection of meningococcal meningitis epidemics in Africa. Lancet 2001;358: 287– 93.
26 Tall H, Hugonnet S, Donnen P et al. Definition and characterization of localised meningitis epidemics in Burkina Faso: a longitudinal retrospective study. BMC Infect Dis 2012;12:2.
27 Paireau J, Girond F, Collard J-M et al. Analysing spatio-temporal clustering of meningococcal meningitis outbreaks in Niger reveals opportunities for improved disease control. PLoS Negl Trop Dis 2012;6:e1577.