The sub-lethal and reproductive effects of acute and chronic exposure to flowback and produced water from hydraulic fracturing on the water flea Daphnia magna
Tamzin A. Blewett1*, Perrine L.M. Delompré1*, Yuhe He1, Erik J. Folkerts1, Shannon L. Flynn2,
Daniel S. Alessi2, Greg G. Goss1,3
1
Department of Biological Sciences, University of Alberta, Edmonton, Alberta, Canada
2
Department of Earth and Atmospheric Sciences, University of Alberta, Edmonton, Alberta,
Canada
3
National Institute for Nanotechnology, 11421 Saskatchewan Drive, Edmonton, Alberta, Canada
Corresponding author: Tamzin Blewett
tamzin.blewett@ualberta.ca Department of Biological Sciences University of Alberta
Edmonton, AB T6G 2R3
Supporting information (5 pages)
3 Tables : Exposure water chemistry and primer information
1 Figure : Relationship between oxygen consumption and neonate production
ICP QA/QC
Samples were analyzed as the average of 5 replicates each composed of 300 sweeps. After each run blank and standard counts were compared to previous run to ensure consistency and detect if
contamination had occurred. Instrumental drift was accounted for and corrected using an internal standard solution of 0.5 ppm indium solution in 2% nitric acid added to the sample using an online internal standard addition kit. After every 12 samples, blank and midrange standards were rerun to detect instrumental buildup of elements and as secondary check of instrumental drift. Replicate standards were found to vary by ± 4.9% through duration of a run. All standard curves
had R2>.98.
Table S1. Measured water chemistry (via ICP MS/MS) of FPW, control water, and estimated (Est.) elemental concentration in FPW if diluted in 18MΩ water, where TDS = total dissolved solids, TN = Total nitrogen TC= Total carbon. Reported values are means ± S.E.M, N=4.
Undiluted Control Est. FPW 0.004% Est. FPW 0.008% Est. FPW 0.04% (ppm) (ppm) (ppm) (ppm) (ppm) TDS 182533 7.30132 14.60264 73.0132 Na 59500 11.1 ± 2.3 2.38 4.76 23.8 Ca 6500 50.1 ± 2.5 0.26 0.52 2.6 K 2160 1.34 ± 0.2 0.0864 0.1728 0.864 Sr 931 0.5 ± 0.009 0.03724 0.07448 0.3724 Mg 706 13.9 ±0.7 0.02824 0.05648 0.2824 Br 297 - 0.01188 0.02376 0.1188 B 96 0.01 ± 0.0006 0.00384 0.00768 0.0384 Li 51.3 BDL 0.002052 0.004104 0.02052 Mn 7.32 0.01 ± 0.0002 0.0002928 0.0005856 0.002928 Ba 7.28 BDL 0.0002912 0.0005824 0.002912 Zn 1.24 BDL 0.0000496 0.0000992 0.000496 Fe 1.19 - 0.0000476 0.0000952 0.000476 TC 737 - 0.02948 0.05896 0.2948 TN 425 - 0.017 0.034 0.17 Cl 107000 - 4.28 8.56 42.8
Table S2. Measured water chemistry (via ICP MS/MS) of control, SW, AC and FPW exposure waters (mg/L). Means are ± SEM (N = 6, water taken over the course of 21 days). BDL = means below detectable limit calculated as 3x the blank counts
Ion concentr ation (mg/L) Detectio n Limit Control SW 0.004% SW 0.008% SW 0.04% AC 0.004% AC 0.008% AC 0.04% FPW 0.004% FPW 0.008% FPW 0.04% Na 0.67 11.1 ± 2.3 18.1 ± 0.2 21.1 ± 0.8 42.1±1.4 18.2 ± 0.8 21. 6 ± 0.3 40.0 ± 1.4 17.1 ± 1.2 20.4 ± 1.3 42.1 ± 1.5 Ca 0.0022 50.1 ± 2.5 54.1 ± 0.5 55.1 ± 0.7 60.8 ± 1.2 55.4± 1.0 54.6 ± 0.7 60.9± 3.2 61 ± 1.0 56.7 ± 1.2 60.1 ± 0.88 K 0.67 1.34 ± 0.2 2.3 ± 0.03 2.4 ± 0.02 2.6 ± 0.2 2.3 ± 0.03 2.27± 0.26 3.3 ± 0.2 2.7 ± 0.2 2.6 ±0.1 3.4 ± 0.1 Sr 0.0004 0.5 ± 0.009 0.5 ± 0.003 0.5 ± 0.002 0.5 ± 0.001 0.6 ± 0.007 0.6 ± 0.0007 0.9 ± 0.02 0.6 ± 0.006 0.6 ± 0.005 0.9 ± 0.003 Mg 0.042 13.9 ±0.7 15.2 ± 0.1 15.2±0.3 15.8 ± 0.3 16 ± 0.3 15.6 ± 0.2 15.3 ± 0.3 15.8 ± 0.2 15.6 ± 0.2 15.8 ± 0.3 Li 0.0027 BDL BDL BDL 0.02 ± 0.0004 0.005 ± 0.0003 0.02 ± 0.0009 0.02 ± 0.0005 0.005 ±0.0001 0.007 ± 0.0008 0.02 ± 0.0005 B 0.0079 0.01 ± 0.0006 0.01 ± 0.0003 0.01 ± 0.0001 0.05 ± 0.0.0004 0.02 ± 0.0008 0.03 ± 0.002 0.05 ± 0.0009± 0.02 ± 0.001 0.02 ± 0.0006 0.05 ± 0.0004 Ba 0.0016 BDL 0.07 ± 0.0003 0.06 ± 0.0002 0.07 ± 0.0005 0.07 ± 0.0006 0.06 ± 0.0006 0.07 ± 0.0009 0.07 ± 0.0004 0.07 ± 0.0005 0.07 ±0.002 Mn 0.00032 BDL 0.01 ± 0.0001 0.01 ± 0.0001 0.01 ± 0.0002 0.01 ± 0.0001 0.02 ± 0.001 BDL BDL BDL BDL Zn 0.011 BDL BDL BDL BDL BDL BDL BDL BDL BDL BDL Cu 0.00048 BDL BDL BDL BDL BDL BDL BDL BDL BDL BDL Ni 0.00021 BDL BDL BDL BDL BDL BDL BDL BDL BDL BDL Br 0.12 BDL BDL BDL BDL BDL BDL BDL BDL BDL BDL
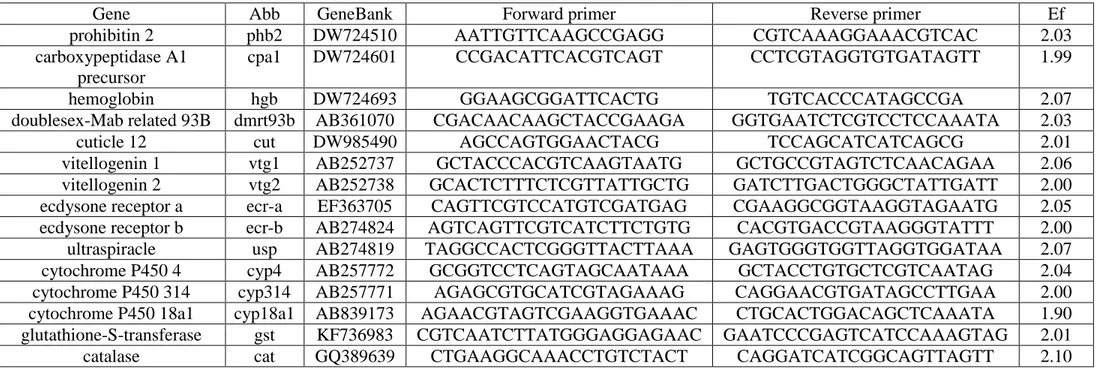
Table S3. Forward and reverse primers, and their efficiency (Ef), for assessed genes.
Gene Abb GeneBank Forward primer Reverse primer Ef
prohibitin 2 phb2 DW724510 AATTGTTCAAGCCGAGG CGTCAAAGGAAACGTCAC 2.03
carboxypeptidase A1 precursor
cpa1 DW724601 CCGACATTCACGTCAGT CCTCGTAGGTGTGATAGTT 1.99
hemoglobin hgb DW724693 GGAAGCGGATTCACTG TGTCACCCATAGCCGA 2.07
doublesex-Mab related 93B dmrt93b AB361070 CGACAACAAGCTACCGAAGA GGTGAATCTCGTCCTCCAAATA 2.03
cuticle 12 cut DW985490 AGCCAGTGGAACTACG TCCAGCATCATCAGCG 2.01
vitellogenin 1 vtg1 AB252737 GCTACCCACGTCAAGTAATG GCTGCCGTAGTCTCAACAGAA 2.06
vitellogenin 2 vtg2 AB252738 GCACTCTTTCTCGTTATTGCTG GATCTTGACTGGGCTATTGATT 2.00
ecdysone receptor a ecr-a EF363705 CAGTTCGTCCATGTCGATGAG CGAAGGCGGTAAGGTAGAATG 2.05
ecdysone receptor b ecr-b AB274824 AGTCAGTTCGTCATCTTCTGTG CACGTGACCGTAAGGGTATTT 2.00
ultraspiracle usp AB274819 TAGGCCACTCGGGTTACTTAAA GAGTGGGTGGTTAGGTGGATAA 2.07
cytochrome P450 4 cyp4 AB257772 GCGGTCCTCAGTAGCAATAAA GCTACCTGTGCTCGTCAATAG 2.04
cytochrome P450 314 cyp314 AB257771 AGAGCGTGCATCGTAGAAAG CAGGAACGTGATAGCCTTGAA 2.00
cytochrome P450 18a1 cyp18a1 AB839173 AGAACGTAGTCGAAGGTGAAAC CTGCACTGGACAGCTCAAATA 1.90
glutathione-S-transferase gst KF736983 CGTCAATCTTATGGGAGGAGAAC GAATCCCGAGTCATCCAAAGTAG 2.01
MO2 (
mol/daphnia/h)
0.006 0.008 0.010 0.012 0.014 0.016 0.018 0.020Aver
a
g
e
n
e
o
n
a
te
s
p
ro
d
u
c
e
d
p
e
r d
a
p
h
n
id
0 20 40 60 80 100Figure S1. The average neonate production correlating with oxygen consumption in Daphnia
(µmol/Daphnia/h), means are ± S.E.M, p =0.001, R2 = 0.76