Analysis of
£
PHi/PH/1 Queuest
Gabriel R. Bitran * S. Dasu **
MIT Sloan School Working Paper #3115-90-MS
January 1990
* Massachusetts Institute of Technology
Sloan School of Management
Cambridge, MA 02139
** Anderson Graduate School of Management
Universitv of California
Los Angeles, CA 90024
t This research has been partially supported by the Leaders for Manufacturing
Program at MIT, and by the UCLA Committee on Grants #99.
Sriram Dasu **
Abstract: In this paper we analyze a queue to which the arrival process can be depicted as the transition times on marked arcs in a finite Markov chain, and the service process is a phase distribution. We use the term generalized phase process (GPH) to denote point processes that can be depicted as the transition times in a finite Markov chain. Special cases of GPH are renewal processes with inter-renewal times distributed as phase distributions, and superposition of phase renewal processes. Performance measure studied include the moments of the number in queue as seen by each customer class, and the first two moments of the waiting time for each customer class. We derive a system of differential equations whose solution gives the waiting time distribution. We also characterize the asymptotic tails of the waiting time distribution and the distribution of the number in queue. The stationary interval distribution of the departure process and the correlation in the departure process are also derived.
* Massachusetts Institute of Technology Sloan School of Management
Cambridge, MA 02139
** Anderson Graduate School of Management University of California
Los Angeles, CA 90024
t This research has been partially supported by the Leaders for Manufacturing Program at MIT, and by the UCLA Committee on Grants #99.
1. INTRODUCTION
In this paper we analyze a queue to which the arrival process can be depicted as the
transition times on some marked arcs in a finite Markov chain, and the service process
has a phase distribution (Neuts 81). We use the term neraized phase process (GPH)
to denote point processes that can be depicted as the transition times in a finite Markov
chain. Special cases of GPH are renewal processes with inter-renewal times distributed
as phase distributions, and superposition of phase renewal processes. The superposition
of generalized phase processes can also be depicted as a generalized phase process. Point
processes closely related to GPH have been studied by several researchers including
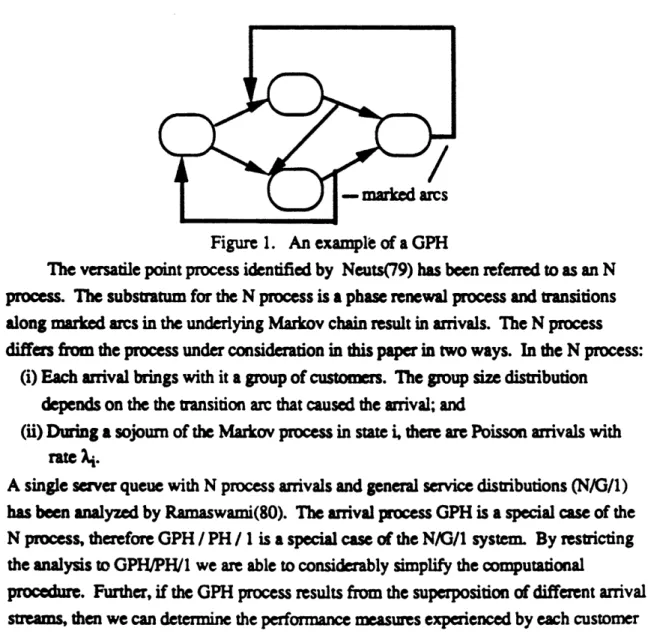
Rudemo73), Neuts(79), Ramaswami(80). Figure 1 depicts a generalized phase
process.
Figure 1. An example of a GPH
The versatile point process identified by Neuts(79) has been referred
toas an N
process. The substratum for the N process is a phase renewal process and transitions
along marked arcs in the underlying Markov chain result in arrivals. The N process
differs from the process under consid
on in this paper in two ways. In the N process:
(i) Each arrival brings with it a group of customers. The group size distribution
depends on the the transition arc that caused the arrival; and
(ii) During a sojourn of the Markov process in state i, ther are Poisson arrivals with
rate i.
A single server queue with N process arrivals and general service distributions (N/G/l)
has been analyzed by Ramaswami(80). The arrival process GPH is a special case of the
N process, therefore GPH / PH / 1 is a special case of the N/G/i system. By restricting
the analysis to GPH/PH/1 we are able to considerably simplify the computational
procedure. Further, if the GPH process results from the superposition of different arrival
streams, then we can determine the performance measures experienced by each customer
class. In addition we can determine useful characteristics of the departure process from
these queues.
Our primary motivation for studying GPIH/Pt1 queues is to facilitate the analysis
of queueing networks. In queuing networks the arrival process at any node is the
superposition of departure streams from one or more nodes in the network. If each of the
departure streams are assumed to be (i) generalized phase processes and (ii) mutually
independent, then the arrival process at each node is a generalized phase process. In the
decomposition procedure which has been effectively employed for (approimately)
analyzing queueing networks, each departure stream is assumed to be a renewal process
and the different streams are assumed to be independent (Shantikumar and Buzacot (81),
Whitt (82, 83), Bitan and Tirupati (88)).
Since we restrict the service process to be a Phase distribution, it is useful to note
that this class is known to be a dense subset of all distributions of non-negative variables
(Neuts(81)). Also, in the parametric decomposition mehod the two moment
approximations for the stationary interval of the departure process and the superposition
of renewal processes, and the approximations for the moments of the stationary queue
length distributions are largely based on the behavior of Erlang and Hyper-exponential
distributions. These distributions ar special cases of the Phase distribution.
One of the earliest papers on departure processes is that of Burke(56) who showed
that the departure of a stable M/M/n system is Poisson. A detailed discussion of Poisson
processes in queueing networks can be found in Melemad(79). Daley(75) has reviewed
results concerning the departure process of general queueing systems G/G/n. This
review has been updated by Disney and Konig(85).
The description of the departre process is usually in terms of the interdeparture
intervals, tacitly assumed to be stationary. Most of the results in this area characterize
the distribution of inter-departme intervals. Very few results are available which study
the covariance of inter-departure intervals, and the variance of the counting process (that
counts the number of departure over some time interval).
Finch(59) derived a simple expression for the joint distribution of two consecutive
inter-departure times for M/G/l queues. Daley(68) analyzed the covariance between pairs
of inter-departure intervals for M/G/1 and G//1 queues; he also showed that in a stable
M/G/I system the covariance of adjacent intervals is at most 0.5 e-l. This bound is
achieved in an M/D/l system with utilization approaching 1. However, this covariance
can be arbitrarily close to -1. Disney and de Maias(1976) explored the autocovariance
of the output from an M/Ek/IJ
queue. In this pape we derive the staionary interval of
the departure process, and the cotelation between adjacent departure intervals from a
GPI/PH/1 queue.
The results to be presented in this paper can also be used for developing and testing
approximations for the superposition of renewal processes and for departure processes.
The goodness of the approximation can be detnmined by computing the actual
performance measures using the procedures that we propose instead of simulations
(Whitt 82,83a and 84). Thus the developments in this paper are particularly useful for
queueing network analysis. These results are also of independent interest in that it is not
uncommon for the aival process to result from the supepaposition of different arrival
streams.In the remainder of this paper we resict the analysis to a special case of the
generalized phase process - a process resulting from the superposition of two phase
renewal processes. The results can be extended in a straightforward manner to other
general phase processes, and the superposition of general phase processes. We use the
notation
£
PHi to denote superposition of phase renewal processes. Appendix 1
contains a farmal description of phase distributions and phase renewal processes.
In section 2 we describe the structure of the Markov process that depicts the
queueing system. Then we identify alternate procedure for detmining the steady state
probabilities of this Markov process The perfmnce measures of the queueing system
are derived in section 3. The performance measures derived here include the moments of
the number in queue as seen by each customer class, and the first two moments of the
waiting time for each customer class. We also derive a system of differential equations
whose solution gives the waiting time distribution. In section 4 we characterize the
asymptotic tails of the waiting time distribution and the distribution of the number in
queue. The waiting time distribution is asymptotically exponential and the distribution of
the number in queue has a geometric tail. The departure process is studied in section 5,
and section 6 contains an illustration of the analysis.
2.
£
PHi / PH/ 1 QUEUE
Consider a queueing system in which two classes of customers arrive. Assume that
the inter-arrival times for each class is a phase renewal process Let the inter-arrival times
for customer class i be a phase distribution characterized by [ a
i, T
i, TOil. Let the serviceprocess be the phase distribution that has parameters [, S, SO] Let T
ibe an m
ix m
imatrix and S an s x s matrix. Further assume that the representations of the arrival
processes and the service process are irreducible.
Consider the Markov chain that corresponds to the queueing process. This chain
has states (nijk). n signifies the number in the system, i the state of the arrival process
1, j state of the arrival process 2, and k is the state of the service process. The states are
listed in that lexicographic order.
The generator for this Markov process has the following sucture
AOCO 0 0
A1B COO { A B C 0
OABCO
Where AO, A, Al, B, C, CO, O are matrices.
AO = T1W T2 Al = I0S ° A = ol OT2 S B = T1 T2
@
S C = Tal 1 T2Oa2O
s CO s (TCOI alT 2Oz2)V
A@B
: Kronecker sum of the matrices A and B
AB
: Knecker product of the matrices A and B
Os (Or): zero matrix of the same dimension as S (Ti)
I
T: Identity matrix of size mlm
2The steady state probabilities are given by a nonnegative vector U that satisfies the
following conditions: UQ = 0, Ue = 1, U
>0. For convenience partition the vector U
PROPOSITION 1:
Let A* - A + B + C, and x solve rA* = 0, xe = 1, xc20. Then the above Markov chain is positive recurrent if xCe < xAe.
Proof: Theorem 1.7.1 page 32 Neuts(81)
COROLLARY 1
Let gt be the mean service time and let L1and L2 be the mean inter-arrival times for the
two arrival streams. If I -1 > L1-1 + L2 -1 then the Markov chain is positive rcurrent.
Proof: LetA*= A+B+C, and
A - Orl On SOP
B = T T2 3 S
C = TlOal ET2o 2 Os
Therefore
A* = (T1 + TlOal) $ (T2 + T2Oac2) (S +SoP). [ 1]
Let f solve f(S +Sof ) = 0, fe = 1, f 2 0, then f is the vector of steady state probabilities of the phase renewal process corresponding to the service processes. Consider the matrix - S-l, element (ij) of this matrix is the expected amount of time spent in state j before reaching the absorption state, given that we begin in state i Hence f = ( S-I)/ ( S-le). Similarly let gi solve gi (Ti + Ti°ai) , gi e = 0, gi 0.
Then gi = (iTj-1)/ (aTi -1 e).
By [eq 1] and propety of Kronecker sum of malrices (Bellman 60) we have (glg 2
f)
A*=O, (gl@g26fe= 1, gl@g2f
0.Therefore X = gl0 g2 f
xAe (gl g2® f) ( Or@ S On SOP )e fSO es= fSO
Since Se + S = 0, S-l SO= -e implies that fSO = - ([ S-le)-l Therefore zc Ae -( S-le) -1 = L-1.
Similarly Ce = L - + L21 .
Henceforth we assume that the Markov chain is positive recurrent and irreducible.
2.1. Solution Strategies
There are at least two swategies for finding the steady state probabilities for our queueing system.
(1) Aggregation Procedures:
In this approach the system of equations UQ = O, Ue = 1, U 2 0 is solved using
iterative produres such as successive over relaxation or aggregation-disaggregation
algwoithms ( Takahashi and Takami 76, Seelan 86). Seelan has developed and
implemented an iterative procedure for Pb/Pb/c queues which incorporates the basic
principles of successive overrelaxation and aggregationdisaggregation. In aggregation
-disaggregation algorithms all the micro-states corresponding to a specific number of
customers in the system are lumped together and viewed as a macro state. The system of
equations describing the steady state probabilities of the Markov chain with only
macro-states has a structure like that of an M//c queue. At each step of the
aggregation-disaggregation algorithms, a solution is found for the aggregated states. Then for each
block of disaggregated micro-states, an attempt is made to derive a solution that is
consistent with the aggregate solution. Seelan(S6) adapts the basic ideas of
disaggregation- aggregation algorithms by making the relaxation factor in the point
successive over relaxation method depend on the aggregate solution. With his
algorithm, Seelan(86) analyzed 30,000 Ph/Pb/c queues, with finite and infinite waiting
rooms. The largest queue he analyzed involved finding a solution for a system of
150,000 linear equations. In every case his algorithm converged.
(2) Matrix Geometic Procedures:
Let R be the minimal non negative solution
tothe. following matrix polynomial
equation:
R
2A+RB+C =0
[2]
R is a square matrix of size mlm
2s. The element (ij,k; p,q,r) is the expectedamount of time spent in state (p,q,r) with n +1 jobs in the system before the first rerurn to
a state with njobs in the system. The chain begins in state (ijk) with n jobs in the
system (Neuts 81). Since the matrices S, T
1and T
2are irreducible, we assume that R is
non negative. Since the queue is positive recuret and irducible the spectral radius of
R lies strictly between 0 and 1 (Neuts 81). It is well known that the steady state
probabilities satisfy the relationship
This approach makes use of the fact that the microstates, when partitioned into blocks on the basis of the number in queue arc related to each other through equation 3. Hence, instead of solving the large system of equations, UQ = 0, Ue = 1, U 2 0, iterative techniques are used to solve for the Matrix R (Asmussen (87), Lucantoni and Ramaswami (85)).
The steady state probabilities of the number in the system am obtained by following these 2 steps:
STEP 1: Find the matrix R which solves the equation R2A + RB + C = 0. The matrix R is computed through a simple recursive procss Let D be a diagonal matrix famed with the diagonal elements of B. Since the diagonal elements of B are strictly negative, D has an inverse. We can rewrite the polynomial equation as
R = - R2AD-1 - RBD-1- CD-I . Let Rk be the value of R at the nth iteration, of the itrative algorithm:
Rk = -Rk.12AD- 1- Rk.IBD- - CD-1.
The algorithm is initialized by setting R equal to - CDI . The iterative procedure is
terminated when max IR R < . Where R~? is the ij element of matrix Rkand £is a small constant. Since the spectral radius of R is less than 1 the iterative technique converges to the correct value of R (Asmussen 87).
STEP 2: uo and ul are obtained by solving the system of linear equations uo AO + ul Al =0;
uoCO+ ul (B + R A) =0; uoe = -p.
For n > 2, un ulR 1l. p is the utilization of the server.
This method has several advantages as compare to the iteative techniques. The storage space requirement and the computational burden are significantly lower in this approach. Several queueing performnnance measures such as the moments of the number in queue can be expressed in terms of the matrix R.
In the remainder of this paper we assume that the steady state probabilities have been computed using one of the techniques described above. We then show how to compute the performance measures of the queue based on this information.
3. PERFORMANCE OF THE QUEUEING SYSTEM
3.1. Distribution Of The Number In Queue
The distribution of the number as seen by a virtual customer is given by the vector U. We can also compute the distribution of the number of jobs as seen by each job class. Let Vj(n) be a vector such that its kth element is the probability that an arriving job of class j finds n jobs in the system and the service process in phase k .
PROPOSITION 2:
Vj(O) - Lj uo [1 j(i)TlOal 9 aj(2)T20 2 I1 j - 2
[S1
Vj(n) - Lj un [aj()TlOal $ aj(2)T 2Oa2 @ O [eT r Is] 1 j 2, n 1 [61
eT = column vector of s of dimension m1m2
Is = Identity matrix of size s
aj(h)
= 1ifj
= h; otherwise 0Lj = Mean inter-arrival time for arrival stream j.
If we allow V(n) to be the vector of probabilities that an arriving customer (arbitrary class) finds n customers in the system. Then:
V(n) = (L + L2) -1 (L1L2) Un C [ eT Is [7]
Proof: Consider [eq 5]. [ aj()TlOal @ aj(2)T Oa2 2] e is the arrival rate of job classj
given that the system is empty and u is the probability that the system is empty. Lj,
the mean inter-arrival time is the normalizing constant [eq 6] and [eq 7] are similarly
derived. Note that Vj(O) is a scalar.
3.1.1 Average Number In System
If we explicitly solve for the steady state probabilities then it is straight forward to compute the moments of the number in queue as seen by a virtual customer, or an
arriving customer. The moments can also be expressed in terms of the matrix R. Recall that the spectral radius of R lies strictly between 0 and 1. Let E(N) denote the expected number in system and E(N2) the second moment of the expected number in the system. Then:
E(N) = une = nu Rn le = ul(I- R)-2e 1 8] n =1 n =1
E(N2
)=
n2une =n
2uRn-le - ul( I + 2R(I- R) l)(I-R)-2e
9n =1 n=1
3.1.2 Average Number Of Jobs Found By Each Cass
Let j be the number of jobs found by a job belonging to class j. Then
00
E(j) = nVj(n)e = Lj ul[I - RI-2[j()TOal
$
aj(2)T2Oa2·
O] e [10]n =1
n n2Vj(n)e = Ljul( I + 2R(I- R) -1) (I-Rj-[Iaj(l)TlOal @ aj(2)T2
Oa
2$
Oe[11]
n =1
Let N be the number of jobs found by an arbitrary job. Then
E(j) = (L1 + L2) -1 (LIL2)u[I -R]-2 Ce [12]
E(~j) = (L1 + L2) -1 (LL 2)l ( I + 2R(I - R)) (I-R)-2Ce [13]
3.2 Waiting Time Distributions
The first moment of the waiting time can be obtained from the average number in queue using Little's law (Kleinrock(75)). The second and all other moments of the waiting time can also be computed once R, u and u are obtained. The second moment of the time in the system for an arbitary customer is deived below.
Let
erT = column vector of s of size mi
IU(i,n) = probability that an arriving customer finds n in the system and the service process in state i
U(n) = vector with elements U(i,n)
W(i,n) = random variable corresponding to the time in the system for a customer who upon arrival finds n in the system and the service process in state i W = random variable crresponding to the time in the system for a customer I = (L1 + L2) /(L IL 2) the arrival rate to the queue.
IL = expected service time
l0(i) = expected remaining service time given that the service process is in state i ,U = vector with elements .u(i)
i&"(i) = second moment of remaining service time given that service process is in state i
I," = vector with elements "(i)
= [ TiO@ eTl + e OT20] Is Then L(0) = V(O) U(n) = -1 ul [R] 1 n 2 1 L = -S-le " =2 S-2e
E(W2(i,n)) = 2nKU(i)g + nl" + "(i) + (n2-n)g2
00 oo
E(W) = =1 F(in) E(W2(in)) + V(O) "
V(O) l"+ A
-1
ul [I - R] -14 a" + 2 gX -1 ul [I - RI -14 U + ED(("-lg 2) +E 2 )12 [14]Although the moments of the waiting time can be computed, it is difficult to compute the waiting time distribution. The waiting time distribution can be analyzed as a Markov chain with a single absorption state 0 (number in the system) and infinitely many transient
states (n,k). Where n is the number in the system and k is the state of the service phase. Since under the first come first served priority rule the waiting time is not influenced by subsequent arrivals we need not worry about the state of the arrival process.
The generator for the Markov chain c sponding to the waiting time distribution is given by:
0000
A'e B' 0 0 0 A' B' 0 O 0 A' B'
Where A'= SOP B'= S
The starting probabilities for this Markov chain are given by Vj(n) and V(n) for the waiting time distribution for job class j and for an arbitrary job, respectively. In the case
of a virtual job the starting probability is given by un[ eT Is ]. This representation is
useful primarily for deriving the tails of the waiting time distribution. It is otherwise computationally intractable.
Perhaps the easiest procedure for computing the waiting time distribution is through a system of linear differential equations.
PROPOSITION 3
Let Zij (x) be a vector of size s and Wij(x) a scalar such that W'ij(x) W(x) [ T T2]ij - Zij(x) So
Z'ij(x) = Zij(x)S + W(x) Tloal T2Oa2]i jP. [15]
Zij(O) =0; and W(O) = uo
Where: W(x) is a vector whose elements are Wij(x). W'(x) is the derivative of W(x) with respect to x. Z(x) is the derivative of Z with respect to x. [ T1@ T2]ij is the
(ij)th element of the matrix [ T1@ T2].
Then the probability of the system having x units of work is given by:
P(x)= W(x)e [16]
The probability that an arriving customer waits x units is given by
P*(x) = A-1 W(x) [T1Ooa1 T2Oct2]e [17]
Proof:
We derive this result via the Chapman Kolmogorov equations. The term Wij(x) has the probabilistic interpretation that a virtual job finds x units of work in the system and the arrival process is in state (ij). Consequently:
Wij(x) = ( Wpq(x)Prob(of going from state p,q to ij)
P,q
+ Wpq(u) Probarrival occurs when in state p,q and arrival leads into state i, j]
P q
Prob[additional work brought in by new arrival = x -u] du This can be rewritten as:
W'ij(x)
- - W(x) [ T1$ T2]ijLet Zij(x) = W(u) [T°al T2a2]ij PEXP(S(x-u))S0 du
Then Zij(x) = Zij(x)S + W(x)[Tl°al 9T2O°a2ij3. [191
Equations 18 and 19 prove the proposition.
In view of the difficulty in computing the waiting time distributions it is necessary to develop approximations. We are in a particularly good position to develop
approximations, because of our ability to compute the moments of the waiting time and the probability of an arriving customer finding the system empty. The quality of the approximations can be improved if we also know the tail of the waiting time distribution. The knowledge of the tail is also useful if we wish to assess the probability of a job
spending a very long time in the queue. Typically service level constraints are stated in tems of the tails of the waiting time distribution.
The system of equations UQ = 0, Ue = 1, U a 0 is of infinite dimension for a queue with infinite waiting room. In order to solve these equations using iterative techniques such as those used by Seelan, we need to truncate the system. The knowledge of the tails of the number in queue, is useful for determining the error
resulting from truncation. For all these reasons in the next section we derive the tails of the number in queue and the waiting time distribution.
4. TAIL DISTRIBUTIONS
In this section we derive the tail distributions by employing techniques developed by Takahashi (81). We already know that un = UlRn-l, and R is a positive matrix Thus by Perron -Frobenius theory (Ganmacher (59), Takahashi(81))
Lim n o, un - K*Bn-l +O(Bn)
Where B is the Perrn -Frobenius eigenvalue of R and K* is a function of u1and the
right and left Frobenius eigenvectors of R.
For the purpose of deriving K* and B we will state without proof two results.
PROPOSITION 4:
Here t and d are positive scalars. d is chosen to be sufficiently large so that M(t) is non-negative. Since all the representations are irreducible we will assume that there exists an integer n such that [M(t)]n is positive. Let o(t) be the Perron Frobenius eigenvalue of M(t). Then the unique solution to o(t) = t in the open interval (0,1) is the Peron Frobenius eigenvalue of R.
Proof: Neuts(1981) lemma 1.3.4 page 17.
The Laplace -Stieltjes transform of a phase distribution with representation [ ct, T, TO ] is given by F*(s) = a(sI - T)-ITO. We assume that s is real. Clearly F*(s) is a monotone function of s. For s> 0 F*(s) is less than 1. F*(s) takes on finite values for s > y, where y is some negative number. For s in (y,O) F*(s) > 1.
Given any t > 0 let Q(t) be such that F*(LZt)) = l/t. Since F*(.) is monotone there is one to one correspondence between t and Q(t). If t > 1 then Q(t) > 0 and if t< 1 then Q(t) <0. Further, let g(t) =
ca(
Q(t)I - T)-1PROPOSITION 5: Fort>0
(1) g(t) is positive.
(2) For the matrix (t TOa + T), g(t) is an eigenvector and the corresponding eigenvalue is f(t). Thus g(t)(t TOot + T) = Q(t)g(t).
Proof: That g(t) is positive follows from the fact that (sI - T)-I is positive for s > y. Claim (2) is derived by direct substitution. ( For more details please refer to Proposition 2.1 Takahashi (81)).
PROPOSITION 6:
Let Q(t), and gi(t) correspond to the arrival process i; and Qs(t) and gs(t)
correspond to the service process. The Penon-Frobenius eigenvalue of R denoted by B is such that 0 < 1 and
nl(1/B)
+ f 2(1/B) + Qs(B) = 0 [21]Proof: Define the matrix M*(t) = ( tA + B + (/t)C). Then M*(t) can be rewritten as:
M*(t)=(T1 + (1/t)Tla 1)
*
(T2 + (1/t)T2Oa2) · (S +tSO ). [221(Note that this rearrangement of terms is the same as that used in eq 1). Recall from Proposition 1 that if (ai, fi) ar the eigenvalue and eigenvector for matrix Xi. Then for
X1 X2 , al + b2 is an eigenvalue and f I @ f2 is the corresponding cigenvector
(Bellman 61).
The above fact, together with Proposition S leads us to the result that an eigenvalue of M*(t) is il(A/t) + Q2(1/t) + Ds(t), and the corresponding eigenvector is gl(1/t)0 g2(1/tA) gs(t). We denote this eigenvector by g(t) and the eigenvalue by Q(t). Note that for t > 0, g(t) is positive.
Any eigenvector of M*(t) is also an eigenvector of M(t). Therefore g(t) is a positive eigenvector of M(t). The corresponding eigenvalue is d- lg(t)t + t. By the uniqueness of positive eigenvectors of the matrix M*(t) (Gantmacher 59) dlg(t)t + t must be the Perron-Frobenius eigenvalue of M*(t). In other words 0(t) = d-lg(t)t + t But by Proposition 4 the Perron-Frobenius eigenvalue of R is equal to the t that solves 0(t) = t. We therefore require g(B) = 0. This proves the proposition.
PROPOSITION 7:
Lim n - Un -4 [ul,z] B n-l f*+ (Bn)
where z is the right Perron-Frobenius eigenvector of R, B is the Perron-Frobenius eigenvalue of R, and f* is the left eigenvector of R. f* is normalized such that f*e = 1. [u ,z] is the inner product of u and z
Proof: Follows directly from the Perron-Frobenius theorem
PROPOSITION 8:
f* -B(1 -B)-39l(1/B)f 2(lB) 2 s(B) g (1/ g2(/B) gs(B) (1/B) [23]
Proof: To establish this claim we need to show that f* is a positive eigenvector of R and that f*e = 1. f* is positive because all terms in eq 23 are positive, except Qs(B). Since R solves R2A + RB + C = 0, a positive eigenvector B of R is an eigenvector for M(B). By the uniqueness of the positive eigenvector for M(B) (up to a scalar multiple) we require g(B) to be the eigenvector for R. Hence f* is an eigenvector for R. At this point all that remains to be shown is that f*e 1. For this we merely note that
Remark: Proposition 6 can be derived without using Proposition 4. Proposition 6 can be derived from Perron-Frobenius theory using arguments based on the uniqueness of positive eigenvectors and the fact that R solves the matrix polynomial equation.
In this section we have derived the tail of the number in queue as seen by a virtual customer. The key to this end is deriving the Perron Frobenius eigenvalue of R. To compute B we need to invert the Laplace transform of the phase distributions. Since the phase distributions are a subset of the distributions with rational Laplace -Stieltjes transforms, to compute the tail probabilities we have to solve a system of polynomial equations.
At this point we are in a position to derive the tail distributions as seen be an arriving job, and also by each job class.
4.1 Tails Of The Waiting Time Distribution
The knowledge of the tail of the waiting time distribution is useful in answering questions regarding the likelihood of a job spending a long time in the system. It is also helpful in developing approximations for the waiting time distribution. This is
particularly valuable because the later is difficult to compute exactly.
Recall that the waiting time distribution can be analyzed as a Markov chain with a single absorption state 0 (number in the system) and infinitely many transient states (nk). Where n is the number in the system and k is the stat of the service phase. The
generator for this Markov chain is:
10000 A'eB' 0 0 '=
O
A' B' O O A'B' Where A' SP B' SThe starting probabilities for this Markov chain are given by Vj(n) and V(n) for the waiting time distribution for job class j and for an arbitrary job , respectively. In the case of a virtual job the starting probability is given by un[ eT @ Is].
By [eq 7] we have:
Combining this with Proposition 6 gives us: Lim n V(n)
-) -1 [UlZ] B n- f* [TlOal @ T2oa2 Os] [ eT Is] + (8n) [24]
If we now substitute for f* (as given by 23) into 24 and noting that gi(t) Ti° = l/t we get:
Limn -+ V(n) -+ k*Bn -I gs(B) + O(n)
By a straight forward application of theorem 6.1 of Takahashi(8 1) we get the
following proposition
PROPOSITION 9
Lim t-+ oo E(t)-+-sl(8) (1 8)-
2X
-1
[ulz] EXP[s(B)t] + O(e -ls(B)t)
[25]
Remark: The methodology used to derive Proposition 9 can be readily extended to derive the tails of the waiting time distribution for each job class. (Only the constants will change. The exponential rate will be the same)
S
DEPARTURE PROCESS
To utilize the analysis developed in this paper in a queueing network it is essential
to characterize the behavior of the departure process from these queues. In this section
we derive the stationary interval distribution of the departure stream and the correlation
between adjacent departure intervals of the queueing system. In order to determine the
stationary interval distribution we need to Iknow the probability of a departing customer
leaving the system empty and the idle period distribution.
PROPOSmTION 10
The idle period is distributed as the following phase distribution:
[A, T
1$ T2, (TO1
$T2 )el]
where i , the initial probability vector is given by:
I
=u1T SO]/(ulIT @SOe]
)[261
Proof: To establish this proposition we merely need to validate . Recall that the state
space of the Markov chain describing the queueing system is lexicographically arranged.
Accordingly elements in A are doubly indexed as (ij). Where i is the state of arrival
process 1 and j is the state of the second arrival process. The numerator of eq 26 is the
rate into each micro state corresponding to an empty system. The denominator is a
normalizing constanLPROPOSITION 11:
Let be the probability that a departing job leaves the system empty.
=
l-1
u(T
1T
2 )C[27
Proof:
A -1 u (T1° W T2O ) e is the probability that an aTiving customer finds the system
empty. The result follows from the fact that the probability of a departing customer
leaving the system empty is the same as that of an arriving customer finding the system
empty.
PROPOSITION 12:
The stationary interval of the departure process is given by the distribution
0, G, GO]. Where
0= 9(a , 0)+(l-) (0,)
G = 1(T1 tT2) (T1°T 2 °)e 1
Go-
I20I
Proof: This phase is the concatenation of the idle period distribution and the service
distribution. The rest follows directly from Propositions 10 and 11.
5.1 Second Moment of the Second Departure.
In this section we assume that the steady state probabilities of the number in queue
as seen by an arriving job, and a virtual job have already been computed. For ease of
exposition we adopt the following convention. Assume that at time zero job #0 departs
and we number the jobs in the sequence in which they are processed.
Let 2
: Time of second departure after time 0 (random variable)
z
: Number of jobs in system at 0
+(random variable)
S(r2) : Second moment of 2
T : T1IT 2,
To : TlOTal T2oC 2
(B, S, SO) : Representation of the service process
cO State of the arrival process at time 0+, given that there are zero jobs in the system.
cl : State of the arrival process at time 0', given that there is one job in the system.
We consider three cases for deriving the second moment of the time to the second departure after time 0.
Case : In the first case, there are 2 or more jobs in the system at time 0+. In which case the random variable x2 is the sum of two service times. Therefore,
S(' 2 I z 2) = 2" + 2 2 . [281
Case 2: In this case at time 0+ there is only 1 job in the system. Recall that the states of
the Markov process depicting the queueing system are indexed by the states of the arrival pFrocess and the state of the service process. They are numbered lexicographically. Under this notation, the state of the queueing process at time 0+ is given by
cl = u2[ I 0 SOB] / u21I 0SOB]e [291
U2 is the steady state probability vector for the block corresponding to 2 jobs in the system in the Markov chain depicting the queueing system (Section 6.1).
In case 2 processing of job #l begins at time 0+, and job #2 has not yet arrived at the machine center. Now there are two possibilities:
(i) Job #2 arrives before job #1 is completed; (ii) Job #1 is completed before job #2 arrives.
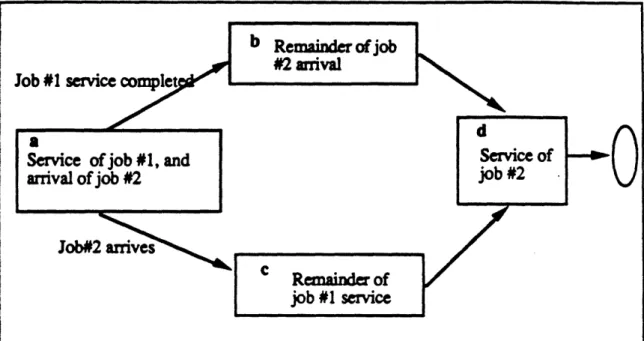
The Markov chain describing the time until the departure of job #2 can be divided into four blocks (Figure 2).
(a) Initially we have the superposition of the service process of job #1 and the arrival process of job #2;
(b) If the service of job #1 is completed prior to the arrival of job #2, then we have to account for the remaining portion of the arrival process for job #2;
(c) The third block corresponds to the case when the arrival of job #2 occurs prior to the
service completion of job #1. This block consists of the remainder of the service of job
#1; and
(d) Finally, we have the service of job #2.
Figure 2 Markov chain depicting the second deparure - case 2
The distribution of the time of departure of job #2 is distributed as a phase with
the representation (g', G', G). g'
=(cl1,0,0,0)
B
0
G'---0
0
Bo
BS T0
0
O OB0
BT °0
T
O S 0 G = 0 0 S$In these matrices, B = T S, B = I SO, B = 'Te I. Recall that the
second moment of a phase distribution (g', G', G) is 2 g (G')
2e. Therefore,
S( 2 IZ= 1) = "+ {9b" - 2cB-1 B
S-2 e
-2cl
B-1 BsT'
2e
+2 b' + 2 B 1 BTO S- 1e+ 2 B' 1 Bs 0T'
e
- 2cl B2 BTO S-l - 2cl B2 BSO T-1 e.
II
Service ofjob#l, and
arrival of job #2
Job#2 arrives
In this expression b' = - cl B 1 e; b"= 2cl B-2 e.
For ease of evaluating S( t2 z = 0), denote the right hand side of 28 as h2(cl). In other
words view the right hand side as a function of cl. Defmine hl(r) as follows: hl(r) =rB'1 BTO S-1 e + rB-1 BsO'e -rB-e + pe In this expression r is a column vector of size m1m2.
Case 3: In this case job #0 leaves behind an empty system, and so we have to wait for job #l to arrive. The Markov chain depicting the departure time of job #2 is obtained by concatenating the remainder of the arrival time of job #1 to the Markov chain of the previous case. Figure 3 shows the Markov chain for the departu time of job #2 .
Figure 3 Markov chain depicting the second departure - case 3 The departure time for job #2 is a phase distribution with representation
(g = (cO, O)
G"° O= G,00[
In this expression G0 0 = ( T @ B, 0 ). cO is the state of the arrival process at time 0+. cO = ul(I@ S° )/ ul(l S°)e [31]
The second moment is obtained by computing 2g"(G") -2e.
Let rl=COT' 2TO@p r2=-cOT' 1TO p
Job #1
Arrival
Then
S(2
Iz=0)
= 2cO 2e + 2hl(rl) + h2(r2) [321In section 3.1 we derived V(n), the probability that an arriving job finds n other jobs in
the system. Since the probability of a departing customers leaving n jobs in the system is
the same as the probability of an arriving job finding n jobs in the system, the second
moment of the random variable s2isS( 2 ) = V(0)S( 2 I z = 0) + V(1)e S( 2 I z = 1) + (1- V()e - V(2)e) S(t 2 z 2 2)
[33]
This completes the derivation of the second moment of the time for job #2 to leave
the system. Since the mean interdeparture time equals the mean interarrival time, the
variance of z2
and of the stationary interval can readily be computed This also allows us
to calculate the correlation between the first and second departure intervals after time 0. For
a few Ek/ E/ 1 queues we have computed this cxrelatio. The results are given in Table 1below.
QUEUEING SYSTEM UTIIfZATIONS
0.5 0.75 0.9
E
3/E
2/ 1-0.075325
-0.0518963
-0.0236492
M/E 2/1 0.0258706 0.0222857 0.0161865
E3/M/1 -0.0944171 -0.0530822 -0.0213184
TABLE 1 Correlation Coefficient between adjacent departure intervals
6 ILLUSTRATION
Consider a queue to which 4 classes of customers arrive. The arrival process of
each customer is as follows: (1) Poisson with rate 0.5; (2) Erlang order 2 with rate 0.5; (3)
Erlang order 2 with rate 0.25; and (4) Erlang order 3 with rate 0.33333. The service
process is Erlang order 2, and the utilization is 0.8. The perfonrmance measures for this
queue are given below.
Number in the System as seen by:
Virtual
Arbitrary
Customer Class
1
2
3
4
Mean
2.608093 2.453629
2.608093 2.394228 2.416226 2.339093
Second Moment 13.82417 12.86961
13.82417 12.53433
12.58205 12.15634
Third Moment
106.5421 98.85641
106.5421 96.23886 96.36546 93.12226
Observe that the most significant factor effecting the waiting time and the number
seen in the system is the squared coefficient of variation (scv) of the inter-anrrival time.
Although the arrival rate of class 2 is twice that of class 3, the difference in the
perfomance measues for these two classes is small The scv of the interarrival times of
class 2 and class 3 are the same. The moments of the number seen in the system and the
waiting time, decrease as the scv of the arrival process decreases.
Work in the system as seen by:
Virtual
Arbitrary
Customer Class
1
2
3
4
Mean
1.216722
1.141963
1.216722 1.113275 1.123487 1.086712
Second Moment 3.509428
3.266023
3.509428 3.180107 3.192954 3.084593
Third Moment
14.99879
13.91917 14.99879 13.54985 13.57171
13.11435
Departure Process:
Stationary Interval Moments
Second Departure Moments
: First: 0.6315789, Second: 0.6401151, Third: 0.9182002
: First: 1.263158 , Second: 2.071980
Spectral Radius of R:
B the spectral radius of R must be such that:
B = ((3.958333+w5)/3.958333)2, and wl + w2 + w3 + w4 + w = O0. These equations
are solved by: 8 - 0.6753872, wl - .24031607, w2 = .10840616, w3 = .2168122,
w4 = .139766, and wS = -0.7052982
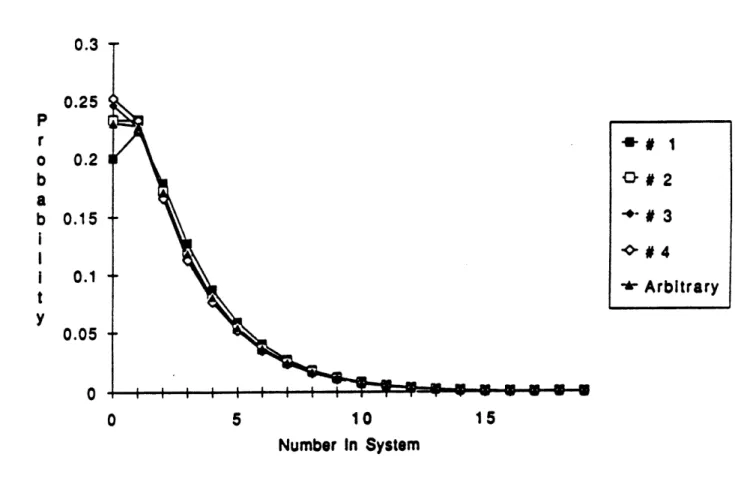
The disibution of the number seen in the system as seen by arriving customers is graphed in figure 4. Observe that the tails appear to be geometric, and the decay rate is the same for all the classes.
0 5 10 15
Number In System
Figure 4. Distribution of Number in System as seen by arriving customer 0.3 P r o b a b i I i t Y 0.25 0.2 0.15 0.1 0.05 I+-# *O# 2 -- 3 -0#4 -- Arbitrary 0
7.
CONCLUSIONS
In this paper we have developed a procedure for analyzing GPH/P1 queues. If
the arrival process results from the superposition of different classes, then we have shown
how to determine the performance measures as seen by each customer class. The analysis
was based on the assumption that the arrival process of each class was a phase renewal
process. This assumption can be relaxed without significantly altering the analysis. In fact
the procedure can readily be extended to the case in which we associate with each customer
class a subset of marked arcs of the GPH process. The procedur is straight forward to
implment, and therefore is a useful Iool for developing and testing approximations for
queues with complex arrival processes.
Within the decomposition frame-work (Shantikumar and Buzacot(8 1), Whitt 83,
and Bitran and Tirupati(88)) our procedue can also be employed to (approximatly)
analyze the queue at each node in a queueing network. In the decomposition procedure:
(i) the departure process from each queue is approximated by a renewal process; and (ii)
the superposition of different arrival streams to the queue are further approximated by a
renewal process. Since our pcedure permits analysis of queues with non-renewal arrival
steams we are not constrained to approximate these processes by renewal processes. Our
procedure can also be used to develop and test approximations for (i) departure processes,
and (ii) superposition of general phase processes.
Acknowledgements: We are grateful to Professors C. Tang and D. Tinrupati for their
valuable comments.
REFERENCES
Asmussen, S., Applied Probability and Queues. John Wiley, New York, 1987
Bellman, R., Introduction to Matrix Analysis, McGraw-Hill, New York, 1960
Bitran, G. R. and Tiupati, D., "Multiproduct queueing networks with deterministic routings. Decomposition approach and the notion of interference," Management Science,
34, 1988, 75 -100
Burke, P. J., "The output of queueing systems," Oper. Res., 4, 1956, 699 - 704
Chung, K.L., Markov Chains with Stationary Thrition Probabilities, Academic Press, New York, 1967
Daley, D. J., MThe correlation structure of the output process of some single server queues," Ann. Math. Stats., 39, 1968, 1007 - 1019
Daley, D. J., "Queueing output processes," Adv. Appl. Prob., vol 8, 1975, 395 - 415
Disney, R. L., and D. Konig "Queueing networks: A survey of their random processes," SIAM Review, 27, 3, 1985, 335-403
Disney, R. L, and DeMorais, P. R. "Covariance properties for the departure process of M/ Ek/ 1/ N queues," AIIE Trans., 8, 1976, 169 - 175
Finch, P. D., "The output process of the queueing system M/ G/ 1," Royal Stat Soc. Ser. B 21, 1959, 375-380
Gantmacher, F. R., The Theory of Matrices, Vol II, Chelsea, New York, 1959
Klienrock, L. Queueing Systems, Vol I: Theory, John Wiley & Sons, New York 1975
Lucantoni, D. M., and Ramaswami, V. "Efficient algorithms for solving the non-linear matrix equations arising in phase type queues," Stochastic Models, 1, 1985, 29 - 51
Melamed, B., "Characterizations of Poisson traffic streams in Jackson queueing networks," Adv. App. Prob., 11, 1979, 422-438
Neuts, M. F., "A Versatile Markovian Point Process," J. Appl. Prob., 16, 1979, 764-779
Neuts, M F., Matrix-Geometric Solutions in Stochastic Models, Johns Hopkins Univ. Press, Baltimore, 1981
Neuts, M F., "A new informative embedded Markov renewal process for the PH/ G/ 1 queue," Adv. Appl. Prob., 18, 1986, 535 - 557
Ramaswami, V., '"The N/G/1 Queue and its Detailed Analysis", Adv. Appl. Prob., 12, 1980, 222 -261
Rudemo, M, "Point Processes Generated by Transitions of Markov Chains", 5, Adv. Appl. Prob., 5, 1973, 262-286
Seelan, L P., "An algorithm for Ph/Ph/c queues," Euro. J. Oper. Res., 23, 1986, 118 -127
Shantikumar, J. G., and Buzacott, J. A. "Open queueing network models of dynamic job shops," Int. Jour. of Prod. Res., 19, 1981, 255-266
Takahashi, Y., "Asymptotic expnentiality of the tail of the waiting time distribution in a Ph/Ph/c queue," Adv. Appl. Prob., 13, 1981, 619 - 630
Takahashi Y., and Takami, Y. " A numerical method for the steady state probabilities of G!G/c queueing system in a general class," J. Oper. Res. Soc. Japan, 19, 1976, 147 - 157
Whitt, W., "Approximating a point process by a renewal process: Two basic methods," Oper. Res., 30, 1982, 125-147
Whitt, W., "The queueing network analyzer," Bell Systems Technical Journal, 62, 1983 2779 - 2815
Whitt, W., "Performance of the queuing network analyzer," Bell Systems Technical
Journal, 62, 1983a, 2817 - 2843
Whitt, W., "Approximations for departure processes and queues in series," NRLQ, 31, 1984, 499-521.
APPENDIX 1.
PHASE DISTRIBUTIONS
We adopt the notations and definitions of Neuts(81). For the sake of completeness we reproduce some of the essential properties of phase distributions.
Definition: A probability distribution F(.) on [0, o ) is a distribution of the phase type if and only if it is the distribution of the time until absorption in a finite Markov process of the type defined below.
Consider a Markov process on the states (1,2,..., m+1 ) with infinitesimal generator
T T Q =
00
Where the m x m matrix T satisfies Tii < 0, for 1 i 5 m, and Tij 0 for i4j. Te + T° = 0, and the initial probability vector of Q is given by ( a ,a m+). e is a
column vector of s. States 1 through m are all transient, so that absorption into state m+1, from any initial state is certain. A useful equivalent condition is given by the following property.
Proerrv 1. The states 1 through m are transient if and only if the matrix T is nonsingular.
Proof: Lemma 2.2.1 page 45 Neuts(81).
ProDerLv 2. The probability distribution F(.) of the time until absorption in the state m+l, corresponding to the initial probability vector (a ,a m+1) is given by
F(x) = 1 - a exp(Tx)e.
Proof: Lemma 2.2.2 page 45 Neuts(81).
Proern 3. lThe moments of F(.) are all finite and are given by mi = (-l)ii!( ali e) for i 2 0
The elements of the matrix T 1 have a useful probabilistic interpretation. Element -T-lij is the expected amount of time spent in state j before absorption, given that we started in state i. We make use of this fact several times in this paper.
Proeryv 4. The Laplace-Stieltjes transform f(s) of F(.) is given by f(s)=am+1 +a(sI-T)-1T forRes20
In this paper we set a m+l equal to zero.
If the interarrival times are independent and identically distributed as a phase type distribution then we describe the arrival process as a phase renewal process.