CHARACTERIZATION OF THE ENGINEERING
PROPERTIES OF MEXICO CITY CLAY
by
Sergio Covarrubias Fernindez
Licenciado en Ingenieria Civil, Universidad Iberoamericana Mixico D.F., M6xico
(1991)
Submitted to the
Department of Civil and Environmental Engineering in partial fulfillment of the requirements for the degree of
Master of Science in Civil and Environmental Engineering
at the
MASSACHUSETTS INSTITUTE OF TECHNOLOGY January, 1994
@ Sergio Covarrubias Fernamdez, 1994. All rights reserved
The author hereby grants to MIT permission to reproduce and to distribute publicly paper an electronic copies of this thesis document in whole or in part.
Signature of Author:... ... .. ... . ....
Dept. of Civil and Environmental Engineering, January 14, 1993
C ertified by :... ... ... ... . ... Dr. John T. Germaine, Thesis Supervisor
Accepted by:... ...
Prof -Joseph Sussman ittee on Graduate Studies
CHARACTERIZATION OF THE ENGINEERING PROPERTIES OF MEXICO CITY CLAY
by
Sergio Covarrubias Fernhndez
Submitted to the Department of Civil and Environmental Engineering on January 14, 1994 in partial fulfillment of the requirements
for the degree of Master of Science in Civil and Environmental Engineering
ABSTRACT
Geotechnical studies characterizing the "nature and behavior" of M6xico City Clay have been limited since 1959. In recent years, new techniques have been developed for laboratory testing which enable more reliable characterization of clay properties than possible from the "standard" procedures. In this study, a thorough assessment of the engineering properties of M6xico City Clay at the site of M6xico City's Cathedral is conducted using "state-of-the-art" sampling and automated testing equipment. Additionally, these characteristics of Mexico City Clay are studied in the context of its depositional history and mineralogy, and to evaluate the influence of various sampling methods on sample disturbance.
The sampling program for this investigation consists of drilling three boreholes with three different drilling techniques and obtaining samples with two different samplers. The laboratory program can be divided into two categories; tests for index properties and tests for engineering properties. Tests for index properties include standard geotechnical tests in addition to scanning electron microscopy and X-ray diffraction tests. Tests for engineering properties include: 15 constant rate of strain consolidation tests, 12 SHANSEP Ko-consolidated undrained direct simple shear tests, and 10 SHANSEP Ko
-consolidated undrained triaxial compression and extension tests.
Radiography of the sample tubes revealed the heterogeneity of Mixico City Clay. Scanning electron microscopy (SEM) revealed that M6xico City Clay is, largely composed of microfossils (i.e., diatoms, ostracods, siliceous skeletons, etc.) and that the microstructure of the soil changes significantly with depth. Compositional analysis with the SEM revealed that silica and iron are the predominant elements of the soil. X-ray diffraction tests revealed the presence of particles with basic a crystal structure that is consistent with clay minerals. However, the crystal units are not consistently arranged to form a defined clay mineral. Based on SEM results and X-ray diffraction tests, M6xico City Clay is described as soil constitute of (1) basic crystal units that do not have a consistent arrangement to conform a well defined clay mineral, and (2) a considerable amount of amorphous siliceous material (i.e., microfossils).
Based on results from the consolidation phase of all tests, strong correlations were found between water content and the compressibility and flow properties of the soil. Normalized Soil Parameters (NSP) are presented for the three modes of shear tested. It was found that M6xico City Clay has unique NSP and the highest recorded undrained strength ratio for each mode of shearing. Based on the results, recommendations are made for sampling techniques and for drained compressibility-flow properties and undrained strength-deformation properties.
Thesis Supervisor: Dr. John T. Germaine
ACKNOWLEDGMENTS
I would like to acknowledge the following people and organizations for providing the assistance and support necessary to accomplish this thesis:
Dr. John T. Germaine for his time and advice through many hours of data analysis. It was a pleasure working with someone so fiiendly and eager to help out his students in any
possible way.
Dr. R. T. Martin for his advice and suggestions.
Ana Lukasiak for her hard work performing laboratory tests.
The Consejo Nacional de Ciencia y Tecnologia for the funds to support my studies.
Geotecnologia, S.A. for providing the funds and equipment to obtain the samples for this
investigation.
Arq. Sergio Zaldivar Guerra, Director General de Sitios y Monumentos Historicos del
Patrimonio Cultural, de la Secretaria de Desarrollo Social, for allowing me to perform this
investigation on soil from Mdxico City's Cathedral.
Jose and Erna Sanchez for making me feel part of their family and for taking care of me
when I needed it the most.
My friends at MIT who helped make the days and nights spent in office and in lab more
enjoyable. I would like to give special thanks to Doug Cauble for the days he spent
helping me proofread and finish this thesis, for the innumerable rides he gave me, and for
great conversations. Finally, I would like to thank Mike Geer and Marika Santagata for
always trying to answer many of my questions about soil mechanics.
Debra Berman for being part of the most special memories of my years in Boston. For the
many hours she spent teaching me how to run the equipment in the laboratory, for the
days she spent finishing this thesis, and most importantly for being my best friend.
Above all, my family for their unconditional love and support in all that I do. The hardest
part of being at MIT was not being by your side.
TABLE OF CONTENTS
ABSTRACT 2 ACKNOWLEDGEMENTS 4 TABLE OF CONTENTS 5 LIST OF TABLES 10 LIST OF FIGURES 11 1. INTRODUCTION 19 1.1 BACKGROUND 191.2 RATIONALE FOR CHARACTERIZATION OF MEXICO
CITY CLAY 20
1.3 RESEARCH OBJECTIVES AND SCOPE 21
1.4 ORGANIZATION OF THE THESIS 22
2. BACKGROUND 25
2.1 HISTORICAL BACKGROUND 25
2.1.1 General Information on the Valley of M6xico 25
2.1.2 Geology of the Valley of Mexico 25
2.1.3 Zoning of M6xico City 29
2.1.4 Former Studies of M6xico City Clay 30
2.1.5 Subsoil Investigations of M6xico City's Cathedral 31
2.1.6 Stratigraphy at M6xico City's Cathedral 34
2.1.7 Ground Water Conditions and Effective Stress Profile at
Mdxico City's Cathedral 36
2.2 TECHNICAL BACKGROUND 37
2.2.1 Overview
37
2.2.1.1 Sampling 37
2.2.2 Equipment
and
Testing Procedure
40
2.2.2.1 Radiography 40
2.2.2.2 Soil Preparation 43
2.2.2.3 Index Tests 43
2.2.2.4 Testing Equipment 44
2.2.2.4.1 MIT Constant Rate of Strain Apparatus
44
2.2.2.4.2 MIT Automated Direct Simple Shear Apparatus
45
2.2.2.4.3 MIT Automated Stress Path Triaxial Apparatus
47
2.2.2.5 Data Acquisition System and Data Reduction
49
3. INDEX PROPERTIES, MICROSTRUCTURE AND MINERALOGY 75
3.1 INTRODUCTION 75
3.2 INDEX PROPERTIES 75
3.2.1 Natural Water Content and Undrained Strength Index Tests 75
3.2.2 Atterberg Limits and Plasticity Chart 77
3.2.3 Grain Size Distribution
81
3.2.4 Specific Gravity, Salt Concentration and pH
81
3.2.5 Void Ratio, Total Unit Weight and Saturation
82
3.3 MICROSTRUCURE AND MINERALOGY 83
3.3.1 Overview 83
3.3.2 Scanning Electron Microscopy, Environmental Scanning Electron
Microscopy, and X-ray Diffraction Results 87
3.3.2.1 Introduction 87
3.3.2.2 Sample Preparation 88
3.3.2.3 Results 90
4. EVALUATION OF SAMPLE DISTURBANCE, STRESS HISTORY,
AND CONSOLIDATION PROPERTIES 137
4.1 INTRODUCTION 137
4.2 SAMPLING 138
4.2.1 Disturbance Overview 138
4.2.2 Description of Sampling Process Used for this Investigation 142 4.2.3 Sample Disturbance Evaluation and Effects 146 4.3 ONE-DIMENSIONAL COMPRESSION CURVES AND
DETERMINATION OF THE PRECONSOLIDATION PRESSURE 148
4.3.1 Typical Compression Curves 148
4.3.2 Comparison of Consolidation Testing Methods 150
4.3.3 Methods for Estimating Preconsolidation Pressure 151
4.3.4 Normalization of Compression Curves 153
4.4 STRESS HISTORY 155
4.4.1 Background 155
4.4.2 Stress History at Mdxico City's Cathedral 156
4.5 CONSOLIDATION PROPERTIES 160
4.5.1 Compressibility 160
4.5.1.1 Compression Index and Compression Ratio 160 4.5.1.2 Recompression Index and Recompression Ratio 161
4.5.1.3 Swell Index and Swell Ratio 162
4.5.1.4 Compressibility Correlations 163
4.5.1.5 Secondary Compression Index 165
4.5.2 Flow Properties 168
4.5.2.1 Coefficient of Consolidation 168
4.5.2.2 Coefficient of Permeability 169
4.7 CONCLUSIONS 175
4.7.1 Sample Quality 175
4.7.2 The Soil 176
5. RESULTS OF SHANSEP STRENGTH TESTING PROGRAM 223
5.1 INTRODUCTION 223
5.2 SAMPLE DISTURBANCE AND RECONSOLIDATION
TECHNIQUES 224
5.3 SHANSEP TECHNIQUE PROOF TESTS 228
5.4 SHANSEP CKo UNDRAINED SHEAR STRENGTH
TEST PROGRAM 229
5.4.1 Overview 229
5.4.2 General Undrained Shear Behavior 229
5.4.2.1 SHANSEP CKoUDSS Tests 229
5.4.2.2 SHANSEP CKoU Triaxial Compression and Extension Tests 231
5.4.3 Undrained Strength Ratio 233
5.4.3.1 SHANSEP CKoUDSS Tests 233
5.4.3.2 SHANSEP CKoU Triaxial Compression and Extension Tests 233
5.4.4 Failure Envelope 236
5.4.4.1 SHANSEP CKoUDSS Tests 236
5.4.4.2 SHANSEP CKoU Triaxial Compression and Extension Tests 236
5.4.5 Other Parameters 238
5.5 SUMMARY OF SHANSEP RESULTS AND EFFECTS
OF ANISOTROPY 239
5.5.1 Normally Consolidated M6xico City Clay 239
5.5.2 Overconsolidated M6xico City Clay 241
6. SUMMARY, CONCLUSIONS AND RECOMMENDATIONS 271
6.2 SUMMARY OF SAMPLING AND TESTING PROGRAM 273 6.3 SUBSURFACE CONDITIONS, INDEX PROPERTIES,
MICROSTRUCTURE AND MINERALOGY 274
6.3.1 Subsurface Conditions 274
6.3.2 Index Properties 275
6.3.3 Microstructure and Nineralogy 276
6.4 EVALUATION OF SAMPLE DISTURBANCE, STRESS
HISTORY, AND CONSOLIDATION PROPERTIES 277
6.4.1 General Overview 277
6.4.2 Sample Quality 278
6.4.3 Stress History and Compressibility Characteristics 278 6.4.4 Coefficient of Consolidation and Permeability 280
6.4.5 Lateral Stress Ratio Ko 280
6.5 SHANSEP UNDRAINED STRENGTH TESTING PROGRAM 281
6.5.1 General Overview 281
6.5.2 NC Strength-Deformation Properties 281
6.5.3 OC Strength-Deformation Properties 284
7. REFERENCES 287
APPENDIX A Boring and Sample Logs 293
APPENDIX B Summary of Laboratory Results from SEDUE 1990 315
LIST OF TABLES
Table 2.1 Sampling Depths and Distribution of Index and Engineering Tests 51 Table 3.1 Distribution and Summary of Results of Index Tests 102 Table 3.2 Atterberg Limits, Natural Water Contents, Plasticity Indices,
and Liquidity Indices from Boring PC28
(from Marsal and Mazari 1959)
105
Table 3.3
Summary of Mineralogy Results Obtained by Peralta (1989)
106
Table 4.1
Summary of Consolidation Results from CRSC Tests
179
Table 4.2
Summary of Consolidation Results from SHANSEP CKoU DSS Tests 180
Table 4.3
Summary of Consolidation Results from SHANSEP CKoUC/E
Triaxial Tests
181
Table 4.4
Sources of Sample Disturbance in Cohesive Soils
(from Jamiolkowski et al. 1985)
182
Table 4.5
Major Types of Thin-Walled Tube Samplers
(from Gilbert 1992; after Marcuson and Franklin 1979)
183
Table 4.6
Preconsolidation Pressure Mechanisms (For Horizontal Deposits
with Geostatic Stresses) (from Jamiolkowski et al. 1985)
184
Table 5.1 Summary of Shear Results from SHANSEP CKoUDSS Tests 244 Table 5.2 Summary of Shear Results from SHANSEP CKoUC/E
LIST OF FIGURES
Figure 2.1 Map of the Valley of M6xico (from Marsal and Mazari 1959) Figure 2.2 Approximate NE-SW Cross Section from the Tacubaya Hills to
Texcoco Lake (from Zeevaert 1949)
Figure 2.3 Map of the Superficial Geology of the Valley of M6xico (from Marsal et al 1959)
Figure 2.4 Map of the Geological Zoning of M6xico City (from Marsal and Mazari 1959)
Figure 2.5 Facade of M6xico City's Cathedral and its Location in Reference to Mexico City's Historical Center (from Tamez et al 1992) Figure 2.6 Location of Mexico City's Cathedral Exploratory Program
Performed by TGC Geotecnia, S.A. (from SEDUE 1990)
Figure 2.7 Groundwater Elevation Contour Lines based on Observation Wells; obtained by TGC Geotecnia, S.A. as of May 7, 1990
(from Tamez et al 1992)
Figure 2.8 Piezometric Condition around SCE-I (from Tamez et al 1992) Figure 2.9 Schematic Drawing ofTGC Geotecnia, S.A. Soft Soil Sampler
Design (from Tamez et al 1992) Figure 2.10
Figure 2.11
Figure 2.12
Figure 2.13
Thin Walled Shelby Tube Sampler with Toothed Cutting Shoe
(from Tamez et al 1992)
Schematic Drawing of TGC Geotecnia, S.A. Stiff Soil Sampler
Design (from Tamez et al 1992)
Summary of Laboratory Results of Boring SMC-1, Resistance of the Closest Cone Penetration Test (from Tamez et al 1992)
Summary of Laboratory Results of Boring SMC-2, Resistance of the Closest Cone Penetration Test (from Tamez et al 1992)
and Net Tip
and Net Tip
Figure 2.14
Stratigraphy Underneath the Main Entrance of Mixico City's
Cathedral (from Tamez et al 1992)
52 53 54 55 56 57 58 59 60
Figure 2.15
Perimetrical Stratigraphy of Mexico City's Cathedral
(from Tamez et al 1992)
66
Figure 2.16
Location of Borings S1, S2, and S3 in reference to the Cathedral
and to TGC Geotecnia, S.A. Exploratory Program
67
Figure 2.17
Schematic Drawing of MIT's Radiographing Technique
68
Figure 2.18
Radiograph Results of Sample Tube S3-4
69
Figure 2.19
Radiograph Results of Sample Tube S2-5
70
Figure 2.20
Schematic Drawing of MIT's Constant Rate of Strain Apparatus
(modified from Wissa et al. 1971)
71
Figure 2.21
Schematic Drawing of Modified Geonor Direct Simple Shear
Apparatus (from Ortega 1992)
72
Figure 2.22
Schematic Drawing of MIT's Automated Stress Path Triaxial
Apparatus (from de la Beaumelle 1990)
73
Figure 2.23
Schematic Drawing of MIT's Triaxial Cell (from Hadge 1979)
74
Figure 3.1
Depth vs. Natural Water Content and Average Torvane Strength
107
Figure 3.2
Depth vs. Atterberg limits, Plasticity Index and Liquidity Index
108
Figure 3.3
Liquid Limit vs. Natural Water Content
109
Figure 3.4
Depth vs. Atterberg limits for Borings PC143 & PC28
(from Hiriart & Marsal 1969)
110
Figure 3.5
Plasticity Index vs. Natural Water Content
111
Figure 3.6
Plasticity Chart (A. Casagrande) for Atterberg limits
112
Figure 3.7 Drying Effects on Atterberg limits
(from Marsal & Mazari 1959) 113
Figure 3.8 Relative Consistency vs. Natural Water Content
Figure 3.9 Effects of Consolidation on Atterberg limits & Relative Consistency (from Marsal & Mazari 1959)
(a) Water Content vs. Atterberg Limits (b) Relative Consistency vs. Water Content
Figure 3.10 Influence of Carbon on Water Content and Plasticity Index (from Marsal & Mazari 1959)
(a) Depth vs. Wn, Total Carbon, and Inorganic Carbon (b) Plasticity Index vs. Organic Carbon
Figure 3.11 Depth vs. Specific Gravity
Figure 3.12 Depth vs. Salt Concentration and pH Figure 3.13 Depth vs. Unit Weight and Void Ratio
Depth vs. Initial Saturation
SEM Pictures of the
SEM Pictures of the
SEM Pictures of the
SEM Pictures of the
SEM Pictures of the
SEM Pictures of the
SEM Pictures of the
SEM Pictures of the
SEM Pictures of the
Surface
Surface
Surface
Surface
Surface
Surface
Surface
Surface
Surface
of Specimen SCS 1
of Specimen SCS2
of Specimen SCS3
of Specimen SCS4
of Specimen SCS5
of Specimen S6
of Specimen SJ-K
of Specimen SH
of Specimen SK
Figure Figure Figure Figure Figure Figure Figure Figure Figure Figure Figure Figure Figure Figure Figure 115 116 117 118 119 120 121 122 123 124 125 126 127 128 130 131 133 134 135 136 3.14 3.15 3.16 3.17 3.18 3.19 3.20 3.21 3.22 3.23 3.24 3.25 3.26 3.27 3.28ESEM Pictures of the Surface of Specimen S7 X-Ray Diffraction Pattern of Specimen S5X X-Ray Diffraction Pattern of Specimen SHX X-Ray Diffraction Pattern of Specimen SKX X-Ray Diffraction Pattern of Specimen S6X
Figure 4.1 Schematic Drawings of an Acker 3" Fixed Piston Sampler and Shelby Tube Open-Drive Sampler
Figure 4.2 Schematic Drawing of La Rochelle et al. (1981) Sampler Design and Use
Figure 4.3 Schematic Drawing of a Hollow Stem Continuous Flight Auger Figure 4.4 Radiograph Results of Sample Tube S1-3
Figure 4.5 Schematic Drawing of a Modified Fixed Piston Sampler Proposed by Author
Figure 4.6 Typical Compression Curves from CRSC Tests (a) Axial Strain vs. o'
(b) Void Ratio vs. o'v
Figure 4.7 Typical Compression Curves from SHANSEP CKoUDSS Tests (a) Axial Strain vs. o'
(b) Void Ratio vs. ao'
Figure 4.8 Typical Compression Curves from SHANSEP CKoU Triaxial Tests (a) Axial Strain vs. o'v
(b) Void Ratio vs. a'v
Figure 4.9 Strain at the Overburden Stress vs. Effective Overburden Stress Figure 4.10
Figure 4.11
Figure 4.12
Figure 4.13
Consolidation Results - DSS322
(a) Casagrande Construction (b) Strain Energy
Consolidation Results -TX233
(a) Casagrande Construction (b) Strain Energy
Casagrande Method vs. Strain Energy Technique from CRSC Tests, CKoUDSS and CKoU TX Tests
Compression Curves from all CRSC Tests (a) Normalized Water Content vs. ao'
(b) Normalized Water Content vs. Normalized a'v
185 186 187 188 189 190 191 192 193 194 195 196 197
Figure 4.14 Figure 4.15 Figure 4.16 Figure 4.17 Figure 4.18 Figure 4.19 Figure 4.20 Figure 4.21 Figure 4.22 Figure 4.23 Figure 4.24 Figure 4.25 Figure 4.26
Compression Curves from all SHANSEP CKoU DSS Tests (a) Normalized Water Content vs. o'v
(b) Normalized Water Content vs. Normalized o'v
Compression Curves from all SHANSEP CKoU Triaxial Tests (a) Normalized Water Content vs. o'v
(b) Normalized Water Content vs. Normalized o'v
Stress History at M6xico City's Cathedral (a) Depth vs. o'
(b) Depth vs. OCR
(a) Depth vs. Strain at the Overburden Stress
(b) Depth vs. Strain at the Preconsolidation Pressure Depth vs. Virgin Compression Index, Swell Index and Recompression Index for CRSC, and SHANSEP CKoU DSS and Triaxial Tests
Depth vs. Virgin Compression Ratio, Swell Ratio and Recompression Ratio for CRSC, and SHANSEP CKoU DSS and Triaxial Tests
Unloading Compression Curves (a) CRS87
(b) CRS89
Compressibility Index Relationships
(a) Compression Index vs. Natural Water Content (b) Recompression Index vs. Natural Water Content Depth vs. Compressibility Ratios
Preconsolidation Pressure due to Secondary Compression (from Mesri and Castro 1987)
CKoUC Consolidation Results -TX227.
Void Ratio vs. Elapsed Test Time
Consolidation Results -TX227
(a) Hold Stress at O'vm (b) Hold Stress at o'v,
Relationship between Secondary Compression Index and
Compression Index (NC) and Compression Index
198 199 200 201 202 203 204 205 206 207 208 209 210
Figure 4.27
CRSC Consolidation Results
-
CRS89
211
(a) Compression Curve
(b) Coefficient of Consolidation (cy) vs. o've
Figure 4.28
Depth vs. NC Coefficient of Consolidation
212
Figure 4.29
Coefficient of Consolidation (NC) vs. Natural Water Content;
CRSC Data
213
Figure 4.30
CRSC Consolidation Results
-
CRS76
214
(a) Void Ratio vs. Permeability; Loading Data
(b) Void Ratio vs. Permeability; Unloading Data
Figure 4.31
Depth vs. Permeability at the Initial Void Ratio
215
Figure 4.32
Void Ratio vs. Permeability
216
Figure 4.33
Ck vs. Initial Void Ratio
217
Figure 4.34
Water Content vs. Permeability at the Initial Void Ratio
218
Figure 4.35
Consolidation Results - TX233
219
(a) Compression Curve
(b)
Kc vs a'vc
Figure 4.36
Depth vs. NC Lateral Stress Ratio
220
Figure 4.37
Kc(OC)/Ko(NC) vs. Overconsolidation Ratio
221
Figure 4.38
NC Lateral Stress Ratio vs. 1-sin4' for Trixial Tests; OCR=1
222
Figure 5.1
Consolidation Procedure for Laboratory CKoU Testing
(from Ladd et al. 1977)
246
Figure 5.2
Consolidation and Shear Results: DSS311, DSS315, DSS317
247
(a) Compression Curve
(b) Normalized Shear Stress vs. Shear Strain
Figure 5.3
Normalized Stress Paths for SHANSEP CKoUDSS Tests at
Varying OCR
248
Figure 5.4
SHANSEP CKoUDSS Tests at Varying OCR
249
(a) Normalized Shear Stress vs. Shear Strain
Figure 5.5 Normalized Undrained Modulus vs. Shear Strain for SHANSEP CKoUDSS Tests at Varying OCR
Figure 5.6 Normalized Effective Stress Paths for SHANSEP CKoUC/E Triaxial Tests at Varying OCR
Figure 5.7 SHANSEP CKoUC Triaxial Tests at Varying OCR (a) Normalized Shear Stress vs. Axial Strain (b) Normalized Pore Pressure vs. Axial Strain (c) Friction Angle vs. Axial Strain
Figure 5.8 SHANSEP CKoUE Triaxial Tests at Varying OCR (a) Normalized Shear Stress vs. Axial Strain (b) Normalized Pore Pressure vs. Axial Strain (c) Friction Angle vs. Axial Strain
Figure 5.9 Normalized Undrained Modulus vs. Axial Strain for CKoUC Triaxial Tests at Varying OCR
Figure 5. 10 Figure 5.11 Figure 5.12 Figure 5.13 Figure 5.14 Figure 5.15 Figure 5.16 Figure 5.17 Figure 5.18
Normalized Undrained Modulus vs. Axial Strain for CKoUE Triaxial Tests at Varying OCR
SHANSEP
SHANSEP
Depth vs. NC Undrained Strength Ratio for SHANSEP CKoUC/E Triaxial Tests and CKoUDSS Tests
Undrained Strength Ratio vs. Overconsolidation Ratio for SHANSEP CKoUDSS Tests
NC Undrained Strength Ratio vs. Lateral Stress Ratio for SHANSEP CKoUC/E Triaxial Tests
NC Undrained Strength Ratio vs. Lateral Stress Ratio for SHANSEP CKoUC Triaxial Tests; for Various Soils Lateral Stress Ratio vs. Pore Pressure Parameter, Strain at Failure, and Peak Friction Angle
Undrained Strength Ratio vs. Overconsolidation Ratio for SHANSEP CKoUC/E Triaxial Tests
"Failure" Envelope at Large Strain for SHANSEP CKoUDSS Tests Effective Stress Failure Envelope at Maximum Obliquity for
SHANSEP CKoUC/E Triaxial Tests
250 251 252 253 254 255 256 257 258 259 260 261 262 263
Figure 5.19 Figure 5.20 Figure 5.21 Figure 5.22 Figure 5.23 Figure 5.24 Figure 5.25
Effective Stress Failure Envelope at the Peak Shear Stress for
SHANSEP CKoUC/E Triaxial Tests
Depth vs. Strain at Failure for SHANSEP CKoUC/E Triaxial
Tests and CKoUDSS Tests at OCR=I1
Strain at Failure vs. Overconsolidation Ratio for SHANSEP
CKoUC/E Triaxial and CKoUDSS Tests
Depth vs. Normalized Undrained Modulus for SHANSEP
CKoUC/E Triaxial Tests and CKoUDSS Tests at OCR=1
Normalized Undrained Modulus vs. Overconsolidation Ratio
for SHANSEP CKoUC/E Triaxial Tests and CKoUDSS Tests
Undrained Strength Ratio versus Plasticity Index for Various Soils
(from Ladd 1991)
Depth vs. SHANSEP Undrained Shear Strength for Different
Modes of Shear
264 265 266 267 268 269 270CHAPTER 1
INTRODUCTION
1.1 BACKGROUND
For all practical purposes the valley of M6xico can be considered a closed basin. The valley has an area of 7160 km2, its maximum length in the north-south direction is approximately 135 nm, and the width at the center of the valley is approximately 76 km (Zeevaert 1949). The valley of M6xico is surrounded by a large number of volcanoes and volcanic deposits from the Middle Tertiary, Pliocene, and Pleistocene eras. The latest filling of the valley occurred during the Pleistocene. The upper section of the fill was deposited in the lakes formed during the late Pleistocene, and consists of a fine grained soil mass with a large quantity of microfossils, layers of fine grained clastic material, sand, and gravel. This portion of.the deposit has been traditionally called M6xico City Clay. The thickness of the deposit varies throughout the valley, and in the center of the city has an approximate thickness of 50 m.
MWxico City Clay exhibits rather unusual index and engineering properties. Some of its index properties are:
(a) natural water content ranging between 100 to 600%.
(b) void ratio ranging from 2 to 10, and the density of solids of approximately 2.5. (c) liquid limit ranging from 100 to 500%, and plastic limit ranging from 20 to 150%. M6xico City Clay has a high initial stiffness and almost an elastic behavior during
recompression. Once the preconsolidation pressure is exceeded, the soil is highly compressible; compression ratios greater than one are common. Additionally, the soil exhibits a low undrained strength, which is due to the low effective consolidation stress of soil, and an unusually high undrained strength ratio. These unusual properties give rise to intricate foundation problems when tall and heavy buildings are designed and erected. In addition to the unusual soil characteristics pumping from the aquifer underlying M6xico
City has increased the effective stress on the soil, which has led to increased rates of regional settlement.
The long history of practical foundation problems has resulted in extensive investigation into the consolidation characteristics of the soils underlying Mixico City. As a result much is understood about the consolidation characteristics. Apparently, the shear strength properties have been less thoroughly studied and it appears that data of shear strength are confined to those from unconfined compression tests and a limited number of isotropically consolidated undrained triaxial tests.
1.2 RATIONALE FOR CHARACTERIZATION OF MEXICO CITY CLAY
The research for this thesis was prompted by the author's belief that there was a need for an encompassing study of M6xico City Clay using state of the art equipment and techniques.
The last thorough study of M6xico City Clay was performed by Marsal and Mazari in 1959. Their work contains data from a large number of exploratory borings from which systematic tests were performed on samples from different locations in the city. Since then, investigations have concentrated on very specific characteristics of the soil's behavior.
Recently at MIT, there have been advances in geotechnical engineering that now enable a more reliable and economical characterization of clay properties than possible from "standard" procedures used in general practice. These advances include new techniques used for in situ testing, and new laboratory testing techniques which allow better measurements of preconsolidation pressure, undrained strength-deformation properties and drained compressibility-flow properties. These new techniques have been extensively evaluated at MIT and have proved successful in practice.
In the late 1980's research on the engineering properties of M6xico City Clay was prompted by the structural deterioration of M6xico City's Cathedral. The deterioration
was caused by increasing differential settlements. The research project, initiated by the Secretaria de Desarrollo Urbano y Ecologia (SEDUE, Ministry of Urban Development and Ecology), included: analyzing the behavior of the soil underlying Mixico City's
Cathedral, assessing the effects of this behavior on the Cathedral's structure, and
establishing corrective actions to ensure its structural safety. SEDUE contracted TGC
Geotecnia, S.A. to perform the investigation. In turn, TGC undertook an exploration and
laboratory testing program which employed the state of the art techniques available at the
time in M6xico.
The soil exploration program for this thesis was conducted at the site of M6xico City's Cathedral. The study performed by SEDUE, discussed above, was used as a basis of comparison for the results presented herein.
1.3 RESEARCH OBJECTIVES AND SCOPE
The objectives and corresponding scope of the research can be divided into the following two components:
1) Characterize the engineering properties of Mmxico City Clay at Mexico City's
Cathedral.
This objective was accomplished with sophisticated laboratory tests run on undisturbed samples. Special features of this program included:
(a) constant rate of strain consolidation tests to measure the stress history, compressibility, and flow characteristics of the soil;
(b) automated direct simple shear tests, which produce one-dimensional compression curves and shear information
(c) automated triaxial testing, which produce one-dimensional compression curves, and measurements of the coefficient of earth pressure at rest (Ko).
(d) the SHANSEP reconsolidation technique for K
oconsolidated-undrained
strength testing, which incorporates different modes of failure to assess the
anisotropic undrained stress-strain-strength properties of M6xico City Clay. 2) Understand the general natural characteristics ofMdxico City Clay in the context of its depositional history and mineralogy.
This objective was accomplished by studying the microstructure of the soil with Scanning Electron Microscopy and identifying the mineralogy with compositional analysis and X-ray diffraction tests.
3) Evaluate the influence of various sampling methods relative to sample disturbance.
This objective was accomplished by evaluating the results of sophisticated laboratory tests performed on undisturbed samples obtained from three different boreholes. The boreholes were drilled using three drilling techniques while the samples were obtained with two different samplers as follows:
(a) thin walled Shelby tube sampling with a heavy weight drilling mud (yt=1.2 t/m3); and hollow stem augers.
(b) thin walled Shelby tube sampling and hollow stem augers. No drilling fluid was used, and hence, the borehole was dry.
(c) fixed Piston Sampling with a light weight drilling mud, (yt<l.1 t/m3); and
hollow stem augers.
1.4 ORGANIZATION OF THE THESIS
Chapter 2 contains background information related to this thesis. The geologic history of the Valley of Mixico and the soils forming its basin are discussed, followed by a summary of prior geotechnical investigations on Mdxico City Clay. The summary includes an overview of the study of the foundation of M6xico City's cathedral and the stratigraphy at the site. The rest of the chapter focuses on information specific to this thesis. First is
an overview of the sampling and testing program used to determine index and engineering
properties. Second is a description of the equipment and testing procedures.
Chapter 3 discusses the index properties, microstructure and mineralogy of M6xico
City Clay at M6xico City's Cathedral. The chapter begins by presenting the index
properties. This is followed by an overview of former studies on the microstructure and mineralogy and the results of this investigation.
Chapter 4 discusses two principal topics: sample disturbance and consolidation properties. First a discussion on sample disturbance presents an overview of disturbance and a detailed description of the sampling processes used to obtain sample for this investigation. Second, a discussion on the consolidation properties presents an evaluation of the stress history and consolidation properties of M6xico City Clay at the cathedral site. This discussion also contains an evaluation of sample disturbance and its effects on specific tests. The evaluation includes an estimation of the preconsolidation pressure and resulting stress history profile, determination of compressibility and flow properties, and an estimation of the lateral stress ratio (Ko). The chapter also presents correlations found between the natural water content and the compressibility and flow properties of M6xico City Clay.
Chapter 5 presents and analyzes the results of the SHANSEP Ko consolidated
undrained direct simple shear and triaxial testing program. The chapter presents recommendations for Normalized Soil Properties related to undrained shearing.
Chapter 6 summarizes the most important results from the research, presents the correlations found, and the best estimates of Normalized Soil Properties.
Chapter 7 contains the list of references used during this investigation.
Accompanying this thesis is a MIT Department of Civil and Environmental Engineering Research Report Number R94-01. The report contains the numerical and graphical data of all constant rate of strain consolidation (CRSC) tests, Ko consolidated
undrained direct simple shear (CKoUDSS) tests, and Ko consolidated undrained triaxial
CHAPTER 2
BACKGROUND
2.1. HISTORICAL BACKGROUND
2.1.1 General Information on the Valley of MWxico
For all practical purposes the valley of M6xico can be considered a closed basin, even though the Nochistongo Cut and some tunnels to the northeast of the valley have been constructed for drainage purposes. The valley's geographical limits are: Tepozotlin, Tezontlalplan and the Pachuca hills to the north; the Apan plains and the Sierra Nevada to the east; the Cuauhtzin and Ajusco mountain ranges to the south; and the Sierras of Las Cruces, and Monte Alto to the west. Figure 2.1. shows a map of the valley of M6xico. The valley has an area of 7160 kmn2, of which 3080 km2 are
mountainous regions with altitudes of more than 200 m above the valley floor and 2050 km2 are regions with altitudes between 0 and 50 m above the valley floor. The lowest area of the valley has a mean altitude of 2240 m above sea level (Marsal & Mazari, 1959). The maximum length of the valley in the north-south direction is approximately 135km, and the width at the center of the valley is approximately 76km (Zeevaert 1949).
2.1.2 Geology of the Valley of M6xico
The following section is summarized from Mooser (1956) and from a conversation with Mooser in 1992.
The large number of volcanoes and volcanic deposits that surround the valley of M6xico can be classified in three groups: Middle Tertiary, Pliocene, and Pleistocene. Classification is based on stratigraphic sequence and degree of erosion. It has not been possible to determine precise chronological limits for the different groups due to the lack or shortage of fossils present in the formations.
It is assumed that due to tectonic forces acting from the beginning of the Tertiary,
fractures developed in the earth's crust which allowed lavas to flow and create substantial volcanic apparatuses. The Xochitepec range, to the west of Xochimilco and at the foot of the Ajusco, is formed entirely of deposits of the Middle Tertiary group (see Figure 2. 1). It has been inferred from the present day smooth relief of Las Cruces range, 1000 m above the valley floor, that volcanic activity decreased towards the end of the Miocene era and was followed by a period of intense erosion.
During the Pliocene, new volcanic activity started north of the valley in the Pachuca region and in the center of the valley in the Guadalupe hills. This activity was characterized by the emission of great masses of acidic, dacitic and rhyolitic lavas. Later in time, sections of the Sierra Nevada and Las Cruces range were covered with lavas from the Iztaccihuatl and the Ajusco volcanoes (see Figure 2. 1). After the Iztaccihuatl and the Ajusco volcanoes stopped erupting, new volcanic activity appeared in the northern part of the valley. The basaltic andesites of this new activity (Upper Pliocene) cut off the drainage towards the north near Zimapan and Tula (see Figure 2. 1).
In the Upper Pliocene a semi-arid climate prevailed. Strong winds and intermittent torrential rains eroded the rough relief resulting in the deposition of alluvial fans formed by andesitic fragments, sands and silts. This formation has been named "Tarango". The Tarango formation, which covers the entire valley, is characterized by the absence of lavas and is therefore placed subsequent to the Pliocene formation with respect to chronological order.
During the Pleistocene a cold damp climate prevailed and ice-caps formed on the Iztaccihuatl and Popocat6petl volcanoes; also during this period tectonism started the last volcanic cycle. Rain and water from the ice-caps caused the destruction of a large part of the Tarango formation, creating gorges and two main valleys that drain to the south into the Amacuzac river (not in map), outside the limits of the valley. The larger of the two valleys was the westernmost one. This valley started at Pachuca and Zumpango,
continued east around the Sierra de Guadalupe, passed through the area now occupied by M6xico City and Xochimilco, and extended to Cuernavaca. The smaller valley ran along the foot of the Sierra Nevada, crossed Chalco and Amecameca, and reached the Upper Amacuzac basin at Cuautla. The geologic formation that separated the two valleys was created during the Middle Tertiary but is now buried. It is possible to appreciate the geometry of these valleys by observing the location of the alluvial deposits in Figure 2.3.
After this fluvial net was created, the last volcanic cycle started at the northern end of the valley. Deposits created during this cycle are referred to as the Chichinautzin Basaltic Series. Volcanic activity gradually shifted in a southern direction forming the Chiconautla, Chimalhuacim, and El Cerro de la Estrella (see Figure 2.1). Lastly, strong lava effusions from the Chichinautzin (about 2000m in thickness) filled the space between the Las Cruces and the Sierra Nevada ranges. Hence, a closed valley was formed by plugging off the southern drainage. This obstruction caused clastic fluvial deposits to accumulate in gorges, thus smoothing the rough topography created by the erosion of the Tarango formation. On the northern edge of the lava effusions of the Chichinautzin, up to 800m of clastic fluvial deposits accumulated. This formation has received the name of fluvial and alluvial clastic deposits of the Cuaternary. What was once a complicated series of gorges and valleys was transformed into a large plain with shallow lakes.
The Pleistocenic fill of the valley can be divided in two sections; (1) the upper layer which consists of fine grained deposits, and (2) the lower layer one which consists of coarse grained material (sands, gravel, boulders, etc.). The lower layer is characterized by well rounded elements enclosed in a sandy matrix. The lower section of the fill has a high permeability due to the absence of clay and silts in its matrix. The absence of clay and silt distinguishes this layer from the older Tarango formation. Some of the drinking water of M6xico City is obtained from the aquifer formed by the lower section of the pleistocenic fill. The upper section of the fill was deposited during the late Pleistocene, and consists of a fine grained soil mass with a large quantity of microfossils and layers of fine grained
pyroclastic material, sand, and gravel. This portion of the fill has been traditionally called
Mexico City Clay. The thickness of this portion of the deposit varies throughout the
valley, and in the center of the city it has an approximate thickness of 50m.
The literature offers different classifications and descriptions of the filling process
for the upper section of the Pleistocenic fill, but they can be summarized as follows. An
important portion of the upper section of the deposit is a product of the transformation
and decomposition of very fine pyroclastic material. Accompanying the Chichinautzin
lava effusions were explosions of great quantities of steam which formed dense clouds
containing very fine volcanic ash and other pyroclastic materials. The material suspended
in the clouds was deposited with rain on the waters of the lake. Other fine material that
fell on the mountains enclosing the valley was transported by air and rain water into the
lake. As the sedimentation process took place, there were climatic cycles which consisted
of wet and dry periods that caused changes in the lake's general conditions. During
different time periods the physiochemical characteristics and the depth of the lake changed
causing depositional differences in the sedimented material. Additionally, there were
isolated volcanic explosions that covered the entire lake with coarser grained pyroclastic
material. An important characteristic of this section of the fill is the significant presence of
microfossils. Apparently, lake conditions were such that they promoted the proliferation
of diatoms and other microfossils. Figure 2.2 presents an approximate cross section of the
upper section of the pleistocenic fill. The cross section proceeds from the northeast to the
southwest from the Tacubaya Hills to Texcoco Lake, and passes close to El Peflon de los
Bafios.
The last volcanic activities were the Xitli, approximately 2400 years ago and the Popocat6petl eruption in 1920. Figure 2.3 shows the actual superficial geology of the Valley of M6xico.
2.1.3 Zoning of M6xico City
In their work, Marsal and Mazari (1959) divided M6xico City into three zones according to properties of the subsoil in the top 50m, as shown in a plan view in Figure 2.4. Figure 2.2 shows the approximate locations of the three zones for a particular cross
section.
The western and southwestern part of the city lies on the skirts of the mountain
ranges that enclose the valley. This zone has been denominated "Zona de Lomas" (Zone
of Hills) on account of its relative altitude compared to the rest of the valley. This zone is
characterized by materials of volcanic origin, consisting of lava flows and silts produced
by the erosion of the lava flows, and by their high strength and low compressibility.
The second zone is the transition zone between the western zone of Lomas and the
bottom of Texcoco Lake. This zone is characterized by erratic subsoil conditions. In
general, superficial organic clays or silts cover a strata of very compressible clay, which is
interspersed with seams of compact silty sand or sand. The clay rests over thick layers of
sand and gravel.
The Zona de Lago (Lake Zone) corresponds to the central and eastern parts of the
city, which were partially built on the Texcoco lake bed. Texcoco Lake is mostly dry due
to drainage works undertaken in the valley on different occasions from the colonial period
onwards. This zone is characterized by a thick strata of very compressible clay with very
high water contents. The stratigraphy within this zone is mostly consistent, although
thicknesses in the strata change due to varying degrees of consolidation.
In general, the term "Mexico City Clay" and its unusual characteristics pertain to
the clays found in the Lake Zone. The clay analyzed in this thesis was obtained from this
zone.
2.1.4 Former Studies of M6xico City Clay
Mixico City Clay has been the topic of numerous studies and it would not be feasible or practical to mention all of them here. Most of these studies concentrate on very specific aspects of M6xico City Clay and there was not enough information to link the studies together. For this reason it was very difficult to compare the findings of this thesis to those presented in the literature.
The most comprehensive and notable study on M6xico City Clay was prepared by Marsal and Mazari in 1959. It contains data from a large number of exploratory borings from which systematic tests were performed on samples from different locations in the city. Data was collected between 1947 and 1959. The study can be classified into three main parts; laboratory work, general subsidence of the city, and behavior of different structures built in the valley of Mdxico. This study provided helpful insight while preparing this thesis and is referred to quite often in the text.
The following paragraphs outline the contents of the main references used in the preparation of this thesis. Full bibliographical detail of these references can be found in Chapter 7.
Mesri et.al. (1975)
This paper presents a study on the composition and compressibility of typical samples of M6xico City Clay. The composition study includes scanning electron microscopy, X-ray diffraction, and chemical analysis, as well as measurements of physical properties. Compressibility characteristics were investigated by means of one-dimensional consolidation tests. The primary objective of this study was to analyze the secondary compressibility of Mdxico City Clay with special reference to the effects of previous secondary compression and thixotropic hardening. This paper is referenced quite often in Chapters 2 and 4, as it provides a good description of the composition and consolidation behavior of M6xico City Clay.
Lo (1962)
Lo analyzes the shear strength properties and the composition of a block sample of Mexico City Clay. This is the only study found in the literature that presents one-dimensionally consolidated undrained compression (CKoUC) triaxial tests. The results of Lo's investigation are compared to those obtained in this thesis.
Mooser (1956)
Mooser presents a detailed physical description of the Valley of M6xico and presents the geologic history and nature of the different volcanic series that compose the valley. The geological section of this thesis was summarized from Mooser's work.
Peralta (1989)
This paper describes how the sedimentation conditions and the type of materials that constitute M6xico City Clay determine the soils microstructure and hence, its mechanical behavior. The paper also presents the findings from a detailed compositional analysis.
2.1.5 Subsoil Investigations of M6xico City's Cathedral
According to Tamez et. al. (1992), the cathedral's construction began in 1573 and was finished in 1813. It was constructed over the remains of Aztec temples and constructions destroyed by the Spaniards. Figure 2.5 shows the facade of the cathedral, and a map of its location in reference to M6xico City's Historical Center.
The following section has been summarized from a publication entitled, "Study of the Foundation of the Cathedral of M6xico", published by the Secretaria de Desarrollo Urbano y Ecologia (SEDUE, Ministry of Urban Development and Ecology) in 1990; and from Tamez et. al. (1992), which is a revised and shortened version of SEDUE (1990).
Sometime between 1988 and 1989, SEDUE contracted TGC Geotecnia, S.A. to do the following; analyze the behavior of the subsoil underlying M6xico City's Cathedral,
assess the effects of this behavior on the structure, and establish corrective actions to
assure the structural safety of the Cathedral.
In turn, TGC undertook an exploration and laboratory testing program of the subsoil. The exploration program consisted of:
* twenty one electric Cone Penetrometer tests (CPTs, SCE 1 to 21); * two continuous sampling borings (SMC 1 and 2);
* the installation of eleven piezometric stations (EP 1 to 11); seven located in the vicinity of the cathedral property (EP 1 to 7), and four in the cathedral surroundings (EP 8 to 11);
* the installation of twenty observation wells, (the location of these wells are not well defined in SEDUE (1990));
* and two deeply seated settlement points.
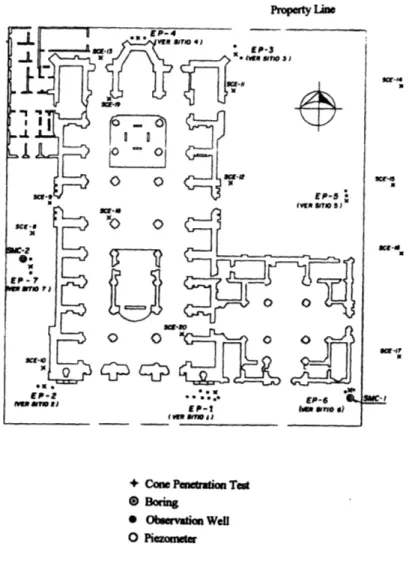
Figure 2.6. shows a plan view of the exploratory program. The laboratory program included tests to establish the index, consolidation (incremental oedometer) and strength properties (Unconsolidated Undrained triaxial tests, UU) of the subsoil.
The CPTs were located as follows; thirteen around the cathedral's perimeter, four inside the cathedral, and four in the surrounding area. An observation well was installed within a few feet of most CPTs. The only information presented in SEDUE (1990) from the CPTs is the net tip resistance. The excess pore pressure was not measured during the tests. The average depth of the CPTs was 40m and six of tests penetrated to nearly 60m.
As shown in Figure 2.6, piezometric stations EP 2 through 7 are located within a few feet of the CPTs. The average depth of the piezometers is 17.5m. Piezometric station EP-1 is composed of several cells, and is located in the vicinity of SCE-1. The cells are installed at a depth of 18.0, 21.2, 26.7, 39.0, 44.0, 50.5 and 53.0 m. The piezometers installed are similar to the Casagrande M206 piezometer. Figure 2.7 shows ground water elevation contour lines, constructed from the observation well readings
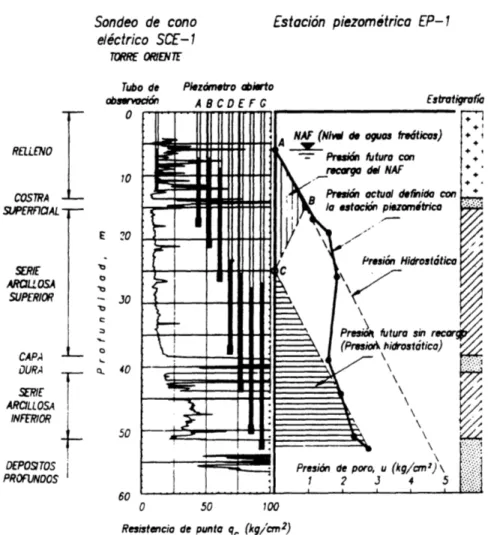
obtained by TGC as of May 7, 1990. Figure 2.8 shows the piezometric condition around SCE-1.
The two continuous sampling boreholes were drilled using a Mobil Drill B61 drill
rig. Boring SMC-1, located within a few feet of SCE-6, was sampled to a depth of
75
m,
and boring SMC-2, located within a few feet of SCE-7, was sampled to a depth of 60 m. Three types of samplers were used. The first type is a sampler developed by TGC which was used in borings SMC-1 and SMC-2. Figure 2.9 shows a schematic drawing of this sampler. A characteristic which distinguishes this sampler from other samplers is that it contains an inner aluminum liner. Samples are contained within this liner, which preserves and protects them after sampling. The samples are taken by simply pushing the sampler into the soil with the hydraulic feed of the drill rig, and then shearing off the samples and lifting them to the surface. The samples are left in the liner and are extruded in the laboratory by pushing the soil out of the liner in 30cm sections. The sampler is primarily used in soft soils.
The second type of sampler which is shown in Figure 2.10, was also used in borings SMC-1 and SMC-2. It is basically a thin walled Shelby tube with a toothed cutting shoe. This sampler was used in soils that yielded high values (peaks) of net tip resistance. The samples are taken by rotating and pushing the sampler into the soil, and then shearing off the samples and lifting them to the surface. The samples are left in the sampling tube and are extruded in the laboratory by pushing the soil out of the liner in 30cm sections.
Figure 2.11 shows the third type of sampler used. This sampler also contains an inner liner. The sampler is used by rotating it into the soil. This sampler was designed for extremely stiff soils ans was only used to sample the "hard layer" of borings SMC-1 and SMC-2 (the hard layer will be defined in Chapter 3).
Drilling mud and standard DCDMA casing was used in both borings. The drilling mud was maintained at a constant Marsh funnel viscosity of forty seconds. A fish tail bit and circulating mud at low pressure were used to clean out the boreholes before sampling.
Figures 2.12 and 2.13 show summaries of the laboratory results of borings SMC-1 and SMC-2. These figures also present the net tip resistance of the penetrometer test located closest to the respective borings. More of TGC's laboratory results will be presented in the following chapters. Appendix B contains most of the laboratory results reported in SEDUE (1990).
It is worth mentioning that the samples obtained for this thesis were taken 15 feet from penetrometer test SCE-6 and boring SMC-1.
2.1.6 Stratigraphy at M6xico City's Cathedral
The following section has been summarized from SEDUE (1990). As mentioned above, TGC performed 21 CPTs. The objective of the tests was to establish the stratigraphy of the subsoil. Figure 2.14 shows the stratigraphy inferred from the three CPTs performed in front of the main entrance of the cathedral. Figure 2.15 shows the perimetrical stratigraphy of the cathedral. The stratigraphy as presented in SEDUE (1990)
consists of 6 main substrata, which can be described as follows:
1) Rellenos (Fill)
As the name indicates, this strata is a heterogeneous material that has accumulated
over time. It consists primarily of pieces of pavements, previous foundation material, rock
fragments, silt size soils, etc. The depth range of the fill around the site ranges from an
average of 0.Om and 11.1m. The average thickness of the strata is 11.1±2.2m. 2) Costra Superficial (Superficial Crust)
This layer can be described as a desiccated crust. It contains low compressibility clays overlying overconsolidated silts. The depth of the crust ranges from an average of
3) Serie Arcillosa Superior (Upper Clay Series)
This deposit is composed of seven clay layers, which are separated by "hard" lenses. In SEDUE, (1990) TGC describes three of the hard lenses as volcanic ash and three as desiccated crusts. The net tip resistance profiles in Figures 2.12 and 2.13 clearly show the location of each of the seven clay layers. The peaks in the net tip resistance correspond to the location of the hard lenses, which most likely correspond to a historical event. The average depth range of the deposit is 13.0m to 36.7m; the average thickness is 23.7+1.1m. The soil from this deposit is commonly referred to as M6xico City Clay. The clay is very heterogeneous, and significant changes in color, consistency, touch, appearance, and index and mechanical properties are not uncommon over minimal changes in elevation. All of the samples collected for this investigation were obtained from this substrata.
4) Primera Capa Dura (First Hard Layer)
The first hard layer is composed of a sequence of hard and soft layers. The hard layers are usually sands and gravels and the soft layers silts and clays. This hard layer is commonly used as the bearing strata for buildings with end bearing piles. The average depth range of this deposit is 36.7m to 39.9m. The average thickness of the strata is 3.2±0.4m.
5) Serie Arcillosa Inferior (Lower Clay Series)
This deposit is made of at least three clay layers separated by hard layers. The hard layers are usually sands, silts, and volcanic glass and ash. The depth range of this deposit ranges from an average of 39.9m to 50.5m. The average thickness of the deposit is
10.6±0.4m. It is presumed that the clay of this substrata is of the same nature as that of the upper series. The clay of this substrata has undergone significant deformation due to a consolidation process induced by pumping of the underlying acquifer.
6) Depositos Profundos (Deep Deposits)
These deposits consist mainly of compact sand with scattered clay lenses and are part of alluvial clastic deposits, which were described in Section 2.1.2. This deposit forms a high permeability aquifer. Drinking water for M6xico City is extracted from this aquifer. The extraction of water from the aquifer is the main cause of the subsidence of MWxico City (Carrillo 1969). The initial average depth of this deposit is 50.5±0.7m.
2.1.7 Ground Water Conditions and Effective Stress Profile at M6xico City's Cathedral In the preparation of this thesis it was assumed that the ground water conditions and effective stress profile presented in SEDUE (1990) prevailed at the time the samples were taken for this study. There are several sources of uncertainty associated with effective stress calculations, i.e. stress increment caused by the building, unit weight of various materials, seasonal variation of the pore pressure, etc. This investigation did not produce sufficient information to clarify all of these uncertainties. Therefore, the effective stress profile used in this thesis was calculated using the results presented in SEDUE (1990), of depth and effective stress, for consolidation tests from boring SMC-1. Unfortunately, neither SEDUE (1990) nor Tamez et. al. (1992) present any information about how the effective stress profile was calculated. Some simple calculations were performed to ensure that the effective stress profile given in SEDUE (1990) is reasonable. The results of these calculations yielded effective stress values very similar to those presented in SEDUE (1990).
SEDUE (1990) report the depth and effective stress on all the consolidation tests performed on samples from boring SMC-1. Also, in SEDUE (1990) the piezometric head and installation depth of the piezometers in piezometric station EP-1 are reported. Additionally, SEDUE reports that the groundwater pressures measured at station EP-1 were used to calculate effective stress profiles throughout the site. Using the depth of the piezometers as boundaries, four linear regressions were performed on the depth and
effective stress data of the consolidation tests. The regression equations were used to
back calculate the effective stress profile between piezometer depths. The results of these regressions are expressed in equations 2.1 through 2.4.
Between 7.5 to 18.0 m o'v = 1.016 + ((depth - 7.5) x 0.01428)...(2.1) Between 18.0 to 21.2 m 'v = 1.166 + ((depth - 18.0) x 0.03241)...(2.2) Between 21.2 to 26.7 m o'v = 1.269 + ((depth -21.2) x 0.05440)... (2.3) Between 26.7 to 39.0 m o'v = 1.569 + ((depth - 26.7) x 0.13927)...(2.4)
2.2 TECHNICAL BACKGROUND
2.2.1 Overview
The Cathedral site was chosen as the location to obtain samples for this thesis for
the following reasons: (1) a thorough geotechnical investigation of the subsoil had just
been finished by TGC Geotecnia, S.A., in partial fulfillment of the work it had been hired
to do by SEDUE, and the results from this investigation were readily available; (2) it was
believed that TGC's results would serve as a good basis of comparison because their
investigation had implemented the best sampling techniques, transportation, conservation
of samples, and laboratory specimen preparation presently available in M6xico.
This thesis can be divided into two main parts: (1) sampling, which consisted of
drilling three boreholes using different drilling and sampling techniques; and (2) a
laboratory testing program and data analysis.
2.2.1.1 Sampling
One of the objectives of this thesis was to ascertain the amount of sampling
disturbance caused by different samplers and sampling techniques. The 3 borings were
performed using a CME Model 55 drill rig, supplied by Geotecnologia, S.A.. In the first
(Si) and second (S2) boreholes, thin walled Shelby tubes and hollow stem augers were
was omitted for S2 (the borehole was "dry"). In the third borehole (S3), an Acker Fixed
Piston Sampler, a very light weight drilling mud (yt<l.t/mrn
3), and hollow stem augers
were used. Nine samples were retrieved from boring Si (1 through 9), nine samples from
boring S2 (1 through 9), and six samples from boring S3 (1 through 6).
Figure 2.16 shows the location of borings S1, S2, and S3 in reference to the
cathedral and TGC's exploratory program. As mentioned earlier, the borings performed
for this thesis are within a few of from boring SMC-1. Table 2.1 presents the depth and
recovery of each sample. Appendix A contains the boring logs of the boreholes drilled for
this thesis as well as a sample log for each of the samples obtained for this thesis.
Of the 24 undisturbed samples, 18 were sent to MIT. The breakdown is the
following: three from boring
S1
(3, 8 and 9); nine from boring S2 (1 to 9); and six from
boring S3 (1 to 6). Chapter 4 will discuss why only 18 of the twenty four samples were
sent to MIT.
2.2.1.2 Laboratory Testing Program and Data Analysis