Publisher’s version / Version de l'éditeur:
Vous avez des questions? Nous pouvons vous aider. Pour communiquer directement avec un auteur, consultez la première page de la revue dans laquelle son article a été publié afin de trouver ses coordonnées. Si vous n’arrivez pas à les repérer, communiquez avec nous à PublicationsArchive-ArchivesPublications@nrc-cnrc.gc.ca.
Questions? Contact the NRC Publications Archive team at
PublicationsArchive-ArchivesPublications@nrc-cnrc.gc.ca. If you wish to email the authors directly, please see the first page of the publication for their contact information.
https://publications-cnrc.canada.ca/fra/droits
L’accès à ce site Web et l’utilisation de son contenu sont assujettis aux conditions présentées dans le site LISEZ CES CONDITIONS ATTENTIVEMENT AVANT D’UTILISER CE SITE WEB.
Research Report (National Research Council of Canada. Institute for Research in
Construction), 2004-02-01
READ THESE TERMS AND CONDITIONS CAREFULLY BEFORE USING THIS WEBSITE.
https://nrc-publications.canada.ca/eng/copyright
NRC Publications Archive Record / Notice des Archives des publications du CNRC :
https://nrc-publications.canada.ca/eng/view/object/?id=0fecc265-aa54-4aba-abc0-c0b5afb67065 https://publications-cnrc.canada.ca/fra/voir/objet/?id=0fecc265-aa54-4aba-abc0-c0b5afb67065
NRC Publications Archive
Archives des publications du CNRC
For the publisher’s version, please access the DOI link below./ Pour consulter la version de l’éditeur, utilisez le lien DOI ci-dessous.
https://doi.org/10.4224/20378054
Access and use of this website and the material on it are subject to the Terms and Conditions set forth at
Sound Propagation in a Simulated "Team-Style" Open Office
Chu, W. T.; Warnock, A. C. C.
Sound Propagation in a Simulated “Team-Style” Open Office
Chu, W.T.; Warnock, A.C.C.
IRC-RR-156
February 2004
INTRODUCTION
INTRODUCTION
This report presents measurements undertaken to quantify the importance of speaker orientation and surface reflectivity of workstation surfaces on sound attenuation in the open ‘team-style’ offices using a simulated office in the anechoic chamber at IRC. The measurements were made on behalf of Public Works and
Government Services Canada (PWGSC). This report is the fifth in a series. The first report1 presents measurements of sound
propagation made in nine offices. The second report2 presents measurements of speech levels in the offices. Background
information on open office acoustics can be found in the third report.3 The fourth report presents more controlled measurements of sound attenuation over screens in the laboratory.4 The sixth report5
presents measurements of the average sound field around the heads of human talkers.
Sound attenuation was measured by positioning a Bruel and Kjaer Head and Torso Simulator (HTS) sound source at one corner of the open ‘team-style’ office and measuring the sound levels received at two positions at the opposite corners. The validity of using the HTS in the current study is well supported by the study on the directivities of human speakers. Results from that study showed that the HTS has a directivity that is similar to that of a human speaker.
The measurement team comprised Jean-Charles Guy†, Wing Chu and Alf Warnock of the Institute for Research in Construction, National Research Council of Canada (NRC).
†
A guest student from INSA de Lyon, France.
SUMMARY
SUMMARY
Effects of speaker orientation, vertical surfaces, and office furniture on the speech privacy in the open ‘team-style’ offices have been studied and quantified using the Speech Intelligibility Index6 (SII) as the indicator. The study was carried out in a simulated office in the anechoic chamber at IRC using the Bruel and Kjaer Head and Torso Simulator (HTS) as the sound source. Figure 1 shows a plan view of the layout of the simulated office.
2 .4 4 2 .4 4 2.44 0 .6 1.82 0.6 0.6 0 90 180 270 1.82 S6 S5 S4 S3 S2 S1 Middle Screen Mic 2 Mic 1
Figure 1: Plan view of the simulated open ‘team-style’ office in the anechoic chamber at IRC. S1…S6 are the screens surrounding the work area. Dimensions are in metres. Mic 1 and Mic 2 are the positions of the two measuring microphones.
In the open office context "Confidential" privacy means that speech sounds may be heard but no meaning can be extracted. "Normal" or "acceptable" privacy usually means that some meaning can be extracted from the overheard speech but by not focussing on the
SUMMARY
speech, concentration is not unduly disturbed. The values of SII usually taken as delimiting confidential and normal privacy are 0.1 and 0.2 respectively. These values are rather approximate. They are not supported by extensive research and do not necessarily indicate occupant satisfaction in an open office. Other psychological factors play a role in determining satisfaction.
The major findings in the study were
• With a carpeted floor in the anechoic chamber but no screens, furniture or vertical reflecting surfaces inside the simulated work area, the SII values changed from 0.02 to 0.33 depending on whether the HTS was facing away or turned towards the receiver.
• The confidential privacy condition, when there were no vertical reflecting surfaces, was easily destroyed by the introduction of reflective screens. However, significant improvement was
obtained by covering the reflective screens with a layer of 25-mm thick dense fiberglass.
• When absorptive screens surrounded the work area, addition of simulated desks had no significant effect on the SII values.
• Reflections from computer monitors were important when they were directed toward a particular receiver.
• An absorptive middle screen installed between the source and the receiver increased speech privacy when it blocked the line of sight.
• Reflections from open bookshelves installed on the office screens had little additional effect to those from the monitors.
Table 1 summarizes many of the measurements. Examination of the SII values in the tables reveals the importance of talker orientation and of reflections from vertical reflecting surfaces. The details of the work are given in the following sections.
SUMMARY
Table 1: SII values for the different conditions inside the simulated office in the anechoic chamber. The dark gray values in the table are cases where SII is greater than 0.2, the light gray are those cases where SII lies between 0.1 and 0.2.
Mic 1 Mic 2 HTS orientation 0° 45° 90° 0° 45° 90° No screens 0.06 0.04 0.18 0.02 0.02 0.06 6 reflective screens 0.38 0.41 0.42 0.41 0.41 0.40 6 absorptive screens 0.10 0.13 0.22 0.10 0.11 0.13 Add three 38 cm monitors & CPU units on desks 0.13 0.15 0.22 0.18 0.21 0.24 Add a 1.3 x 1.5m absorptive middle screen 0.04 0.05 0.07 0.18 0.2 0.25 Add bookshelves at source corner 0.04 0.04 0.06 0.16 0.19 0.21 RR-156 - Page 4 of 19 -
BACKGROUND
BACKGROUND
Figure 2 gives an example of an open ‘team-style’ office. There are essentially no barriers between occupants but there are usually barriers or screens separating the work area from adjacent work areas.
A
B
C
D
Figure 2: Example layout for a team-style work area. The gray rectangles represent barriers. The arrows show direct paths, reflected paths and one diffracted path between occupants.
In the absence of any barriers to sound propagation, sound in open ‘team-style’ office travels directly from speakers to listeners. Some attenuation occurs due to the spreading of the energy over an expanding surface as the sound propagates away from the source. This leads to an attenuation of 6 dB for each doubling of the distance from the source. In addition to this direct path, sound may reflect from the ceiling, the floor, and vertical surfaces losing some energy each time. The loss of energy depends on the materials used, but the net effect of these reflections is to reduce the attenuation between source and receiver. Another important factor is the orientation of the speaker with respect to the receiver. The current study was designed to better quantify these effects.
MEASUREMENT PROCEDURES
MEASUREMENT PROCEDURES
The floor of the simulated office shown in Figure 1 measured
3.66 x 4.88 m. The floor was a layer of 12.5-mm OSB board covered with a carpet and laid on top of the open-grill floor of the anechoic chamber. The screens surrounding the work area (denoted S1 to S6 in the figure) were made of 12.5-mm OSB board and had a height of 1.5 m. Three simple desks were also installed at the corners as shown. The simulated computer monitors were pieces of OSB board measuring 380 x 380 mm or 508 x 508 mm. These were mounted on top of 150-mm high plastic boxes used to simulate the computer CPU units.
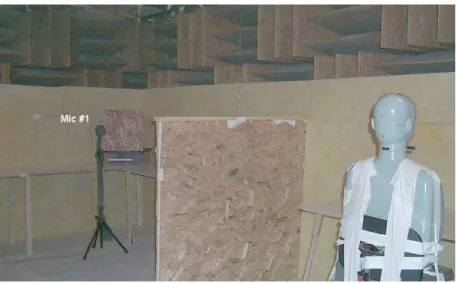
The sound source was the Bruel and Kjaer Head and Torso Simulator (HTS) placed in front of a desk at one corner of the work area. The mouth of the HTS was 1 m from the screens and 1.2 m above the floor. Sound pressure levels at two locations at the other corners of the work area were measured with two Bruel and Kjaer 12.5-mm condenser microphones located 1.2 m above the floor and 1 m from the screens. Figure 3 shows the HTS placed in front of the desk in the simulated work area.
Figure 3: The B&K Head and Torso simulator (HTS) sound source in position for measurements.
MEASUREMENT PROCEDURES
The HTS could be oriented at different angles with respect to the receiving microphones as shown in Figure 1. In most cases, only three orientations were used: 0°, 45°, and 90°.
For some cases, a 1.3-m wide middle screen blocked the line of sight between the source and microphone #1 as shown in Figure 1 and Figure 4. Two heights were used for this screen: 1.22 m and 1.5 m.
Figure 4: Picture showing location of the middle screen between the HTS and Microphone #1.
The initial configuration consisted of only the sound source and the two microphones on the carpeted floor with no furniture or screens in the work area. Effects of the different types of furniture within the work area were studied by adding the following items in stages.
• Reflective screens.
• Screens covered with 25-mm thick dense fiberglass.
• Simulated desks.
• Simulated computer monitors.
• A middle screen between the HTS and Mic 1
• A filing cabinet between the HTS and Mic 1
• Bookshelves around the workstation of the HTS
RESULTS & DISCUSSIONS
RESULTS & DISCUSSIONS
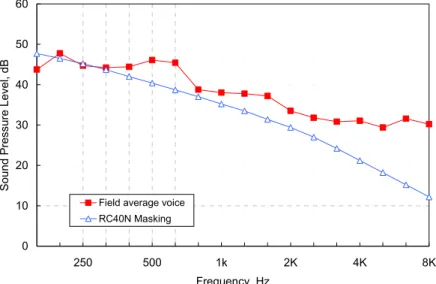
In a given frequency band, the difference between the sound level measured at the receiving microphone and the level 0.9 m from the mouth of the HTS is the attenuation for that particular arrangement. Attenuations were measured in one-third octave band frequencies from 160 to 8000 Hz. These attenuations were used to calculate values of Speech Intelligibility Index (SII) 6 for each measurement. The voice level used was the average determined by NRC from measurements2. The spectrum of the measured average voice level is shown in Figure 5. The background noise contour assumed is also shown in the figure. It is one recommended for use in open offices.
0 10 20 30 40 50 60 250 500 1k 2K 4K 8K Frequency, Hz
Sound Pressure Level, dB
Field average voice RC40N Masking
Figure 5: Measured average voice levels and masking noise spectrum assumed in calculations of SII.
When the following results are reviewed, it is important to keep in mind that the SII values for the approximate upper limit for “normal” privacy is 0.2. Also, it is important to refer frequently to Figure 1 to understand what changes are being made to the physical layout of the simulated office.
RESULTS & DISCUSSIONS
Effect of Source Orientation
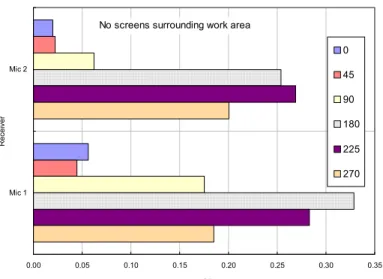
0.00 0.05 0.10 0.15 0.20 0.25 0.30 0.35 Mic 2 Mic 1 Receiver SII 0 90 225 No screens surrounding work area
45
180
270
Figure 6 shows results for the initial configuration in which only the sound source and the two microphones were placed on the carpeted floor with no screens or other furniture in the work area. With no reflecting surfaces inside the anechoic room, the Speech
Intelligibility Index depends strongly on the orientation of the speaker with respect to the listener. Sound pressure levels directly behind the speaker are about 7 dB below those measured directly in front.5 At 0° and 45° the measured SII values were well below the 0.2 limit for “normal” privacy, because the HTS sound source was facing away from the microphones. The SII values passed the 0.2 limit when the HTS was facing the receivers as represented by the 180° and 225° cases.
RESULTS & DISCUSSIONS 0.00 0.05 0.10 0.15 0.20 0.25 0.30 0.35 Mic 2 Mic 1 Receiver SII 0 90 225 No screens surrounding work area
45
180
270
Figure 6: Dependence of SII values on the orientation of the HTS sound source.
Effect of reflecting screens
Hard, reflecting screens around work stations redirect and the sound and concentrate it within the work area, so they can be expected to reduce speech privacy.
The effect of adding reflecting screens, two at a time, to enclose the work area is shown in Figure 7. The base case (NNNNNN)
represents no screens at the six screen positions (See Figure 1) and SSNNNN represents the case with reflecting screens at positions S1 and S2 and so on. Results show that speech privacy was lost even when only two reflecting screens were installed at the source corner. The situation became worse when the six reflecting screens were installed.
RESULTS & DISCUSSIONS 0.00 0.05 0.10 0.15 0.20 0.25 0.30 0.35 0.40 0.45 0 45 90 Orientation SII SSSSSS SSSSNN NNNNNN Mic 1 SSNNNN SSNNNN 0.00 0.05 0.10 0.15 0.20 0.25 0.30 0.35 0.40 0.45 0 45 90 Orientation SII SSSSSS SSSSNN NNNNNN Mic 2
Figure 7: Effect on the SII values of enclosing the work area with reflecting screens.
Effect of absorptive screens
An obvious procedure for dealing with the reflections from the hard-surfaced screens is to cover them with sound-absorbing material. The results of doing this are presented in Figure 8. For comparison, the cases with no screens and that with 6 reflecting screens are repeated in the figure. Figure 8 shows that significant improvement to speech privacy can be obtained by covering the first two reflecting screens, close to the HTS, with a layer of 25 mm thick fiberglass. Further improvements resulted when all six screens were covered
RESULTS & DISCUSSIONS
with fiberglass (FFFFFF). While not as good as the anechoic situation, acceptable privacy was restored in all cases except one
0.00 0.05 0.10 0.15 0.20 0.25 0.30 0.35 0.40 0.45 0 45 90 Orientation SII No screens SSSSSS FFSSSS FFFFFF Mic 1 FFFFSS FFFFSS 0.00 0.05 0.10 0.15 0.20 0.25 0.30 0.35 0.40 0.45 0 45 90 Orientation SII No screens SSSSSS FFSSSS FFFFFF Mic 2
Figure 8: Effect on the SII values of covering the reflective screens with absorbing materials.
Effect of desks and computer monitors
Simple ray-tracing suggests that desk surfaces should not reflect speech so as to decrease privacy. Large computer monitors, if positioned at certain angles, can redirect significant amounts of speech energy and might well increase annoyance. These two factors were investigated using simulated components.
RESULTS & DISCUSSIONS
The reference case chosen was that with six absorptive screens (case FFFFFF). Figure 9 shows that adding simple table-like desks (case DDDDDD) made insignificant changes to the SII values as expected.
Three computer monitor situations were examined. In the legend of Figure 9, 1Mon1 represents one #1 monitor (380 x 380 mm — 15-inch monitor) with CPU unit placed in front of the HTS. 3Mon1 represents three #1 monitors with CPU units installed at both source and microphone workstations. 1Mon2 represents one 508 x 508 mm (19-inch) monitor on a CPU unit placed in front of the HTS.
As expected, adding computer monitors can have detrimental effects depending on the speaker orientation and the receiver locations. The effect was more pronounced for Mic 2 than for Mic 1 because reflections from the monitor at the source location were directed mostly towards Mic 2.
Thus, in the ‘team style’ open office, the placement of computer monitors requires some consideration. Acoustical requirements need to be reconciled with ergonomic and other needs. Lowering the monitor to the desk level and angling the screen so it points upward will direct sound up to the ceiling. Even further, one might place the monitor in a hole in the desk surface so the screen is at the level of the desk surface. Both of these options require changes of head position and may not be acceptable. The second option especially is a significant departure from normal usage.
RESULTS & DISCUSSIONS 0.00 0.05 0.10 0.15 0.20 0.25 0.30 0 45 90 Orientation SII FFFFFF DDDDDD 1Mon1 1Mon2 Mic 1 3Mon1 3Mon1 0.00 0.05 0.10 0.15 0.20 0.25 0.30 0 45 90 Orientation SII FFFFFF DDDDDD 1Mon1 1Mon2 Mic 2
Figure 9: Changes in SII due to adding desks, computer monitors and CPU units to the working area.
Effect of a blocking screen
Any barrier that blocks the direct line of sight between two workstations, will provide some sound attenuation. The middle screen in Figure 1 was inserted to determine the benefits of a screen that blocks the line of sight yet still allows a worker to easily regain visual contact with a neighbour simply by rolling or leaning backward in the chair. The openness of the team-style area can largely be preserved but some additional privacy is provided between some workstations.
RESULTS & DISCUSSIONS 0.00 0.05 0.10 0.15 0.20 0.25 0.30 0 45 90 Or ientati o n SII No Mid Scr MS1 bare MS2 absorptive Mic 1 File Cabinet MS2 bare MS1 absorptive File Cabinet MS2 bare MS1 absorptive 0.00 0.05 0.10 0.15 0.20 0.25 0.30 0 45 90 Orientation SII No Mid Scr MS1 bare MS2 absorptive Mic 2
Figure 10: Effect of the middle blocking screen on the SII values for Mic 1 and Mic 2 positions.
Two sizes of the middle screen were used to block the line of sight between the HTS and Mic 1: 1.3 m wide by 1.22 m high (MS1) and 1.3 m wide by 1.5 m high (MS2). For comparison purposes, the 3Mon1 case of the previous section is used as the reference case (No Mid Scr in the figure). The simulated computers and monitors (3Mon1) were in place for all the measurements in this section. Figure 10 shows that significant reduction in the SII values were obtained at Mic 1 because the screen blocked the line of sight between the source and the receiver. In general, higher or absorptive screens were more effective. Replacing the middle
RESULTS & DISCUSSIONS
screen with a filing cabinet gave no significant improvement because it did not block the sound.
Addition of bookshelves
Open bookshelves are commonly used in open plan offices and their effect on speech privacy has been investigated in this study using a simple setup as shown Figure 11. The bookshelves were installed only at the source corner. The initial configuration for this short series used absorptive screens and desks. The middle screen was in place with and without absorptive facings. The simulated
computers and monitors (3Mon1) were in place for all the measurements in this section.
Figure 11: Arrangement of bookshelves at the source corner.
Results presented in Figure 12 show a small beneficial effect of the bookshelves for most cases except the case with the reflective middle screen and the HTS oriented at 0°. At 0°, sound reflections were directed towards the receivers Mic 1 and Mic 2, so there was an increase in the SII values due to the increase in levels. At 45°, dominant reflections came from the computer monitor and at 90° reflections from the bookshelves were directed away from the receivers. These results demonstrated once more the benefit of using absorptive screens in open plan offices.
RESULTS & DISCUSSIONS 0.00 0.05 0.10 0.15 0.20 0.25 0.30 0 45 90 Orientation SII MS2, absorptive + Shelf MS2, absorptive MS2, bare + Shelf Mic 1 MS2, bare MS2, bare 0.00 0.05 0.10 0.15 0.20 0.25 0.30 0 45 90 Orientation SII MS2, absorptive + Shelf MS2, absorptive MS2, bare + Shelf Mic 2
Figure 12: Effect of adding bookshelves to the workstation of the HTS.
SUMMARY
SUMMARY
The qualitative results presented show the importance of having as much as possible of the interior surface of a workstation covered with sound-absorbing material. Arranging the work positions so the occupants normally face away from each other is important. The use of small barriers can increase speech privacy without seriously disturbing communication. Courteous and considerate behavior by the occupants is essential to avoid disturbance. Calling to co-workers across the workstation and casual conversations from passers-by outside the work station will obviously be disruptive.
REFERENCES
REFERENCES
1
Measurements of Sound Propagation in Open Offices, A.C.C. Warnock and W.T. Chu. Internal Report IR-836. Institute for Research in Construction. NRCC. August 2000.
2
Voice and Background Noise Levels Measured in Open Offices, W.T. Chu and A.C.C. Warnock. Internal Report IR-837. Institute for Research in Construction. NRCC. August 2000.
3
Guide To Open Office Acoustics, A.C.C. Warnock. Research Report B3144.3. Institute for Research in Construction. NRCC. August 2000.
4
Measurements of screen insertion loss in an anechoic chamber, A.C.C. Warnock and W.T. Chu. Research Report RR-157. Institute for Research in Construction. NRCC. September 2001.
5
Detailed Directivity of Sound Fields around Human Talkers, W.T. Chu and A.C.C. Warnock. Research Report RR-104, Institute for Research in Construction. NRCC. September 2001.
6
ANSI S3.5. American National Standard Methods for the
Calculation of the Speech Intelligibility Index.