Publisher’s version / Version de l'éditeur:
Journal of the Acoustical Society of America, 98, 5, pp. 2590-2597, 1995-11-01
READ THESE TERMS AND CONDITIONS CAREFULLY BEFORE USING THIS WEBSITE. https://nrc-publications.canada.ca/eng/copyright
Vous avez des questions? Nous pouvons vous aider. Pour communiquer directement avec un auteur, consultez la première page de la revue dans laquelle son article a été publié afin de trouver ses coordonnées. Si vous n’arrivez pas à les repérer, communiquez avec nous à [email protected].
Questions? Contact the NRC Publications Archive team at
[email protected]. If you wish to email the authors directly, please see the first page of the publication for their contact information.
NRC Publications Archive
Archives des publications du CNRC
This publication could be one of several versions: author’s original, accepted manuscript or the publisher’s version. / La version de cette publication peut être l’une des suivantes : la version prépublication de l’auteur, la version acceptée du manuscrit ou la version de l’éditeur.
Access and use of this website and the material on it are subject to the Terms and Conditions set forth at
Objective measures of listener envelopment
Bradley, J. S.; Soulodre, G. A.
https://publications-cnrc.canada.ca/fra/droits
L’accès à ce site Web et l’utilisation de son contenu sont assujettis aux conditions présentées dans le site
LISEZ CES CONDITIONS ATTENTIVEMENT AVANT D’UTILISER CE SITE WEB.
NRC Publications Record / Notice d'Archives des publications de CNRC:
https://nrc-publications.canada.ca/eng/view/object/?id=be12bb70-20ce-4d9e-ab16-99b48af4ef6c https://publications-cnrc.canada.ca/fra/voir/objet/?id=be12bb70-20ce-4d9e-ab16-99b48af4ef6chttp://www.nrc-cnrc.gc.ca/irc
Obje c t ive m e a sure s of list e ne r e nve lopm e nt
N R C C - 3 8 9 3 8
B r a d l e y , J . S . ; S o u l o d r e , G . A .
N o v e m b e r 1 9 9 5
A version of this document is published in / Une version de ce document se trouve dans:
Journal of the Acoustical Society of America, 98, (5), pp. 2590-2597, November
01, 1995
The material in this document is covered by the provisions of the Copyright Act, by Canadian laws, policies, regulations and international agreements. Such provisions serve to identify the information source and, in specific instances, to prohibit reproduction of materials without written permission. For more information visit http://laws.justice.gc.ca/en/showtdm/cs/C-42
Les renseignements dans ce document sont protégés par la Loi sur le droit d'auteur, par les lois, les politiques et les règlements du Canada et des accords internationaux. Ces dispositions permettent d'identifier la source de l'information et, dans certains cas, d'interdire la copie de documents sans permission écrite. Pour obtenir de plus amples renseignements : http://lois.justice.gc.ca/fr/showtdm/cs/C-42
Objective measures of listener envelopment
J.
S. BradleyInstitute for Research in Construction, National Research Council Canada, Ottawa, Ontario KiAOR6, Canada
G. A. Soulodre
Department of Psychology, Carleton University, Ottawa, Ontario K1S586, Canada
(Received 15 February 1995; revised 9 June 1995; accepted 21 June 1995)
This paperfeports the results of subjective studies to detennine objective predictors of perceived listener envelopment in concert halls. Subjects, seated in an anechoic room, were exposed to simulated sound fields that were expected to have varied listener envelopment. As independent variables: the reverberation time,'the early-to-late sound ratio, the overall sound level, and the angular distribution of the late-arriving sound levels were varied. All of these factors had statistically significant effects on perceived listener envelopment. The results indicate, however, that the angular distribution of the late arriving sound and the overall level would have the largest effects in real concert halls. Thus listener envelopment depends on having strong lateral reflections arriving at the listener 80 ms or more after the direct sound. Several objective measures correlated significantly with listener envelopment. However, a new measure, the late lateral sound level, as measured using a figure-of-eight microphone, was found to be both conceptually simple and a very good predictor of the perceived listener envelopment of the sound fields in this experiment. PACS numbers: 43.55.Hy, 43.55.Ka
INTRODUCTION
Subjectively perceived spatial impression or spacious-ness in cnncert halls has been shown to be composed of at least two components: apparent source width (ASW) and listener envelopment (LEV).'·2 While ASW was extensively studied some time ago,3.4 LEV has only more recently been investigated. Barron recognized that early reflections and re-verberation produced different spatial effects, but his studies focused on ASW. Morimoto and Maekawa5 considered en-velopment, and Morimoto and lida' clearly defined these two principle aspects of spatial impression. However, until very recently the tenninnlogy used to describe various aspects of spatial impression has been confused. In his early work, Barron3•4usually used the term spatial impression to describe what was really ASW. That is, his subjects rated the apparent width of the sound source. Morimoto and Maekawa5 de-scribed separate source broadening and listene( envelopment effects, but referred to the broadening as spatial impression. However, in a more recent paper Morimoto and lida' do use the terms apparent source width and envelopment as we do in this paper.
Our previous work'·2 demonstrated that while ASW is influenced by the relative level and angle of arrival of early lateral reflections, LEV is related to the level of later arriving lateral energy. Here, later arriving sound refers to reflections arriving at least 80 ms after the direct sound. In addition, stronger levels of later arriving sound were found to diminish . the subjects' ability to perceive changes in the ASW of sound fields. The results of six experiments showed that LEV is influenced by the level, direction of arrival, and temporal distribution of later arriving reflections. From one of the six experiments, it was detennined that LEV judgments were
strongly related to objective measures of late lateral sound levels. That is, the levels of sound arriving from the side 80
ms or more after the direct sound. However, this result was
based on a small number of sound fields with quite limited variation of the sound field parameters.
The present experiments were designed to examine more extensively the suitability of various objective acoustical measures as predictors of LEY. Two new experiments each included 27 sound fields from the combinations of three val-ues of each of three different independent variables. The first experiment included sound fields made up of the 27 combi-nations of three levels of reverberation time, RT, early-to-Iate sound ratio, Cso, and angular distribution of the late arriving sound. The second experiment included sound fields made up of the 27 combinations of three levels of sound level, early-to-Iate sound ratio, Cso, and angular distribution. It
was hoped that from this more complete manipulation of the important sound field parameters, objective predictors of LEV judgments could be more reliably determined.
I. METHOD
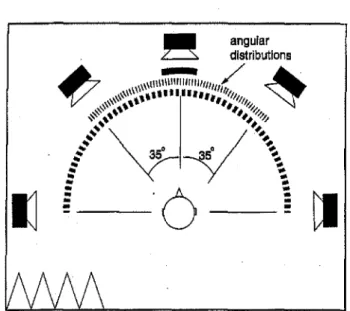
Two experiments were conducted in which subjects were exposed to simulated sound fields in an anechoic room. Figure I illustrates the setup of the loudspeakers in the anechoic room. The level and delay of reflections and rever-beration were set by programmable digital equalizers and
reverberators. Separate reverberators were used for each
loudspeaker to ensure that their outputs were not highly cor-related. The setup allowed individual control of the reflec-tions and reverberation for each loudspeaker. Both experi-ments were automated and a computer controlled the changes to the sound fields and recorded subjects' responses.
J. S. Bradley and G. A. Soulodre: Measures of envelopment 2591 77. 1.0 90 1.9 High 1.9 1.0 90 77 t, ms vary AT 74. 4.0 35 1.9 1.2 4.0 35 77 Medium vary level 71. 7.0 O. 1.9 0.5 7.0 O. 77 Low A F L F
o
15 40 50 70 80 Direct Experiment 2A-weighted sound level,dB CgO,dB Angle, degrees RT, s Experiment1 RT.s Cso, dB Angle, degrees
A-weighted sound level, dB
TABLE1.Values of the independent variables at mid-frequencies for the 27 sound fields of each experiment.
FIG. 2. Symbolic impulse response showing the structure of the sound fields usedinExperiment 1. (F;:front, L;:left, and R;:right±35° loudspeakers) (LL;:left and RR=right±90° loudspeakers).
Thus there were 27 different sound fields consisting of three values of RT, by three values of CgO, by three values of angular distribution. Because they were presented with each sound field pair twice, subjects made a total of 54 judgments of sound field pairs. the nominal values of midfrequency (500 and 1000 Hz) RT, CgO, and angular distribution are given in TableI. This table shows that the sound fields were representative of a wide range of conditions similartothose found in real rooms. Figure 2 illustrates that C
so
values were varied by adjusting the relative level of the late arriving sound. RT values were varied by changing the reverberation time setting of the reverberators. The angular distribution of the late arriving energy was varied by radiating reverberant sound from one, three, or five loudspeakers corresponding to the late sound arriving from 0",±
35", or ±90°. In varying the angular distribution, the total late sound level was kept constant. The late arriving sound was evenly distributed among the one, three, or five loudspeakers. .Experiment 2 was very similar to experiment 1 except that the overall sound level of the sound fields was' varied and RT was kept constant at 1.9 s. Thus there were 27 sound fields consisting of three values of overall level, by three values ofCgO'by three values of angular distribution. Again, SUbjects heard each sound field pair twice and thus made a total of 54 judgments. The nominal values of mid-frequency overall level,
Cso,
and angular distribution are given in Table I. As in experiment 1, the sound fields were representative of a wide range of conditions similar to those found in real rooms.FIG. 1. Experimental setup of loudspeakers and angular distribution of late arriving sound energy.
2591 J.Acousl. Soc. Am.,Vol. 98, No.5, PI. 1, November 1995
Tests were in the form of paired comparisons in which subjects rated the magnitude of the difference of the per-ceived listener envelopment, LEV, between each pair of sound fields. The first 20 s of the Denon anechoic recording PO 6006 of Handel's Water Music' Suite was used as the test stimulus. The music was repeated continuously throughout each test. Subjects could toggle back and forth at will be-tween the two sound fields of each pair, and could take as long as they wanted to make their judgments. SUbjects rated the magnitude of the difference in listener envelopment, LEV, using a 5-point response scale. A score of 1 indicated that the two sound fields had the same LEV. A score of 5 indicated the largest expected difference in envelopment. Af-ter they enAf-tered their estimate of the magnitude of the differ-ence in LEV, the computer controlling the experiment ran-domly selected the next pair of sound fields. Fourteen subjects were used in the first experiment and 15 subjects in the second experiment. In both tests, subjects experienced each sound field pair twice and the average of their two scores was used in the subsequent analyses. There was a practice session before each test to ensure that subjects were familiar with the requirements of each test and that they were aware of the range of conditions in that test.
Because it had previously been demonstrated that LEV is infiuencedby later arriving sound,1,2only the later arriving
sound levels and decay times were varied as part of the ex-periments. Figure 2 illustrates the structure of the impUlse responses that were used in the experiments. The direct sound and the four early reflections were not varied as part of the experiment other than in adjustments to maintain con-stant overall level. Thus measures of the relative properties of the early sound field such as the lateral energy fraction and the interaural cross-correlation coefficient remained con-stant.
In experiment I, three quantities were varied. These were the reverberation time, RT, the ratio of early-to-Iate sound energy, CgO, and the angular distribution of the later
arriving sound. Three values of each quantity were used.
Objective measurements of the sound fields were made using 'our auditorium acoustics measurement software, RAMSoft-II? This system provides octave band values of a number of room acoustic quantities from impulse response measurements using both ornni-directional and figure-of-eight pattern microphones. The acoustical quantities consid-ered in these experiments are defined in the Appendix. Note that several of these quantities are new and a new notation has been introduced that indicates the time interval over which each quantity is measured.
The figure-of-eight microphone was positioned with its null pointed toward the location of the source of the direct sound. The responses from this microphone were used to obtain measures of the early and late arriving lateral sound for each of the sound fields.
Binaural impulse responses were also obtained using a Briiel & Kjaer type
4i28
head and torso simulator. This al-lowed the calculation of various interaural cross-correlation measures8that are also included in the Appendix.II. ANALYSIS OF VARIANCE RESULTS A. Experiment 1
In experiment I, subjects rated the magnitude of the dif-ferences in listener envelopment, LEV, between .each of the 27 sound fields and one reference sound field: The reference sound field corresponded to the sound field having the iowest RT, the lowest reverberant level (highest Cso),and the mini-mum angular distribution. The mean scores of the 14 sub-jects for each of the 27 sound fields are given in Table II. An analysis of variance test, ANOVA, of these results showed that there were highly' significant main effects (p<O.OOI) of all three independent variables (RT, Cso ,and angular distri-bution). Herep is the probabili,ty of these effects occurring by chance. There were no significant two-way or three-way interaction effects.
These results clearly show that all three independent variables (RT, C80'and angular distribution) significantly
af-fect perceived LEY. However, the efaf-fects of these three vari-ables are independent and do not interact with or influence each other.
2592 J.Acoust. Soc. Am., Vol. 98, No.5, PI. 1, November 1995
B. Experiment 2
Experiment 2 was similar to experiment 1 except that variations in' overall level replaced varied reverberation times. Subjects again rated the magnitude of the differences in listener envelopment, LEV, between each of the 27 sound fields and one reference sound field. The reference sound field corresponded to the sound field having the lowest over-all sound level, the highest C80'and the lowest angular 、ゥウセ
tribution. The mean scores of the 15subjects for each of the 27 sound fields are given in Ta.ble II. An analysis of variance test, ANOVA,of these results showed that there were highly significant main effects (p<O.OOl) for all three independent variables (overall sound level,CgO'and angular distribution).
There were no significant two-way or three-way interaction effects. However, the C80by angular distribution interaction
was almost significant(p<O.06).
These results clearly show that all three iIidependent variables (overall sound level,CgO, and angular distribution) significantly influence perceived LEV. There was a weak (but not quite significant) interaction effect suggesting that C&0
had more effect for sound fields with greater angular distri-bution. That is, for sound fields with the late energy distrib-uted over ±90°, varied CgO(or relative late sound levels) had the greatest effect on LEV.
III. PRACTICAL IMPORTANCE OF THE RESULTS
The analysis of variance tests give an indication of the statistical significance of the rf:sults or the probability of the results occurring by chance. It is also of interest to know how large a change in each independent variable is required to obtain a substantial change in LEV responses and whether such differences are likely to be found in real concert halls. Because there are no interaction effects, it is possible to con-sider the average effect of each independent variable by av-eraging responses over all other variables. For example, the average effect of RT can be considered by averaging re-sponses to the nine combinations of Csoand angular distri-bution for each of the three values of RT.
The average scores at each of the three levels of each independent variable are given in Table III for both
suggests that a l5-dB change in A-weighted sound (from 66 to 81 dB) level wonld have approximately the same effect on LEV scores as the maximum change in angular distribution
in this experiment.
Thus both overall level and angular distribution will have large effects on the differences in perceived LEV expe-rienced in actual concert balls. It is likely that the relative late levels (as measured by Cso) will have smaller influences on perceived LEV, and that possible changes in RT values will have even smaller effects. Thus to obtain a sufficient degree of LEV, it is more important to have higher sound levels and particularly higher late sound levels than it is to obtain longer reverberation times. Furthermore, the late en-
,
ergy must arrive from lateral directions.strongly correlated with LEV scores in all six octave bands (correlation coefficients 0.8 or larger,p<O.OOI or better).
None of the objective measures examined so far have accounted for both the level and spatial distribution compo-nents of LEY. It would be possible to in some way combine a measure which accounts for the relative level of the late sound with one of the measures which reflects the spatial distribution component. For example, one might attempt to combine
Oso
with IACCso or LFBo, in order to account forthe two main components of LEV. A more appealing ap-proach, is to find a single measure which accounts for both the level and spatial distribution components of LEV. One such measure is the relative level of the late lateral energy, LGso as defined in Eq. (I).
(I) dB, LGso=10 lng{
jZャセHエI、エ
/
D
pセHエI、エIL
IV. OBJECTIVE PREDICTORS OF LEV
The results of the two subjective experiments indicate that listener envelopment in real rooms is primarily con-trolled by two independent components: level and spatial or
angular distribution. Therefore, a suitable objective predictor where the varions symbols are defined in the Appendix and for LEV must in some way account for both components. PFU), is the instantaneous lateral sound pressure, as mea-To test various predictors of LEV scores, octave band sured with a figure-of-eight microphone andPAUl is the re-values of a number of modem room acoustics measures were sponse of the same source at a distance of 10 m in a free-correlated with LEV scores. The Appendix defines the acous- field. When tested as a predictor of LEV scores, LGso tical quantities that were included in these analyses. The pat- measures were most strongly correlated with LEV scores in terns of the resulting correlation coefficients were quite simi- both experiments. Therefore, LGso appears to be a very good lar for the data of experiments 1 and 2. objective measure of LEV since it accounts for both the level
Because LEV is influenced by the late arriving lateral and the spatial distribution components.
sound, we did not expect measures based on only the early Because there has been little previous work on listener sound (the first 80 ms after the direct sound) to be related to envelopment in concert halls, 'it was not clear how octave LEV scores. This was indeed demonstrated to be the case in band measures should be optimally combined to best pro-that values of: LFgo,
ogo,
LGgo, and ャaccセッ were not sig- duce single number predictors of LEV. In a previous uificantly related to LEV scores. experimentl,2using sound fields consisting of the sixcombi-As a first step toward establishing a suitable objective nations of two values of RT and three values of 'angular measure of LEV, acoustical measures that are influenced by distribution, an A-weighted sum of relative late lateral sound later arriving sound, but which contain no directional infor- levels was found to successfully predict LEV scores. In pre-mation were considered. These measures could only account vious studies of spatial impression, low-frequency compo-for the level and temporal distribution components of LEV, nents have usually been found to be of particular subjective and ignored the spatial distribution component. Since the importance.4,IO-l3 For example, it is usually suggested that spatial distribution was found to be such an important factor lateral energy fraction measures should be averaged over the in creating the sense of listener envelopment, it was expected . -c-fouroctave-bandsfrom+25-to-lOOO-Hzol'tBecausethere-has that these measures would be only weakly related to LEV been no previous study to specifically examine the question scores. The analysis showed that the measures: Cso , TS, oセL of the relative importance of different frequency components
0so,
EDT, and RT, were indeed only weakly related to LEV on listener envelopment, several combinations of octave scores. (Correlation coefficients mostly between 0.45 and band measures were tried.0.7, p<O.OI in some octave bands.) These measures give For each of the five quantities related to the directional
some indication of how much late sound energy is present properties of the late arriving sound, five different combina-but no indication of the angular districombina-bution of the late sound. tions of octave band measures were considered as well as an In order to account for the spatial distribution compo- A-weighted sum of all six octave bands. The five quantities nent of LEV, measnres which reflect the directional charac- were LGso , LFBo, lセL lACC8'o, and ャaccセN The various teristics of the late arriving sound were considered. Varying octave-band sums of these five measures were then corre-the spatial distribution of corre-the late sound, of course, produces lated with the LEV scores. The resulting correlation coeffi-related changes in the correlation of the energy arriving at cients are given in Table IV. Good correlations were ob-the listener's ears. Therefore, LFBo, セL lACCso , and tained for all of the octave band combinations. The highest
ャaccセ were examined as potential predictors of LEY. Since correlation with LEV scores(r=0.99)was obtained for LGso
the spatial distribution was found to be very important to the values summed over the lowest four octaves (125 to 1000 sense of listener envelopment, it was expected that these Hz). Essentially the same high correlation was obtained from measures would correlate quite well with LEV scores. This the data of both experiments 1 and 2. Figures 5 and 6 show was confirmed and each of these measures was found to be plots of the relationship between LEV scores for the two
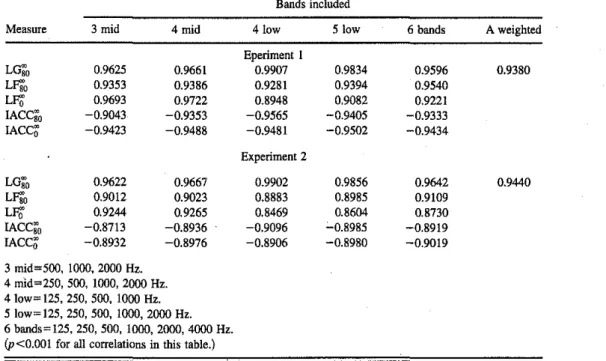
TABLE IV. Correlations of multiband acoustical measures with LEV scores.
Bands included
Measure 3 mid 4 mid 4 low 5 low 6 bands A weighted
Eperiment I LO
so
0.9625 0.9661 0.9907 0.9834 0.9596 0.9380 LF80 0.9353 0.9386 0.9281 0.9394 0.9540LFO
0.9693 0.9722 0.8948 0.9082 0.9221 IACC" -0.9043 -0.9353 -0.9565 -0.9405 -0.9333 IACCD' -0.9423 -0.9488 -0.9481 -0.9502 -0.9434 Experiment 2 LOso
0.9622 0.9667 0.9902 0.9856 0.9642 0.9440 LF80 0.9012 0.9023 0.8883 0.8985 0.9109LFO
0.9244 0.9265 0.8469 0.8604 0.8730 IACCso
-0.8713 -0.8936 -0.9096 -0.8985 -0.8919 IACCa' -0.8932 -0.8976 -0.8906 -0.8980 -0.9019 3 mid=500, 1000, 2000 Hz. 4 mid=250, 500, 1000, 2000 Hz. 4 low= 125, 250, 500, 1000 Hz. 5 low= 125, 250, 500, 1000, 2000 Hz. 6 bands= 125, 250, 500, 1000, 2000, 4000 Hz.(p<O.OOIfor all correlationsinthis table.)
2595 J.Acouot. Soc. Am.. Vol. 98, No.5, PI. 1, November 1995 FIG. 5. Mean LEV scores from experiment I plotted versus late lateral sound levels, LOgo (averaged over the four lower octave bands) (correlation coefficientr=O.99).
..0'
0oQ/
/ 0 0 ..'セᄋVᄋ
,8'
ッセLイゥヲ
0 ... 07/0
0 //j;
o ..'
,6
...·0セ
QQ[QZNNセ⦅⦅G⦅セ⦅l⦅セ⦅G⦅セ⦅NNNlNセMMMG ·20 ·15 ·10 -5 0 5LG;(125-1000).
dB
2 4r-J. S. Bradley and G. A. Soulodre: Measures of envelopment 2595
5 , - - - ; - - - ,
FIG. 6. Mean LEV scores from experiment 2 plotted versus late lateral sound levels, LO
so
(averaged over the four lower octave bands) (correlation coefficientr=O.99).the other measures. tn experiment I, values of
LFBo.
IF,;'.
IACC
so.
and lACCo
correlate more strongly with LEV val-ues than is found for the corresponding data of experiment 2. These four measures are not influenced by sound level and so do not reflect the effects of the changes in overall lev61 that were part of experiment 2 and which have an important effect on the resulting LEV scores. If experiment 2 had in-cluded a larger range of sound levels, the correlations with these measures would have been even lower. Thus there is a strong argument that LGso
would best predict expectedlis-5
,
セッ セ 0LG; (125-1000).
dB
5 , - - - " "セOMMML /0 0/')i
0 0 / /@/ 0 /o ..."
/:;' 0,6
r?'
2r-
0////0
セO
Oセ
1 -15 4r-experiments and the LG
so
values summed over the lower four octave bands.While the LG
so
values from the low four octave sums correlate most strongly wilh LEV values, a number of other combinations produce quite high correlation coefficients. Many of the differences between correlation coefficients are quite small and these differences may not be statistically sig-nificant.LG
so
values correlate equally strongly with the LEV scores from both experiments, but there are differences fordB.
(A2) (AI) The center time, TS, is the center of gravity of the impulse response. Itis related to subjective judgments of clarity and is calculated
as
follows from the impulse response obtainedusing an omnidirectional microph9ne,
TS=
jッセOpRHOI、ャ
/joセーRHOI、ャL
dB.ACKNOWLEDGMENTS
APPENDIX: DEFINITION OF ACOUSTICAL MEASURES
J. S. Bradley and G. A. Soulodre: Measures of envelopment 2596
Early decay time, EDT, is the 60-dB decay time measured by a straight line fit to the first 10 dB of the decay curve from a reverse integrated Schroeder decay curve. EDT values relate to judgments of reverberance.
Reverberation times, RT, were calculated as the 60-dB decay time obtained from straight line fits to the reverse in-tegrated Schroeder decay curves between - 5 and - 30 dB.
The relative sound level
0;'
(sometimes referred to asI
strength) is a measure of the amplification of sound levels at particular locations in halls. Increased
0;'
values will lead toI
louder sounds. The
0:'
values are calculated from theim-I
pulse response obtained using an omnidirectional micro-phone as follows,
0;:=
10 IOg(J'>2(/)dl /jッセ pセHエI、ャIG
dB, (A3) where p(/) is the instantaneous pressure response measured with an omnidirectional microphone, and PA(/) is the re-sponse of the same source at a distance of 10 m in a free field.The total relative sound level, ッセ is defined as when 1,=0 and 12=00 s. The early relative sound level
ogo
is de-fined as when I,=0 and12=0.08 s. The late relative soundlevels ッセッ is defined as whenII=0.08 and12=00 s. Similarly, relative levels of the lateral sound can also be calculated as follows,
A number of modern room acoustics quantities were
in-cluded in the analyses of this paper. They are defined in this appendix. All are obtained from impulse response measure-ments. In many cases, new notation has been iutroduced in this paper, to describe measures related to early, and late time periods. In this work, "early" refers to the first 80 ms after the direct sound. However, the new notation specifically de-scribes the time interval over which the quantity is measured. Cso is an earlyllate sound ratio with an 80 ms early time limit. It is related to subjective judgments of clarity or the balance between clarity and reverberance and is calculated
as
follows from the impulse response obtained using an omni-directional microphone.Cso=IO
ioァHjセPXPーRHOI、ャ
/f:sl
2(/)dl),The second author is funded by a grant from the Social Sciences and Humanities Research Council of Canada. tener envelopment in the fnll range of conditions to he
ex-pected in real concert halls.
Although these experiments were not designed to spe-cifically investigate the question of the relative importance of various frequency hands, they suggest that the low- and mid-frequencies are most important for adequate listener envel-opment.
Since the completion of these experiments, measure-ments at 80 locations in 15 different auditoria have been reprocessed to estimate lgセッHャRUMQPPPI values. These new results showlgセッHャRUMQPPPI values to range from -14.4 to +0.8 dB. Thus the rangeッヲlgセッHQRUMQPPPI ,values included in experiment I and shown in Fig. 5 are quite representative of conditions in real halls.
The present results confirm previous findingsl•2that lis-tener envelopment is influenced by the level, direction of arrival, and the temporal distribution of later arriving reflec-tions. Listener envelopment is one of at least two compo-nents of spatial impression. LEV may be the more important component of spatial impression because changes in ASW were. masked by the late energy. The converse has not been reported.
These new results support suggestions concerning the subjective importance of the reverberant level. However, it is now known that the direction of arrival of the reverberant sound is also important. One can assume that the new results contribute to explaining the acoustical success of narrow rectangular concert halls which are presumed to have rela-tively high levels of late lateral energy.
From these more extensive new tests, the angle of ar-rival and the level of the late lateral sound energy were con-cluded to have the largest influence on perceived listener envelopment in real concert halls. The balance between early and late arriving sound energy was of less importance, but is
more important than realistic variations in reverberation
time.
A new measure, the late lateral sound level, lgセッL best predicted listener envelopment scores in these experiments.
lgセッ values, summed for the lower four octaves (125 to 1000 Hz), gave the highest correlations with LEV scores. Other measuresHlセッL lセL iaccセッL andiaccセI influenced solely by the angular distribution of the late sound, were also quite strongly related to LEV scores. These correlations are expected to be weaker iflarger variations in sound levels are included, because these measures are not influenced by over-all sound levels.
The relative late lateral sound level,lgセッ is proposed as a conceptually simple measure that best predicts listener en-velopment. It is also simple to measure and to predict from computer models. The present results suggest that octave band values for the four octaves from 125 to 1000 Hz should be summed for best results. Subsequent studies may be re-quired to further fine tune this measure and specifically to more thoroughly investigate optimum combinations of vari-ous frequency bands.
V. CONCLUSIONS
2597 J.Acoust. Soc. Am .• Vol. 98, No.5, Pt. 1. November 1995 J, S, Bradley and G. A, Soulodre: Measures of envelopment 2597
1J.S. Bradley and G. A. Soulodre, "The Influence of Late Aniving Energy on Spatial Impression," J. Acoust. Soc. Am. 97, 2263-2291 (1995). 20-,A. Soulodre and J. S. Bradley, "The Influence of Late Arriving Energy
on Concert Hall Spatial Impression," in Proceedings of the Sabine CenM
tennial Symposium, Cambridge, MA(AcQllstical Society of America, Woodbury. NY, 1994).pp. 101-104.
3M. Barron, "The Subjective -Effects of First Reflections in Concert Halls: The Need for Lateral Reflections."J.Sound Vib. 15 (4). 475-494 (1971). 4M. Barron and A. 11. Marshall, "Spatial Impression due to Early Lateral Reflections in Concert Halls: The Derivation of a Physical Measure," J. Sound Vib.77 (2). 211C232 (1981).
SM", Morimoto and Z, Maekawa, "Auditory Spaciousness and
Envelop-ment," Proceedings. 13thᄋャセエ・イョ。エゥッョ。ャ .congress on AcousticsBelgrade, 1989 (Sava Centar. Belgrade). Vol. 2, pp. 215-218.
6M. Morimoto and K, rida, "A New Physical Measure for Psychological Evaluation ofIiSound Field; Front/Back Energy Ratio as a Measure of Envelopment," J.Acoust. Soc. Am. 93. 2282 (A) (1993).
7R,E. Halliwell andJ.S, Bradley, "RAMSoft-II: A Computer Based Room Acoustics Me1\surement System," J. Acoust. Soc. Am, 89, 1897 (A)
(199I).
IIJ.S. Bradley, "Companson of Concert Hall Measurements of Spatial Im-pression," J. Acoust. Soc. Am. 96, 3525-3535 (1994),
9r,
S. Bradley, "Data fromI3 North American Concert Halls," National Research Council, IRC Internal Report No. 668 (July 1994).IOJ.S. Bradley, G.A. Soulodre, and N, Popplewell, "Pilot Study of Simu-lated Spaciousness,"J.Acoust. Soc, Am.'93, 2283 (1993),
11M, Morimoto, K. lida, K.- Sakagami, andA.H. Marshall, "Physical Mea-sures of Auditory Source Width (ASW): Part 1. "Discussion of the Com-peting Measures, Degree of Interaural Cross Correlation (ICC) and Lateral Fraction(Lf), as Measures of ASW (Auditory Source Width)," in Pro-ceedings of Sabine Centennial Symposium,Cambridge, MA (Acoustical Society of America, Woodbury, NY. 1994). pp. 109-112.
12M. Morimoto,K. Iida, K, Sakagami, andA. H. Marshall, "Physical Mea-sures of Auditory Source Width (ASW): Part 2. "Comparison Between Various Physical Measures and,ASW (Auditory Source Width)," in Pro-ceedings of Sabine Cen.tennial Symposium, Cambridge, MA (Acoustical Society of America. Woodbury. NY, 1994), pp. 113- 116.
130,A. Soulodre, J. S, Bradley, and D. R. Stammen. "Spaciousness Judg-ments of Binaurally Reproduced Sound Fields,"J.Acoust. Soc,Am.93, 2283 (1993).
14M. Barron, "Auditorium Acoustics and Architectural Design" (E&FN Span, an imprintof Chapman and Hall, London, 1993), p. 61.
IACCso is obtained by integrating Eq. (A6) from 1=0.080 to
t=oo·
s.
(A6) (A4) (AS) dB, <I> LR セ\i^ LL(O)<I> RR(0)where PL(t) and PR(t) are the instantaneous pressure re-sponses at the left and right ears respectively of a dummy head.
The interaural cross correlation of the early sound, IACCgo is obtained by integrating Eq. (A6) from I =0 to / =0.08 s. The interaural cross correlation of the total sound, IACCO' , is obtained by integrating Eq. (A6) from /=0 to / =00 s. The interaural cross correlation of the late sound, where Pp(t) is the instantaneous pressure response of the lateral sound obtained from a figure-of-eight microphone with its directional null pointed towards the source. For LGO' the total relative lateralle"el, /1=0 and /2=00 s. For LGgo, the early relative laterallevel'/I=O andt2=80 s. For LGso , the late relative laterallevel,.ft=80 and /2=00 s.
In a similar manner, lateral energy fractions can be de-fined for the early, late and total impulse response parts.
f'
2jf"
LF,2= . pi(t)d/ p2(/)dl.
I t l · , t}
The lateral energy fraction of the total impulse response, LFQ, wonld correspond to /1=0 and 12=00 s. The lateral en-ergy fraction of the early sound, lfセッ would correspond to 11 =0 and /2=0.08 s. (In many cases, 11 =0.005 has been used in the integration of the lateral energy to fnrther diminish the effect of the direct sound ·on the lateral response.) The laterll! energy fraction of the late sound, LFSo, would correspond to /1 =0.08 and /2=00 s.
The interaural cross correlation is defined as the maxi-mum absolute value of the cross correlation function for