Bioinformatics approach to the study of the molecular
behaviour of mealybug wilt of pineapple
F.N. Peron1, R. Calloni2, J.A. Ventura1,3,a and P.M.B. Fernandes1
1Laboratório de Biotecnologia Aplicada ao Agronegócio, Universidade Federal do Espı́rito Santo, Vitória, ES, Brazil; 2Laboratório de Biologia Computacional e Molecular, Centro de Biotecnologia, Universidade Federal do Rio Grande
do Sul, Porto Alegre, RS, Brazil; 3Instituto Capixaba de Pesquisa, Assistência Técnica e Extensão Rural, Vitória, ES,
Brazil.
Abstract
Mealybug wilt of pineapple (MWP) is a disease caused by the Pineapple mealybug
wilt-associated virus (PMWaV) complex transmitted by Dysmicoccus brevipes and D. neobrevipes. MWP symptoms are characterized by root dessication, leaf wilting and
consequent failure to produce a fruit. The molecular mechanisms involved in the pineapple-PMWaV interaction for MWP symptomatology are still unclear. In this work, mRNAs of asymptomatic and symptomatic pineapple plants were evaluated using Illumina RNA sequencing technology. From a total of 79 million reads per sample, 16,097 genes were identified using STAR aligner and HTseq for paired-end files. Differentially expressed genes (DEGs) between the evaluated groups were estimated using DESeq2 and edgeR, with an FDR cutoff of ≤0.05. A total of 207 DEGs were detected, with 61 upregulated and 146 downregulated in symptomatic plants infected by PMWaV-2. The methodologies improved by the assays presented in this article and the detected DEGs can substantiate further researches with pineapple and the MWP disease.
Keywords: bioinformatics, pineapple, transcriptomic, PMWaV, STAR, DESeq2, edgeR INTRODUCTION
Mealybug wilt of pineapple (MWP) can lead to losses of up to 100% of production, affecting producers in Hawaii (Sether and Hu, 2001, 2002a), Brazil (Ventura and Zambolim, 2002), Cuba (Borroto-Fernandez et al., 2007), Australia (Gambley et al., 2008) and Taiwan (Shen et al., 2009).
Severe symptoms of MWP begin with root dessication followed by wilting and gradual discoloration (intense reddening) of leaves, which curl towards the soil and become completely dry at the tips. Infected plants may fail to fruit or produce an atrophied and withered fruit that is unsuitable for use fresh or for processing (Ventura and Zambolim, 2002). MWP is caused by a virus complex, the Pineapple mealybug wilt-associated virus (PMWaV), transmitted by the mealybugs Dysmicoccus brevipes and D. neobrevipes (Sether et al., 1998; Sether and Hu, 2002b).
PMWaV-1, PMWaV-2, and PMWaV-3 are associated with MWP disease development in pineapple. PMWaV-2 has been consistently reported in producer countries, except in Australia, as the main virus that causes MWP symptoms. Other PMWaVs are associated with reduced production but not with severe disease symptoms (Borroto-Fernandez et al., 2007; Gambley et al., 2008; Sether et al., 2005; Shen et al., 2009). The studies carried out to understand the aetiology of MWP focused on determining the causal agent, its molecular interaction with the plant and improvement of the plant based on the study of the pathogen genome and clonal cleansing (Melzer et al., 2001; Perez et al., 2006; Sether et al., 2001). In addition, the study of pathogenicity factors of PMWaV-1 and PMWaV-2 in Nicotiana
benthamiana (Dey et al., 2015), revealed the potential suppressive action of RNA silencing of
plant contributing to the understanding of pineapple-PMWaV. However, the molecular mechanisms involved in the host plant response to PMWaV is not yet known.
In studies of the set of molecules produced by the plant in response to the pathogen, at the transcriptional level it is possible to evaluate the set of mRNAs (mRNA) and to determine the activity of the genes (Adams, 2008; Sinha and Smith, 2014; Hao et al., 2016; Kamitani et al., 2016). With the advent of a new generation of sequencing technologies (NGS), traditional methodologies such as microarray, serial gene expression analysis (SAGE), and Sanger sequencing were complemented by deep RNA sequencing (RNAseq) (Jain, 2012). In this context, RNAseq allows the identification of all RNAs expressed in cells or tissue at any given time. In addition, the comparison of the gene expression profile in different environmental conditions or pathological, physiological or developmental states can be performed. Also, with this technique, it is possible to characterize alternative splicing and polymorphism of one nucleotide (SNPs). In this sense, several sequencing platforms and bioinformatics software have been generated to optimize studies of gene expression (Morozova et al., 2009; Martin and Wang, 2011; Jain, 2012).
Many factors influence differential expression studies through RNA-seq. Aspects such as depth of sequencing, coverage, material quality, biological variability, and the statistical model adopted to evaluate the abundance of the transcripts can generate false-positive results and compromise the validation and interpretation of the results. Therefore, making careful choices, not only with the experimental design but also with the bioinformatic tools used, is essential for the estimation of the differentially expressed genes (DEGs). In this context, for comparative analysis of small numbers of samples, DESeq and edgeR are widely used tools with similar methodology but with differences in the normalization of the data and in the estimative of dispersion of the genes in the sample and in the group (Anders et al., 2013).
Based on the Ananas comosus genome (Ming et al., 2015), the transcriptome of asymptomatic and symptomatic ‘Smooth Cayenne’ pineapple plants was sequenced and evaluated to locate differentially expressed genes with the objective of identifying the differences in the gene expression involved in the pineapple-PMWaV-2 interaction.
MATERIALS AND METHODS
Plant materials and symptom conditions
Pineapple plants (A. comosus var. comosus ‘Smooth Cayenne’) were cultivated in an experimental field at the farm of the Capixaba Institute for Research, Technical Assistance and Rural Extension (INCAPER, Sooretama, ES, Brazil). Source material consisted of three vegetative plants with severe symptoms of MWP designated as symptomatic (Figure 1B). Likewise, three asymptomatic plants formed a second group (Figure 1A). For viral indexing, and transcriptome analysis, D leaves were removed, quickly washed with distilled water and ethanol (70%), and immediately frozen in an ethanol bath with dry ice, then transported from the field in dry ice.
Total RNA extraction, cDNA, and qPCR
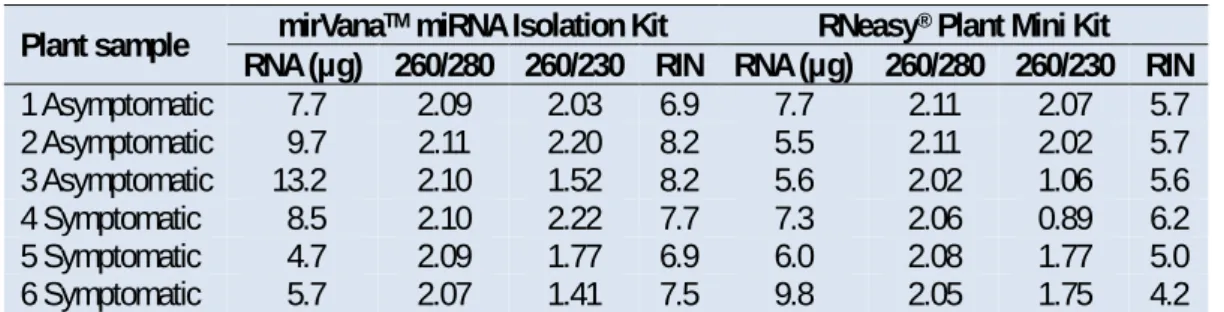
Total RNA was extracted from the basal portion of the leaves (~100 mg) using the mirVana™ miRNA Isolation Kit (Life Technologies, Carlsbad, CA) and the RNeasy® Plant Mini Kit (QIAGEN, Hilden, Germany) according to manufacturer’s protocol. The quality of total RNA was measured by the A260/280 and A260/230 ratios in a Nanodrop 2000 spectrophotometer apparatus (Thermo Scientific, Wilmington, USA). Total RNA aliquots of ratio 2.0 and with a high yield of total RNA were sent to sequencing (Table 1). From 10 ng of the total RNA extract, reverse-transcribed cDNA was obtained using the High-Capacity cDNA Reverse Transcription Kit (Applied Biosystems, Cheshire, UK).
Table 1. The degree of purity analysis and total RNA integrity (RIN).
Plant sample RNA (µg) 260/280 260/230 RIN RNA (µg) 260/280 260/230 RIN mirVanaTM miRNA Isolation Kit RNeasy® Plant Mini Kit
1 Asymptomatic 7.7 2.09 2.03 6.9 7.7 2.11 2.07 5.7 2 Asymptomatic 9.7 2.11 2.20 8.2 5.5 2.11 2.02 5.7 3 Asymptomatic 13.2 2.10 1.52 8.2 5.6 2.02 1.06 5.6 4 Symptomatic 8.5 2.10 2.22 7.7 7.3 2.06 0.89 6.2 5 Symptomatic 4.7 2.09 1.77 6.9 6.0 2.08 1.77 5.0 6 Symptomatic 5.7 2.07 1.41 7.5 9.8 2.05 1.75 4.2
Diagnosis of the relative expression of PMWaV-1, PMWaV-2, and PMWaV-3 was conducted using qPCR 7500 version 2.0.1 (Applied Biosystems) according to the protocol of the Biotechnology Laboratory (UFES/BioTec). The cDNA was used as a template for real-time PCR with 10 µL of PCR Master Mix (Applied Biosystems) and virus-specific primers in a reaction of 20 µL. This mixture was also used for detection of actin as an endogenous control. Specific sense and antisense primers PMWaV-1-F (5’-GCAGGCGGTAGTAAACGAA-3’) and PMWaV-1-R AAGTGCCTCCTCCGAAATC-3’) for detection of PMWaV-1, PMWaV-2-F (5’-ACGGTACCAGCCGACTACA-3’) and PMWaV-2-R (5’-CAGCGGTCGGTTCATTTAC-3’) for detection of PMWaV-2, and PMWaV-3-F TGACGTTGTCGGTGTGTTC-3’) and PMWaV-3-R (5’-ACCACCGCCTGTACGTTTA-3’) for detection of PMWaV-3 were used, and for detection of actin actin-F (5’-CGTTTGCGACAATGGAACTG-3’) and actin-R (5’-CGCTCTCGGTGCATCATCT-3’) primers were used. The reaction mixture was heated at 95°C for 10 min; amplification occurred for 40 cycles of 15 s at 95°C followed by 1 min at 60°C. A reaction mixture without addition of cDNA was used as a negative control. Relative expression was estimated by the 2-ΔΔCt method, and the difference was evaluated by the t-test with standard error calculations between the groups of pineapple plants.
Sequencing, quality control, and filtering
Biological triplicates were selected for deep sequencing. Aliquots of more than 4 µg of total RNA from each sample were sent to Macrogen Korea, Seoul, Republic of Korea, where RNA integrity was confirmed using an Agilent 2100 Bioanalyzer (Agilent Technologies, Santa Clara, CA). The integrity of the RNA was determined by the ratio of 28S:18S rRNA. This measure is estimated by automated microcapillary electrophoresis associated with the algorithm that determines RNA integrity (RIN). This number, ranging from 1 to 10, determines the level of RNA degradation from the most degraded to the intact (Schroeder et al., 2006). Aliquots of total RNA with RIN between 6.9 and 8.2 were used (Table 1). Paired-end libraries with fragments above 278 bp were prepared using Illumina’s TruSeq technology, and sequencing was conducted on a flow cell of the HiSeq 2000 platform (Illumina, San Diego, CA) generating paired-end reads of 101 bp. The quality of the obtained reads was verified by FastQC v.0.11.4 (Andrews, 2010) and treated using Trimmomatic (0.32) (Bolger et al., 2014) to remove low-quality reads.
Mapping of reads to the pineapple genome and differential expression profile
2015) obtained from the JGI Phytozome v.11.0.9 database (http://phytozome.jgi.doe.gov/). The alignment of the reads was performed using STAR_2.4.2a (Dobin et al., 2013), distributed under the GPLv3 license, using the default parameters suggested by the developers. The counts of the reads mapped to each gene per sample was performed using HTSeq-0.6.1p1 (Anders et al., 2015). DEGs were estimated in duplicates using the packages DESeq2_1.14.1 (Love et al., 2014) and edgeR_3.18.1 (Robinson et al., 2010). A gene was considered differentially expressed if it presented an adjusted p-value <0.05 for DESeq2 and FDR <0.05 for edgeR.
RESULTS AND DISCUSSION
PMWaV indexation in symptomatic and asymptomatic pineapple plants
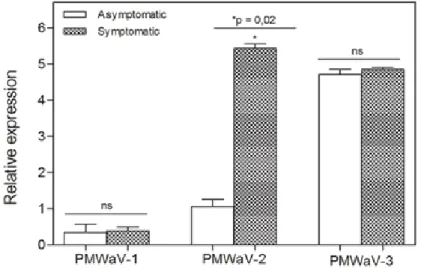
Estimates of expression of the PMWaV-1 and PMWaV-3 were similar in symptomatic and asymptomatic plants whereas that of PMWaV-2 was estimated in symptomatic pineapple plants with a significant difference (p=0.02) (Figure 2).
Figure 2. Relative expression profile of PMWaV-1, PMWaV-2, and PMWaV-3 in asymptomatic and symptomatic pineapple plants.
The absence of MWP symptoms in PMWaV-3-infected pineapple plants has been reported in Hawaii (Sether and Hu, 2001), Taiwan (Shen et al., 2009) and Brazil (Peron et al., 2009). Similarly, PMWaV-1 was characterized as a virus that has only one pathogenicity factor with systemic suppression activity of the RNA-silencing mechanism and not directly involved in the severity of the MWP disease and, frequently detected in symptomatic pineapple plants only in the presence of PMWaV-2 (Dey et al., 2015). In contrast, the PMWaV-2 was detected in symptomatic plants worldwide as the aetiological agent of MWP except in Australia (Sether and Hu, 2002b; Sether et al., 2005; Shen et al., 2009; Peron et al., 2009). Suppression factors of local and systemic RNA silencing in host plants were suggested to be potential determinants in the infection of PMWaV-2 (Dey et al., 2015).
Sample screening
The RNA samples extracted with the two RNA extraction kits showed a good yield in micrograms (μg) and purity quality (260/280 and 260/230). However, although the amount of RNA produced in both kits exceeded the amount required by the sequencing platform, only the mirVana™ miRNA Isolation Kit resulted in samples with an acceptable minimum RIN value (~7) for analysis (Table 1).
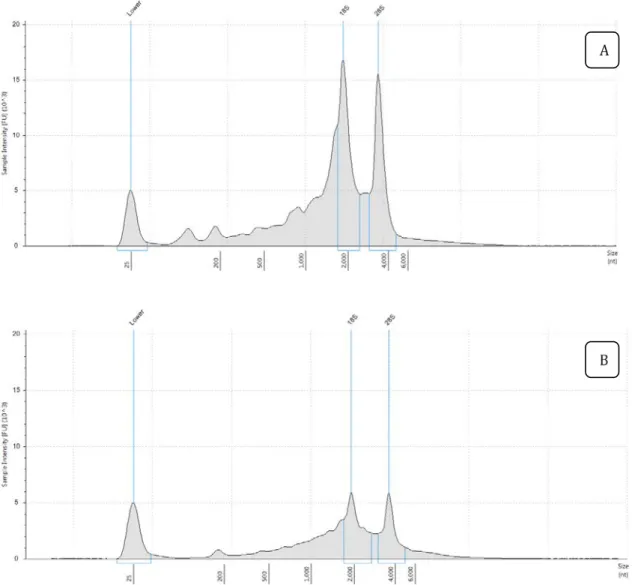
The integrity of the RNA is fundamental so that the reads obtained will be effective in reconstructing the transcriptome, allowing the identification of the expressed genes. Thus,
Figure 3 presents the result of RNA integrity analysis of sample 1 extracted with the two methods to illustrate the difference in the quality of the extracts obtained. Although the concentration of the total RNA in the two samples is the same, the definition and height of the rRNAs peaks reports the distribution of the total RNA degraded in B that occurs in a smaller amount in A. In general, the two kits can be used to recover total RNA with good quality and yield, but the mirVana™ miRNA Isolation Kit enabled the best set of aliquots for the RNAseq.
Figure 3. Measurement of the integrity of total RNA extracted with mirVana™ miRNA Isolation Kit (A) and RNeasy® Plant Mini Kit (B). (A) There are two well-defined peaks corresponding to the 18S and 28S ribosomal subunits and the ratio between the 28S and 18S peaks is approximately 2:1 whereas (B) is an example of partially degraded RNA.
Bioinformatics analysis
Sequencing of approximately 8.6 Gb per RNA sample generated an average of 85.2 Mb of reads with GC percentage higher than 47% and QC above 90% post trimming the low-quality bases (Table 2).
Approximately 80% of all trimmed reads were aligned to the reference genome, which allowed the detection of 16,097 genes. A total of 390 DEGs were detected by DESeq2 while only 223 were detected by edgeR (Figure 4).
Table 2. Quality control (QC) of sequencing data after trimming.
Plant sample Total bases Read count GC (%) Q20 (%) Q30 (%)
1 Asymptomatic 7,763,048,084 81,522,142 47.12 98.25 90.81 2 Asymptomatic 8,482,766,697 89,312,412 47.63 98.17 90.48 3 Asymptomatic 6,745,197,116 71,111,876 48.19 98.15 90.39 4 Symptomatic 8,338,317,871 87,667,964 48.07 98.13 90.29 5 Symptomatic 6,857,534,339 71,862,930 47.64 98.18 90.5 6 Symptomatic 7,443,485,003 78,076,522 47.84 98.18 90.51
Figure 4. Graphical representation of the relationship between the lists of DEGs obtained by DESeq2 and edgeR packages.
DESeq2 and edgeR are packages recommended for robustness in determining the set of DEGs (Love et al., 2014; Zhou et al., 2014). However, DESeq2 computes the mean-variance relation in the data set while edgeR assumes a common dispersion to all genes. The count of reads per gene is determined by the total depth of genes per individual (Love et al., 2014). Moreover, DESeq2 allows the detection of genes with low expression but with a significant change between control and treatment groups. In addition, besides the characteristics of the software, the set DEGs_DESeq2 groups 93% of the genes detected by edgeR (Figure 4).
The intersection of the DEGs detected by DESeq2 and edgeR groups 146 downregulated and 61 upregulated in symptomatic plants. To direct the biological interpretation of the data obtained here, we believe that these 207 carefully selected genes can contribute to downstream research.
CONCLUSIONS
Symptomatic plants showed PMWaV-2 as being an important source for the study of the mechanisms of interaction of the pineapple with the main virus that causes MWP. The mirVana™ miRNA Isolation Kit appeared to be the best option to obtain candidate samples for RNAseq. In addition to the yield, the RNA quality was high, which confirms the efficiency of the method.
The STAR was effective in mapping 16,097 genes and 80% of all reads were successfully aligned to the pineapple genome.
Using DESeq2 and edgeR, 207 differentially expressed genes were detected in symptomatic plants, considering asymptomatic plants as control.
This is the first study of the PMWaV-infected pineapple transcriptome and the data obtained will contribute to better understand the mealybug wilt of pineapple disease.
ACKNOWLEDGEMENTS
Superior, CAPES and the Fundação de Amparo à Pesquisa do Estado do Espı́rito Santo, FAPES, Grant #70643075/15, #48497231 and #59899549/12. P.M.B. Fernandes and José A. Ventura were granted research productivity awards from the Conselho Nacional de Desenvolvimento Cientı́fico e Tecnológico, CNPq, Grant #304719/2014-5 and #307752/2012-7, respectively.
Literature cited
Adams, J. (2008). Transcriptome: connecting the genome to gene function. Nature Education 1 (1), 195.
Anders, S., McCarthy, D.J., Chen, Y., Okoniewski, M., Smyth, G.K., Huber, W., and Robinson, M.D. (2013). Count-based differential expression analysis of RNA sequencing data using R and Bioconductor. Nat Protoc 8 (9), 1765–1786 https://doi.org/10.1038/nprot.2013.099. PubMed
Anders, S., Pyl, P.T., and Huber, W. (2015). HTSeq–a Python framework to work with high-throughput sequencing data. Bioinformatics 31 (2), 166–169 https://doi.org/10.1093/bioinformatics/btu638. PubMed
Andrews, S. (2010). FastQC: a quality control tool for high throughput sequence data. http://www. bioinformatics.babraham.ac.uk/projects.
Bolger, A.M., Lohse, M., and Usadel, B. (2014). Trimmomatic: a flexible trimmer for Illumina sequence data. Bioinformatics 30 (15), 2114–2120 https://doi.org/10.1093/bioinformatics/btu170. PubMed
Borroto-Fernandez, J.A., Costa, T.A., and Laimer, M. (2007). RT-PCR detection and protein-protein interaction of viral components of Pineapple mealybug wilt-associated virus 2 in Cuba. J. Plant Pathol. 89, 435–439 https://doi.org/10.4454/jpp.v89i3.779.
Dey, K.K., Borth, W.B., Melzer, M.J., Wang, M.L., and Hu, J.S. (2015). Analysis of Pineapple mealybug wilt associated virus -1 and -2 for potential RNA silencing suppressors and pathogenicity factors. Viruses 7 (3), 969–995 https://doi.org/10.3390/v7030969. PubMed
Dobin, A., Davis, C.A., Schlesinger, F., Drenkow, J., Zaleski, C., Jha, S., Batut, P., Chaisson, M., and Gingeras, T.R. (2013). STAR: ultrafast universal RNA-seq aligner. Bioinformatics 29 (1), 15–21 https://doi.org/10.1093/bioinformatics/ bts635. PubMed
Gambley, C.F., Steele, V., Geering, A.D.W., and Thomas, J.E. (2008). The genetic diversity of ampeloviruses in Australian pineapples and their association with mealybug wilt disease. Australas. Plant Pathol. 37 (2), 95–105 https://doi.org/10.1071/AP07096.
Hao, Y., Wang, T., Wang, K., Wang, X., Fu, Y., Huang, L., and Kang, Z. (2016). Transcriptome analysis provides insights into the mechanisms underlying wheat plant resistance to stripe rust at the adult plant stage. PLoS ONE 11 (3), e015071 https://doi.org/10.1371/journal.pone.0150717.
Jain, M. (2012). Next-generation sequencing technologies for gene expression profiling in plants. Brief Funct Genomics 11 (1), 63–70 https://doi.org/10.1093/bfgp/elr038. PubMed
Kamitani, M., Nagano, A.J., Honjo, M.N., and Kudoh, H. (2016). RNA-Seq reveals virus-virus and virus-plant interactions in nature. FEMS Microbiol. Ecol. 92 (11), fiw176 https://doi.org/10.1093/femsec/fiw176. PubMed Love, M.I., Huber, W., and Anders, S. (2014). Moderated estimation of fold change and dispersion for RNA-seq data with DESeq2. Genome Biol. 15 (12), 550 https://doi.org/10.1186/s13059-014-0550-8. PubMed
Martin, J.A., and Wang, Z. (2011). Next-generation transcriptome assembly. Nat. Rev. Genet. 12 (10), 671–682 https://doi.org/10.1038/nrg3068. PubMed
Melzer, M.J., Sether, D.M., Hu, J.S., and Karasev, A.V. (2001). Nucleotide sequence, genome organization and phylogenetic analysis of Pineapple mealybug wilt-associated virus-2. J. Gen. Virol. 82 (1), 1–7 https://doi.org/10. 1099/0022-1317-82-1-1. PubMed
Ming, R., VanBuren, R., Wai, C.M., Tang, H., Schatz, M.C., Bowers, J.E., Lyons, E., Wang, M.L., Chen, J., Biggers, E., et al. (2015). The pineapple genome and the evolution of CAM photosynthesis. Nat. Genet. 47 (12), 1435–1442 https://doi.org/10.1038/ng.3435. PubMed
Morozova, O., Hirst, M., and Marra, M.A. (2009). Applications of new sequencing technologies for transcriptome analysis. Annu Rev Genomics Hum Genet 10 (1), 135–151 https://doi.org/10.1146/annurev-genom-082908-145957. PubMed
Perez, P.E., Sether, D.M., Melzer, M.J., Busto, J.L., Nagai, C., and Hu, J.S. (2006). Characterization and control of pineapple mealybug wilt associated ampeloviruses. Acta Hortic. 702, 23–27 https://doi.org/10.17660/ActaHortic. 2006.702.1.
Peron, F.N., Fernandes, P.M.B., and Ventura, J.A. (2009). Detecção de PMWaV-1 e PMWaV-2 em abacaxizeiros no Estado do Espı́rito Santo. Trop. Plant Pathol. 34, S268–S268.
Robinson, M.D., McCarthy, D.J., and Smyth, G.K. (2010). edgeR: a Bioconductor package for differential expression analysis of digital gene expression data. Bioinformatics 26 (1), 139–140 https://doi.org/10.1093/bioinformatics/ btp616. PubMed
Schroeder, A., Mueller, O., Stocker, S., Salowsky, R., Leiber, M., Gassmann, M., Lightfoot, S., Menzel, W., Granzow, M., and Ragg, T. (2006). The RIN: an RNA integrity number for assigning integrity values to RNA measurements. BMC Mol. Biol. 7 (1), 3 https://doi.org/10.1186/1471-2199-7-3. PubMed
Sether, D.M., and Hu, J.S. (2001). The impact of Pineapple mealybug wilt-associated virus-1 and reduced irrigation on pineapple yield. Australas. Plant Pathol. 30 (1), 31–36 https://doi.org/10.1071/AP00060.
Sether, D.M., and Hu, J.S. (2002a). Yield impact and spread of Pineapple mealybug wilt associated virus-2 and mealybug wilt of pineapple in Hawaii. Plant Dis. 86 (8), 867–874 https://doi.org/10.1094/PDIS.2002.86.8.867. Sether, D.M., and Hu, J.S. (2002b). Closterovirus infection and mealybug exposure are necessary for the development of mealybug wilt of pineapple disease. Phytopathology 92 (9), 928–935 https://doi.org/10.1094/PHYTO.2002.92. 9.928. PubMed
Sether, D.M., Ullman, D.E., and Hu, J.S. (1998). Transmission of Pineapple mealybug wilt-associated virus by two species of mealybug (Dysmicoccus spp.). Phytopathology 88 (11), 1224–1230 https://doi.org/10.1094/PHYTO. 1998.88.11.1224. PubMed
Sether, D.M., Karasev, A.V., Okumura, C., Arakawa, C., Zee, F., Kislan, M.M., Busto, J.L., and Hu, J.S. (2001). Differentiation, distribution, and elimination of two different pineapple mealybug wilt-associated viruses found in pineapple. Plant Dis. 85 (8), 856–864 https://doi.org/10.1094/PDIS.2001.85.8.856.
Sether, D.M., Melzer, M.J., Busto, J., Zee, F., and Hu, J.S. (2005). Diversity and mealybug transmissibility of ampeloviruses in pineapple. Plant Dis. 89 (5), 450–456 https://doi.org/10.1094/PD-89-0450. PubMed
Shen, B.N., Zheng, Y.X., Chen, W.H., Chang, T.Y., Ku, H.M., and Jan, F.J. (2009). Occurrence and molecular characterization of three pineapple mealybug wilt-associated viruses in pineapple in Taiwan. Plant Dis. 93 (2), 196 https://doi.org/10.1094/PDIS-93-2-0196C. PubMed
Sinha, D.K., and Smith, C.M. (2014). Selection of reference genes for expression analysis in Diuraphis noxia (Hemiptera: Aphididae) fed on resistant and susceptible wheat plants. Sci Rep 4 (1), 5059 https://doi.org/10. 1038/srep05059. PubMed
Ventura, J.A., and Zambolim, L. (2002). Controle das doenças do abacaxizeiro. In Controle de Doenças de Plantas Frutı́feras 1, L. Zambolim, F.X. Ribeiro do Vale, A.J. Abranches Monteiro, and H. Costa (org.), p.445–509.
Zhou, X., Lindsay, H., and Robinson, M.D. (2014). Robustly detecting differential expression in RNA sequencing data using observation weights. Nucleic Acids Res. 42 (11), e91–e10 https://doi.org/10.1093/nar/gku310. PubMed