HAL Id: hal-01724652
https://hal.insa-toulouse.fr/hal-01724652
Submitted on 23 Mar 2018HAL is a multi-disciplinary open access archive for the deposit and dissemination of sci-entific research documents, whether they are pub-lished or not. The documents may come from teaching and research institutions in France or abroad, or from public or private research centers.
L’archive ouverte pluridisciplinaire HAL, est destinée au dépôt et à la diffusion de documents scientifiques de niveau recherche, publiés ou non, émanant des établissements d’enseignement et de recherche français ou étrangers, des laboratoires publics ou privés.
Alkali-silica reaction (ASR) expansion: Pessimum effect
versus scale effect
Xiao Xiao Gao, Stéphane Multon, Martin Cyr, Alain Sellier
To cite this version:
Xiao Xiao Gao, Stéphane Multon, Martin Cyr, Alain Sellier. Alkali-silica reaction (ASR) expansion: Pessimum effect versus scale effect. Cement and Concrete Research, Elsevier, 2013, 44, pp.25–33. �10.1016/j.cemconres.2012.10.015�. �hal-01724652�
Alkali-silica reaction (ASR) expansion: pessimum effect
1
versus scale effect
2 3 4
Xiao Xiao Gao
a, Stéphane Multon
a*, Martin Cyr
a, Alain Sellier
a 56
(a)Université de Toulouse; UPS, INSA; LMDC (Laboratoire Matériaux et Durabilité des Constructions); 135, 7
avenue de Rangueil; F-31 077 Toulouse Cedex 04, France
8 9 10
Abstract 11
The effect of aggregate size on ASR expansions has been largely studied and conflicting 12
results exist concerning the aggregate size that leads to the highest ASR expansion. Most of 13
the research works clearly show a pessimum effect of aggregate size on ASR expansion. 14
However, all the results available in the literature were obtained using different experimental 15
conditions and the combined effects of other important parameters, such as specimen size 16
used in the expansion tests, have often been neglected. This paper aims to investigate the 17
combined effect of specimen size and aggregate size on ASR expansion. Experimental results 18
highlight a scale effect, a combination of the effects of aggregate size and specimen size on 19
ASR expansion. This scale effect appears to be influenced by the reactive silica content of the 20
aggregate. Modelling at microscopic level is used to propose a quantification of this effect. 21
22
Keywords: alkali-silica reaction (ASR), particle size, specimen size, expansion, scale effect
23 24 25 26
1. Introduction
27
Alkali-Silica Reaction (ASR) is a deleterious chemical reaction occurring in all types of 28
structures that contain alkali-reactive aggregates: dams, bridges, roads, breakwaters, etc. The 29
mechanism of expansion can be described in three main steps [1-4]: the diffusion of ionic 30
species (Na+, K+, OH-, Ca2+) into the aggregates, the disruption of the silanol and siloxane 31
bonds contained in the reactive silicate, and the reaction of alkali silicate with ionic species 32
(Na+, K+, Ca2+) to form ASR gels. ASR gel induces pressure in the aggregate and in the 33
cement paste, leading to stresses and thus cracking. ASR expansion depends on numerous 34
parameters (amounts of alkali, reactive silica and water present, aggregate and specimen sizes, 35
etc.). 36
It seems that the range of aggregate size causing the highest ASR expansion varies with the 37
nature and composition of the aggregate. Numerous papers [5-23] discuss the effect on ASR 38
expansion of particle sizes of reactive aggregates like opal [5-12], various kinds of silica 39
glass, fused silica and waste silica glass, and so on [13-24]. Some research has shown that the 40
expansion induced by ASR increases as the reactive particle size is reduced [9,14,17,19]. 41
Some authors obtained insignificant expansion when the sizes of the reactive particles were 42
under 50 to 150 µm [11,13,15,22]. Furthermore, the use of powder from reactive aggregates 43
like pozzolans, with particle sizes up to about 100 µm, has been developed to counteract the 44
effect of ASR [15,18,21]. Only a few exceptions with very small particles led to significant 45
ASR expansions, all involving opal aggregates [5-7, 12]. Other research works have shown a 46
pessimum effect for various types of aggregates, with pessimum values occurring in a wide 47
interval of particle sizes [4,7,8,10-13,16,20,23,24]. It is observed that, in some cases, the most 48
damaging size, leading to the highest ASR expansion, reaches more than 1 mm. The effect of 49
“specimen size” has been much less studied [25-28]. Experiments performed with different 50
‘aggregate size to specimen size’ ratios show the effect of the size of the specimens on the 51
ASR expansions measured. Lower expansions were measured on the smaller specimens 52
[25,26]. 53
First, a literature review showed that conflicting results exist concerning the most damaging 54
reactive aggregate size, which leads to the highest ASR expansion. Secondly, experimentation 55
performed by Zhang et al. [26] suggested that the two effects of aggregate and specimen sizes 56
are combined. Therefore, the difficulty in generalizing results on the effect of the particle size 57
of reactive aggregates could be explained by the differences in experimental conditions, and 58
particularly the combined effects of aggregate size and specimen size on ASR expansion. This 59
paper aims to investigate and quantify this scale effect and the influence the reactive silica 60
content of aggregate has on the effect, in order to gain a better understanding of expansion 61
tests. 62
The development of an ASR model at the microscopic level is a major concern of researchers 63
trying to understand the mechanisms involved in the ASR and to predict future expansion. 64
Previous modelling investigated the different aspects of the reaction: the mechanical 65
consequences of ASR [29-32], the chemical mechanisms driving the attack of the aggregate 66
by hydroxyl ions [33] and their coupling [34-38]. These works do not take into account the 67
permeation of ASR gels in cracks which could be the main cause of the decrease of expansion 68
by pessimum or scale effects. The concepts of fracture mechanics can explain the cracking 69
phenomenon in the cases of aggregate in infinite matrix [39, 40] or of central penny-shaped 70
crack in sphere [41]. However, it is difficult to apply such models in the cases of specimens 71
containing aggregates with numerous interactions (interactions with other neighbour 72
aggregates and with specimen boundaries). The experiments presented in this paper were used 73
to point out the dependence of expansion with aggregate and specimen sizes. These results are 74
explained by fracture mechanics concepts. The teachings pointed out by fracture mechanics 75
are then used to propose a simplified relationship to take into account the scale effect in an 76
analytical modelling. Finally, the experimental results are used here to calibrate and discuss 77
the validity and the capability of the model. 78
2. Experimental conditions and results
79
2.1 Experimental conditions
80
Expansion was measured on mortar prisms with a water/cement ratio of 0.5 and a sand (1512 81
kg/m3) / cement (504 kg/m3) ratio of 3. Mixtures were adjusted by adding NaOH to the 82
mixing water in order to have the same alkali concentration in the pore solution and in the 83
storage solution. For the reference specimens, the sand was composed of the non-reactive 84
marble only. For all the other specimens, the sand contained 30% of reactive aggregate and 70% 85
of non-reactive marble. The prisms were stored in NaOH solution at 60°C. The expansion 86
measurements were performed after the prisms had cooled to 20ºC (~12 h) in the NaOH 87
solution. Each variation of length value was calculated as the mean of three values from three 88
replicate specimens measured using the scale micrometer method (specimens had shrinkage 89
bolts in the two extremities) [42,43]. The experimentation presented in this paper aimed to 90
study three particular points: 91
Effect of alkali concentration
92
As explained above, the specimens were kept immersed in NaOH solution. The aim of this 93
part was to study three NaOH concentrations for immersion close to the standard conditions 94
of 1 mol/l (0.77, 1 and 1.25 mol/l). Reactive siliceous limestone was used to study the effect 95
of alkali concentration on ASR expansion. The specimen and aggregate sizes were 96
respectively 20 x 20 x 160 mm and 315-1250 µm (15% of 315-630 and 15% of 630-97
1250 µm). Eighteen specimens (nine reactive and nine reference specimens) were used for 98
this part of the experimentation. 99
Effect of reactive silica content
100
The second point concerned the effect of the reactive aggregate nature on ASR expansion. 101
Four reactive aggregates with different reactive silica contents were chosen and tested. Opal 102
(O) is known to be very reactive and to give large expansion if the amount of available alkali 103
is sufficient. Quartzite (Q) and siliceous limestone (SL) are usually less reactive but can 104
exhibit significant expansion in concrete. Quartz aggregate (QA), which contains mostly 105
quartz, is considered as non-reactive. The silica contents of the aggregate [43] are given in 106
Table 1. The aggregates were used to cast 20x20x160 mm specimens with 315-1250 µm 107
reactive aggregate (15% of 315-630 and 15% of 630-1250 µm). The fifteen specimens were 108
kept in 1 mol/l NaOH solution. 109
Combined effect of aggregate and specimen sizes
110
Four reactive aggregate size classes: C1 (0-315 µm), C2 (315-630 µm), C3 (630-1250 µm) 111
and C4 (1250-2500 µm) and three specimen sizes: 20x20x160 mm, 40x40x160 mm and 112
70x70x280 mm were used to research the combined effect of aggregate and specimen sizes on 113
ASR expansion. The forty-five specimens (thirsty-six reactive and nine non-reactive 114
specimens) were stored in 1 mol/l NaOH solution. Siliceous limestone was used as the 115
reactive aggregate. 116
2.2 Experimental results
117
2.2.1 Effect of the alkali concentration
118
The final expansions for the three NaOH concentrations of 0.77, 1.0 and 1.25 mol/l were 119
0.67%, 0.64% and 0.60% respectively (Figure 1). The difference between two consecutive 120
concentrations appeared to be small considering that the standard deviation for the specimens 121
was in the range of 0~0.02%. Between 0.77 and 1.25 mol/l, the alkali concentrations could be 122
considered to have little influence on ASR expansions in conditions of abundant alkali. 123
2.2.2 Effect of the reactive silica content
125
The ASR expansions obtained for the four aggregates are plotted in Figure 1. The specimens 126
containing opal were the most reactive, with fast expansion and an asymptotic value of about 127
1.35%. The specimens with siliceous limestone exhibited rapid expansion, but the final 128
expansions were lower (about 0.6%). The specimens with quartzite aggregate presented a 129
slow expansion rate but reached a final expansion of about 0.55%. ASR expansion of the 130
specimens containing quartz aggregate was about 0.14%. By the end of the experiment, the 131
specimens containing opal were seriously damaged and cracked (crack width of about 425 µm) 132
while the other specimens showed cracks with widths smaller than 10 µm (Figure 2). The 133
reliability of measured expansions could have been affected by such cracking. However, the 134
coefficient of variations obtained for three specimens was lower than 5%. It shows that the 135
expansion scattering stayed quite small in spite of the large cracks. 136
2.2.3 Combined effects of aggregate and specimen sizes
137
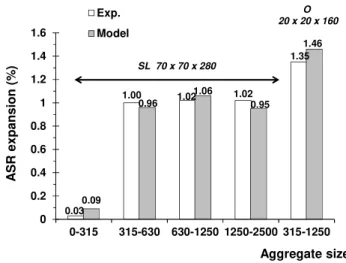
The ASR expansions obtained for mortars containing the reactive siliceous limestone with 138
various aggregate sizes and cast in specimens of different sizes are given in Figure 3. First, 139
the specimens containing small reactive particles (0-315 µm) had the smallest expansion 140
(lower than 0.15%), confirming results found in the literature. The ASR expansions were 141
significant and higher than 0.5% for the other three aggregate sizes. Concerning final ASR 142
expansion, the largest specimens showed the highest ASR expansion (Figure 4). This was 143
particularly significant on the large aggregate class 1250-2500 µm (ASR expansions were 144
twice as large for the 70x70x280-mm specimens as for the others). Moreover, ASR 145
expansions presented a pessimum effect with the reactive aggregate size (with a final 146
expansion larger for the aggregate size 315-630 µm than for 1200-2500 µm) for 147
measurements performed on the smallest specimens (20x20x160 mm, 40x40x160 mm) but 148
not for the largest ones (Figure 4). These observations show the significant combined effect of 149
specimen size and aggregate size. 150
2.2.4 Scale effect
151
Mechanisms
152
In order to understand the scale effect (combination of the aggregate- and specimen-size 153
effects on expansion), the ASR development can be described in four phases: 154
1. Ions (hydroxyls and alkalis) from the pore solution diffuse into the aggregates whatever the 155
reactive silica distribution in the aggregate (uniform or in veins – Figure 5-a). 156
2. Ions react with reactive silica and ASR gel is created in and/or around the aggregate 157
(according to the distribution of the reactive silica in the aggregate, a part of the reactive silica 158
can even be in direct contact with cement paste – Figure 5-b). A part of the gel can fill the 159
connected porous volume surrounding the aggregate without leading to damage [33-35,39] 160
(Figure 5-b) and also a part of the porosity of the aggregate close to the reactive site which 161
can lead to the cracking of veined aggregates [41]. This can explain why the smallest 162
aggregates lead to small expansion. For the same reactive silica content, more of the gel can 163
migrate in the connected porosity for the smallest aggregates than for larger aggregates. Thus, 164
a small amount of ASR gel is able to cause expansion [23,34,39]. It is easier for the cement 165
paste to accommodate ASR gel when the gel is created by a large number of small sites rather 166
than by a small number of scattered, larger sites. 167
3. ASR gel exerts pressures on the surrounding aggregate and cement paste when a part of the 168
connected porosity is filled (Figure 5-c) and the gel can no longer move in the porosity. In 169
order to assess the gel pressure pga for the aggregate of size a, an analogy with previous
170
modelling [23, 34] can be made. In these works, the ASR mechanical effect was assumed to 171
be an imposed strain of the aggregate on the surrounding cement paste equal to: 172
a poro a gel a a imp V V V − + =
ε
(1) +X is the positive part of X: if X<0, X + =0 otherwise X + = X
173 gel a
V is the volume of ASR gel formed in reactive aggregates and Va, the volume of the
174 reactive aggregate, 3 a a π R 3 4
V = ⋅ (if spherical shape is assumed for aggregate). 175
poro a
V is the volume of the porosity in which the ASR gel can migrate without causing 176
expansion. It was assumed that the proportion of gels filling the porosity connected to the 177
reactive sites (cement paste and aggregate) without creating pressure was the total volume of 178
porosity filled by the gel with an equivalent thickness tc, which was assumed to be
179
independent of the aggregate size: 180
(
)
(
3 3)
3 4 a c a poro a R t R V =ϕ π⋅ + − (2)where ϕ is the porosity of the mortar. In reality, it includes a part of aggregate porosity but, by 181
sake of simplicity, the model considers the thickness tc as the average distance of gel
182
penetration which should depend on the gel pressure: penetration is more or less difficult due 183
to the ASR gel viscosity, its surface tension and the size of the pores of the aggregate and of 184
the cement paste surrounding the reactive sites [39]. Once the gel reaches tc, it cannot
185
penetrate in the paste anymore due to the combination of these three main parameters. They 186
were assumed to be the same for all the aggregates and that’s why the equivalent thickness tc
187
was assumed to be independent with the aggregate size. 188
In order to assess the effect of ASR-gel on the cement paste in term of pressure, similar 189
relationship can be used. pga, the gel pressure can be assumed to be proportional to Mg the gel
190
bulk modulus and to the increase of volume due to ASR-gel production: 191
( )
[
(
)
3 3]
3 4 a c a gel a g a g t M V R t R p = −ϕ π + − (3)gel a
V , the volume of ASR gel formed in reactive aggregates, is proportional to the number of 192
moles of ASR gel formed after the attack of the reactive silica: 193 mol gel gel a gel a
n
V
V
=
⋅
(4)with nagel (mol): the number of moles of ASR gel produced by the aggregate a and Vgelmol
194
(m3/mol): the molar volume of the gel.
195
The number of moles of ASR gels produced by the reaction is defined by the number of 196
moles of silica attacked by alkalis and can be taken proportional to s the reactive silica content 197 (in mol/m3): 198
( )
t
s
R
n
agel=
π
a3⋅
⋅
ζ
3
4
(5)ζ(t) is the chemical advancement of the alkali-silica reaction (which depends on temperature,
199
moisture and alkali conditions and is assessed by the diffusion of ionic species in the 200
aggregate and by the time necessary for the attack of the reactive silica by hydroxyl ions and 201
for the formation of ASR-gels [34]). 202
Finally, pg, the gel pressure at the time-step t, can be assessed from:
203
( )
3( )
[
(
)
3 3]
3 4 3 4 a c a mol gel a g a g t M R V s t R t R p = π ⋅ ⋅ ⋅ζ −ϕ π + − (6)4. The pressure causes cracking of the aggregate and cement paste. Whatever the reactive 204
silica distribution in the aggregate, the propagation of cracks in small specimens containing 205
large aggregate can be rapid and can occur for low pressures, while the propagation is more 206
difficult for larger specimens containing smaller aggregates and needs higher pressure (Figure 207
5-d). In the framework of fracture mechanics [44-45], the maximal normal stress in the 208
vicinity of an inclusion (e.g. the aggregate) that induces pressure on a matrix (e.g. the cement 209
paste)is given by: 210
( )
r K r I π σ 2 = (7)With σ, the maximal normal stress at the point M located at distance r from the edge of the 211
inclusion (Figure 5-d) and KI, the stress intensity factor obtained for a specimen in stress-free
212
conditions from the relation: 213 ⋅ = L R f p K a a g I (8)
where f is a function increasing with the ratio Ra/L (which can be obtained in [41]), with Ra
214
the aggregate radius and L the dimension of the specimen (a: superscript relative to the size of 215
the reactive aggregate). 216
Smaller expansion in smaller specimen
217
The larger the aggregate size compared to the specimen size, the larger the normal stress at a 218
given distance from the aggregate (Equations 7 and 8). Thus, the tensile strength at the 219
boundary of the specimen can be reached for a smaller pressure (Figure 5-d) and cracks can 220
be initiated earlier. Once concrete cracks, ASR-gels can be accommodated by cracking 221
without creating supplementary pressure [46,47] and can even leach off through the porosity 222
induced by cracking. Thus, the pressure in the gels falls, which stops the expansion. 223
If the pressure necessary to cause cracks is lower for small specimens containing large-sized 224
aggregate, the pressure of the gel will fall sooner in the case of the 20x20x160-mm specimens 225
containing the 1250-2500-µm aggregate than for the 70x70x280-mm specimens containing 226
the same aggregate, and thus cause smaller expansion. 227
Pessimum effect or scale effect
228
The scale effect can also explain the pessimum effect of ASR expansion with aggregate size. 229
For the largest aggregates, a part of the difference of expansion can be explained by a delay in 230
the attack of the reactive silica by the hydroxyl ions due to the diffusion of the ions into the 231
aggregate [23]. Measurements confirmed that the expansion rate was slower in the largest 232
particles whatever the size of the specimens (Figure 3). However, even when the final value 233
was reached, ASR expansion remained lower for the largest aggregates in the smallest 234
specimens. As explained above, the 20x20x160-mm specimens containing the 1250-2500-µm 235
aggregate were more affected by the scale effect than the specimens containing the 315-630-236
µm aggregate: a larger aggregate induced a greater stress intensity factor (Equation 8). 237
Therefore, the part of reactive silica consumed when cracking appeared is lower when 238
cracking appears in the specimens containing the largest aggregate. Once cracking occurs, the 239
gel is accommodated by the cracks and the gel produced after cracking leads to little 240
supplementary pressure. Expansion ceases before the chemical reaction stops, giving a final 241
expansion lower than that for the largest aggregate. This is consistent with the experimental 242
determination of the degree of reaction performed with chemical attack [47] and SEM image 243
analysis [48]: expansion stopped while the degree of reaction was still increasing. The 244
pessimum effect versus specimen size is not an intrinsic phenomenon; it is due to the scale 245
effect, which depends on the ‘specimen size to aggregate size’ ratio. In this experimentation, 246
only mortars were tested and the pessimum effect disappeared for aggregate of 1.25-2.5 mm 247
when tests were performed in specimens of 70 mm. For concrete, the pessimum still exists for 248
aggregate of 4-8 mm in specimens of 70 mm [24]. If the scale effect (combination of the 249
aggregate size effect and the specimen size effect) is identical for concrete, specimens of more 250
than 250 mm could be necessary to remove the pessimum effect for such aggregates. 251
Supplementary investigations are necessary to analyse this effect on concrete. 252
Effect of the reactive silica content on the scale effect
253
At last, it can also be used to analyse the effect of the reactive silica content on ASR 254
expansion (Figure 1). As shown in Figure 6, the final expansions measured on specimens 255
containing the different aggregates were not proportional to the reactive silica content. 256
Moreover, the specimens containing opal were much more damaged and cracked than those 257
with the other aggregates. This could have been due to the large concentration of reactive 258
silica contained in opal. A larger reactive silica content would induce a higher gel pressure 259
(Equation 6) and thus a greater stress intensity factor (Equation 8) for opal than for the 260
siliceous limestone. Therefore, the ratio between the total reactive silica and the reactive silica 261
consumed when cracking appeared was not the same. The part of reactive silica consumed 262
would be lower when cracking appeared in the specimens containing opal than in the 263
specimens containing the siliceous limestone. Once cracking had occurred, cracks 264
accommodated the gel, and expansion stopped before the chemical reaction finished, without 265
proportionality with the total reactive silica. This effect was probably very important in the 266
case of specimens containing opal in which cracks were very large at the end of the 267
experiment (Figure 2). 268
The concept of stress intensity factor appears to be important for an understanding of the 269
development of ASR expansion in concrete. The larger the stress intensity factor KI is, the
270
faster cracks appear and the cracking could lead to reduction of the expansion through gel 271
accommodation and exudation. The ratios between specimen and aggregate sizes were very 272
high in these experiments. This shows that it could be difficult to use specimens large enough 273
to avoid the scale effect. One possibility would be to try to control the aggregate and the 274
specimen sizes so as to perform the test with similar stress intensity factors and thus to have 275
similar cracking conditions as proposed in [42,43] but this would be difficult to do, 276
particularly as far as controlling the aggregate size is concerned. Another possibility is to 277
understand the scale effect through a model that can be used to analyse expansion tests. This 278
is the aim of the modelling presented in the next part. 279
3. Modelling ASR expansion
280
The model used in this paper is an improvement on the microscopic model [34]. It was based 281
on previous models [33, 35-37,39] and attempted to predict the damage and the expansion of 282
a Representative Elementary Volume (REV) of concrete containing a mix of reactive 283
aggregates of different sizes. The reaction between the reactive silica and the alkali was 284
determined through the mass balance equation, which describes the diffusion mechanism in 285
the aggregate and the fixation of the alkali in the ASR gels. The mechanical part of the model 286
is based on damage theory in order to assess the decrease of stiffness of the mortar due to 287
cracking caused by ASR and to calculate the expansion of the REV [34]. Some modifications 288
were made in this model: the threshold of alkalis was re-evaluated in accordance with the 289
results present above and the combined effects of specimen and aggregate sizes and reactive 290
silica content on expansions were taken into account. 291
3.1 Presentation of the model
292
3.1.1 Diffusion of alkali
293
The diffusion of ions in the aggregate partly controls the kinetics of the chemical attacks and 294
of the expansion. At the beginning of ASR, hydroxyl ions attack the reactive silica of the 295
aggregate. Hydroxyl ions come from the pore solution and thus the external boundary of the 296
reactive aggregates is attacked first. If the reactive silica is uniformly distributed in the 297
aggregate, the reactive silica closest to the pore solution is attacked first (Figure 5-a top). If 298
the reactive silica occurs in veins, the penetration of hydroxyl ions is not uniform but veins in 299
contact with the pore solution are attacked first (Figure 5-a bottom). Therefore, in both cases, 300
the transport of ionic species in the aggregate can be modelled by an equivalent diffusion of 301
ions from the pore solution to the aggregate core. The diffusion is not the only phenomenon 302
which impacts the kinetics of ASR-expansion: the time necessary for the attack of the reactive 303
silica by hydroxyl ions and for the formation of ASR-gels is taken into account through a 304
depletion term in the mass balance equation [34]. This term models the alkali consumed by 305
the ASR-gel formation. This alkali consumption is assumed to be linear with the alkali 306
concentration in the aggregate. The temperature of storage for the experiment was 60°C. It 307
accelerates ASR considerably compared to the environmental conditions of real damaged 308
structures and can affect the nature of the gel. It impacts the values of the kinetic parameters 309
but should not affect the principle of the modelling. 310
As in the previous model [34], only the diffusion of ions in the aggregate was considered 311
since the kinetics of diffusion in aggregates was much slower than in cement paste [35]. 312
Therefore, the alkali concentration at the surface of aggregates was assumed to be equal to the 313
concentration of the NaOH solution. The kinetics of the expansion was thus partly controlled 314
by the diffusion in the aggregate, which is one of the kinetic parameters of the model. This 315
assumption is relevant for small specimens or when there is no chemical exchange with the 316
environment but it can be discussed for larger specimens immersed in NaOH solution. In the 317
experiments presented here, the largest specimens showed the slowest rate of ASR-expansion 318
(Figure 3). This can be explained by the diffusion of the alkali into the specimens. The initial 319
alkali concentration in the pore solution was sufficient to initiate the reaction. Alkalis were 320
quickly consumed by the ASR gel and supplementary alkalis were necessary to maintain gel 321
production. The alkali came from the solution and diffused into the mortar. Thus, more time 322
was necessary for alkali to reach the centres of the largest specimens than the centres of 323
smaller ones. Thus an alkali gradient appeared in the specimens. In consequence, at a given 324
time, a gradient of expansion existed between aggregates located close to the external 325
boundary and aggregates located in the core of the specimen. Only complete discretization of 326
the whole specimen [24,31,32] would allow this difference of expansion to be considered. 327
The aim of the modelling used in this paper was to evaluate the material behaviour that could 328
be represented by measurements performed on small specimens. Therefore, the phenomenon 329
of diffusion in the specimen was not taken into account. This modelling can give a good 330
representation of the expansion kinetics of concrete damaged by ASR measured on small 331
specimens (with width smaller than 40 mm, for which the effect of the alkali gradient is 332
negligible). 333
3.1.2 Threshold of alkali concentration
334
In the previous model, a threshold of alkali concentration of 0.625 mol/l of Na+ was 335
considered, under which ASR did not occur [34]. It was based on experimental data showing 336
that, with an alkali content lower than 3 kg per m3 of concrete, no ASR-expansion was 337
observed [49-52]. In tests performed in non-saturated conditions (in air with RH above 95%), 338
the concentration of alkali played an important role in the attack of the silica. In the present 339
work, all the specimens were kept immersed in alkali solution and, thus, the alkali was 340
supplied in abundant quantities. The experiments performed on specimens immersed in three 341
alkali concentrations (0.77, 1 and 1.25 mol/l) showed negligible differences. Considering a 342
threshold of 0.625 mol/l, the expansion of the mortars kept in 0.77 mol/l solution should be 343
significantly slower than the expansion of the mortars kept in 1.25 mol/l solution. With this 344
threshold, the alkali concentration in the aggregate has to be higher than 0.625 mol/l before 345
the reactive silica is attacked. The gel production kinetics is then proportional to the 346
difference between the alkali concentration in the paste and the threshold. The alkali 347
concentration gradient between the paste and the aggregate remains too small to induce the 348
same reaction speed as for the other concentrations. This is not in accordance with the 349
expansion kinetics measured on specimens (Figure 1). Therefore, the gradient must be close 350
for the three concentrations and consequently the alkali consumption by the silica must begin 351
as soon as alkalis are present in the aggregate, without a threshold. The result of this 352
assumption is shown in Figure 7: if no threshold is taken into account, the expansions 353
determined by the modelling at 50 days are of the same order as the expansions obtained for 354
the measurements. The apparent threshold effect observed in experimentations [49-52] can be 355
explained by the alkali fixation in C-S-H. This fixation consumed a part of alkali which are no 356
more available in the pore solution and reduced the attack kinetics and consequently the ASR-357
expansion kinetics. All these phenomena can be explained without considering a threshold of 358
alkali concentration for the attack of the silica. 359
3.1.3 Effective ASR-gel
360
The ASR expansion calculated by the model is imposed by the effective volume of ASR-gel. 361
The effective volume of gel is deduced from the total volume of gel, which is proportional to 362
the number of moles of ASR gel formed after the attack of the reactive silica (Equation 7). 363
Once cracking appears in the specimens, a part of the rest of the gel <Vgel – Vporo > is
364
assumed to be accommodated by cracks created in the aggregate and in the cement paste by 365
the ASR-gel pressure. This gel accommodation by cracks stops the increase of the ASR-gel 366
pressure. This part depends on the scale effect: the larger the aggregate in comparison to the 367
specimen, the greater the volume of ASR gel accommodated. This phenomenon is also 368
affected by the reactive silica content of the aggregate. As explained in the analysis of the 369
experiments, the greater the reactive silica content is, the stronger is the non-linearity due to 370
cracking. Fracture mechanics concepts show that the aggregates closest to the external 371
boundary are the first to produce cracks. In order to quantify this effect, it can be assumed that 372
these aggregates lead to less pressure than the aggregates located in the core of the specimens. 373
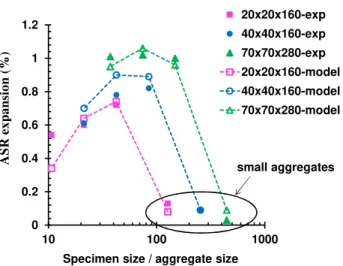
As for the diffusion in cement paste, this will lead to a gradient of deformation between the 374
external boundary and the core and thus to internal stresses. The scale effect appears to be a 375
highly non-linear phenomenon. Therefore, an exponential function is proposed to model the 376
consequences on ASR expansions. An empirical relationship to quantify the reduction of the 377
gel amount effectively used to assess the pressure is thus assumed and applies equally to all 378
the aggregates of a given size i without consideration for their location compared to the 379 specimen boundary: 380 − × − = poro + a x a gel a eff a s L R c V V V max exp 2 (9)
With Vaeff: the effective volume of gel, c: the scale effect fitting coefficient and χ: the silica
381
content exponent. 382
The pressure imposed on the aggregate and thus on the cement paste depends on the effective 383
volume of gel. Moreover, if the distribution of the reactive silica is uniform in the aggregate, 384
the pressure will be isotropic (Figure 5-c). If the reactive silica is contained in veins in the 385
aggregate, the large number of aggregate particles in the specimens means that the orientation 386
of the veins in the specimens is randomly distributed and the mean resulting pressure can be 387
considered as isotropic too (Figure 5-c). The effective volume of gel is then used in the 388
mechanical model presented in [34] to deduce the resulting expansion. 389
3.2 Comparison with experiments
390
3.2.1 Parameters
391
Table 2 sums up the parameters used in the modelling, stating the symbols, the methods used 392
for the identification, the values and the units. Three parameters (unique, independent of the 393
other variables, and usable for all experiments and all aggregate types studied in this work) of 394
the physicochemical modelling (thickness of the connected porous interface zone tc, molar
395
volume of ASR gel Vgelmol, and scale effect fitting coefficient c – equations 4, 6 and 9) were
396
obtained by curve fitting on the final expansions measured on the specimen of size 70 x 70 x 397
280 mm with the four different size classes (0-315, 315-630, 630-1250 and 1250-2500 µm) of 398
siliceous limestone (SL – Figure 8). The parameters were first determined without 399
considering the effect of the silica content exponent (χ = 0) since the specimens involving the 400
curve fitting contained the same aggregate. Once these three parameters had been assessed, 401
the value of χ was determined by fitting the final expansion of mortars containing opal as
402
aggregate (O – Figure 8). As explained above, the coefficient of alkali diffusion in aggregate, 403
Da, was used as a kinetic parameter. This coefficient can depend on the nature of the
404
aggregate. It was obtained by curve fitting the results obtained on specimens of size 20 x 20 x 405
160 mm (Figure 9). The coefficients of diffusion in aggregate (Da) thus obtained by curve
406
fitting were respectively equal to 2.0 x 10⁻¹⁵, 5.0 x 10⁻¹⁴, 4.0 x 10⁻¹⁶ and 2.0 x 10⁻¹⁶ m2/s for 407
the siliceous limestone, opal, quartzite and quartz aggregate. It can be noted that the values 408
were considerably lower than the usual value of diffusion coefficient determined for cement 409
paste (about 10-12 m²/s); the assumption of fast alkali supply at the surface of aggregate is thus 410
verified. However, these values appear to be very small compared to coefficient of diffusion 411
measured for quartzite [53]. It can be explained by the assumption used to determine the 412
kinetics of the formation of ASR-gels. In this modelling, the kinetics was driven by two main 413
phenomena: the diffusion of ions in the aggregates and the kinetics of the attack of reactive 414
silica by alkali and hydroxyl [34]. The attack was assumed to be linear with the alkali 415
concentration in the aggregate and only one parameter was used for all the aggregates. This 416
parameter was fitted for siliceous limestone [34]. In the reality, the mechanisms leading to the 417
gel formation are more complex and this simplified assumption can be responsible of the 418
overestimation of the speed of the silica attack. It can lead to underestimation of the speed of 419
diffusion. Improvements of the assumed kinetics of silica attack could lead to more realistic 420
coefficients of diffusion for aggregates. However, this kinetics of silica attack could depend 421
on the nature of the reactive silica and on the pH of the pore solution and several parameters 422
could be necessary to obtain relevant results which could be very difficult to measure. 423
3.2.2 Calculations
424
Expansions obtained by modelling are compared with the measurements in Figures 9 and 10. 425
Figure 9 shows the expansions obtained with 20 x 20 x 160-mm specimens containing two 426
aggregate sizes (15% of 315-630 and 15% of 630-1250 µm) for the four natures of aggregate. 427
Only the coefficient of diffusion and the silica content exponent were fitted on these results. 428
The fitting concerning the final expansion of the siliceous limestone was only performed on 429
the largest specimens (70x70x280 mm) and for specimens containing only aggregate of the 430
same size. Except for the kinetics of expansion obtained for specimens containing opal, both 431
kinetics and final expansions obtained by the calculations were in accordance with the 432
measurements for the four types of aggregate. The description of the expansion kinetics by 433
the model is globally possible: presence of a latent time before initiation of the expansion, 434
followed by a high rate of expansion and ending by a low rate to reach the final expansion. 435
Concerning the effect of the alkali concentration of the immersion solution, the difference 436
between the final expansion predicted by the model (0.70%) and the mean measured 437
expansion (0.65%) is lower than 10%. The calculation does not show any difference in final 438
expansions between the three alkali concentrations: the model assumes that all the reactive 439
silica is consumed in the three conditions and, thus, the volume of ASR gel created is the 440
same, leading to the same ASR-expansion. The expansion rates obtained by the model at the 441
beginning of expansion are in good agreement with experiments. This confirms that, in the 442
case of specimens immersed in alkali solutions, no alkali threshold has to be considered 443
(unlike for specimens exposed to a saturated environment [34]). 444
The curve obtained by the model for opal did not fit the experimental results well. At the 445
beginning of the experiment, the slopes of the two curves were the same but, after about 50 446
days, the measurements showed a speeding-up of the expansions which was not obtained by 447
the calculation. This can probably be attributed to crack opening for opal specimens as the 448
specimens containing opal aggregate presented much larger cracks than specimens of the 449
same size cast with the other aggregates. First, cracks opening increased the apparent 450
expansion. These cracks could also cause a great increase in diffusion in the specimens, which 451
could accelerate the reaction. 452
The comparison of the calculated final expansions obtained for the three specimen sizes (20 x 453
20 x 160 mm, 40 x 40 x 160 mm, 70 x 70 x 280 mm) and the four aggregate sizes of the 454
siliceous limestone with the measurements is shown in Figures 10 and 11. Concerning these 455
values, only the measurements performed on the largest specimens were used for parameter 456
identification. The calculated results for all the combinations are in good accordance with the 457
measurements (Figure 10). The scale effect of ASR expansion pointed out in 458
experimentations is rather well-predicted (Figure 11). The differences between calculated and 459
measured expansions are lower than 15% except for the expansions obtained on the smallest 460
specimens (20x20x160 mm) containing the largest aggregate (1250-2500 µm), where the 461
difference is about 30% (Figure 10). 462
3.2.3 Discussion
463
The molar volume of ASR gel obtained by curve fitting in this work was about 170 cm3/mol. 464
It was higher than the molar volume obtained in the previous modelling performed for 465
specimens kept in air at 95% relative humidity [34] and higher than the molar volume of C-S-466
H (about 100 cm3/mol [54]). The differences can be explained by the conditions of 467
conservation (in saturated air in [34] and immersed in NaOH solution in this work) which 468
could have had a marked effect on the gel morphology and thus on the gels’ capability to 469
absorb water. The ASR gels were produced in pore solution with different water contents and 470
alkali concentrations. The compositions of the gel were therefore different and thus the molar 471
volume was different. Concerning the water, ASR gels formed in specimens kept in solution 472
can absorb much more water than those in humid air (R.H. >95%). 473
The thickness of the connected porous interface zone (tc equal to 14.0 µm) was also higher
474
than that found in [34], which was about 1 µm. This value was determined to obtain the final 475
expansions of four aggregate sizes while only two aggregate sizes were studied in the 476
previous work. The molar volume of the gel was higher and therefore more connected porous 477
volume was necessary to accommodate the gel. The ASR gels could permeate over a long 478
distance because the molar volume was high and because the viscosity was small due to high 479
water and alkali contents. This value is in accordance with the results found in the literature 480
[55-56] showing that the interfacial transition zone between aggregate and cement paste can 481 reach 20 µm. 482
4. Conclusion
483This paper has aimed to investigate and quantify the combined effects of aggregate and 484
specimen sizes on ASR expansion and the influence of the reactive silica content of aggregate 485
on this effect. In order to quantify these effects on ASR expansion, a microscopic model was 486
improved. The main conclusions can be summarized as follows: 487
1. A scale effect, combining the effects of aggregate size, reactive silica content and 488
specimen size on ASR expansion, has been highlighted by experimentation. A 489
temporary pessimum size effect had previously been shown to exist due to the speed 490
of the attack of the reactive silica on the aggregate: the larger the aggregate, the slower 491
the penetration of ions into the aggregate and thus the slower the expansion [23]. In 492
this paper, only stabilized expansions were compared, which pointed out another 493
pessimum effect. The pessimum size effect of stabilized expansion appears not to be 494
an intrinsic phenomenon of ASR expansion but to depend on the size of the specimen 495
used to perform the expansion test. For the largest specimens, no pessimum effect was 496
detected for the aggregate size used in this study. The scale effect has been explained 497
by fracture mechanics concepts: the larger the ratio between the aggregate and 498
specimen sizes, the larger the stress intensity factor around the aggregate and the faster 499
the cracking around the aggregate. After cracking, a part of the ASR gels can be 500
accommodated by cracks. 501
2. Considering that the scale effect is unavoidable for experimental specimens (the ratio 502
between specimen and aggregate sizes should be larger than 100 to significantly 503
decrease the effect), the results of expansion tests should be analysed with respect to 504
this effect. The modelling proposed took the scale effect into account through an 505
empirical relationship considering underlying linear fracture mechanics concepts. 506
Calculations are in good accordance with experiments for expansion tests performed 507
with ratios higher than 10 between specimen and aggregate sizes for the four 508
aggregates studied. 509
Finally, this paper points out the complexity of ASR expansion and states the numerous 510
parameters that have to be taken into account to obtain relevant calculations. Another 511
important conclusion is that stress-free expansions obtained on specimens cannot be directly 512
used as input parameters in structural models because they are strongly dependent on the 513
specimen size and on the conservation conditions during the expansion test. To be used, 514
stress-free expansion test results should be interpreted by considering the phenomena pointed 515
out in this work. Such an approach is possible: free expansion tests can be carried out to 516
assess the AAR advancement in aggregates, while the expansion in the conditions of the 517
damaged structures is assessed through a finite element inverse analysis able to combine the 518
fitting of the expansion measured on structures with the chemical advancement kinetics 519
deduced from laboratory tests [57]. 520
Acknowledgements
521
The authors are grateful to Pr Eric Garcia-Diaz, Pr Benoît Fournier, Pr William Prince, Mr 522
Eric Bourdarot and Mr Etienne Grimal for their advice and suggestions, which have helped to 523
improve the analysis and the modelling. 524
References
525
[1] S. Dent Glasser, N. Kataoka, The chemistry of alkali-aggregate reaction, Cement and 526
Concrete Research, 11 (1) (1981) 1-9. 527
[2] R. Dron, F. Brivot, Thermodynamic and kinetic approach to the alkali-silica reaction. 528
Part 2: Experiment, Cement and Concrete Research, 23 (1) (1993) 93-103. 529
[3] T. Ichikawa, M. Miura, Modified model of alkali-silica reaction Cement and Concrete 530
Research, 37 (9) (2007) 1291-1297. 531
[4] T. Ichikawa, Alkali-silica reaction, pessimum effects and pozzolanic effect, Cement 532
and Concrete Research, 39(8) (2009) 716-726. 533
[5] D. McConnell, R.C. Mielenz, W. Y. Holland, K.T. Greene, Cement-aggregate reaction 534
in concrete, Journal of the American Concrete Institute, Proceedings Vol.44, No.2, October 535
1947, pp.93-128. 536
[6] T.M. Kelly, L. Schuman, F.B. Hornibrook, A study of alkali-silica reactivity by means 537
of mortar bar expansions, Journal of the American Concrete Institute, Proceedings Vol.45, 538
No.1, September 1948, pp.57-80. 539
[7] S. Diamond, N. Thaulow, A study of expansion due to alkali-silica reaction as 540
conditioned by the grain size of the reactive aggregate, Cement and Concrete Research,4 (4) 541
(1974) 591-607. 542
[8] S. Sprung, Influence of the alkali-aggregate reaction in concrete, Symposium on 543
Alkali-Aggregate Reaction – Preventive Measures, Icelandic Building Research Institute and 544
State Cement Works, Reykjavik, Iceland, 1975, pp.231-244. 545
[9] D. W. Hobbs, W. Gutteridge, Particle size of aggregate and its influence upon the 546
expansion caused by the alkali-silica reaction, Magazine of Concrete research, 31 (109) 547
(1979) 235-242. 548
[10] D. Lenzner, U. Ludwig, Alkali aggregate reaction with opaline sandstone, 7th 549
International Congress on the Chemistry of Cement, Septima (Ed.), Paris, France, 1980, 550
Vol.3, pp.VII-119 - VII-123. 551
[11] M. Kawamura, K. Takemoto, S. Hasaba, Application of quantitative EDXA analyses 552
and microhardness measurements to the study of alkali-silica reaction mechanisms, 6th 553
International Conference of Alkalis in Concrete, Idorn G.M. and Rostam S. (Editors), 554
Copenhagen, Denmark, 1983, pp.167-174. 555
[12] G. Baronio, M. Berra, L. Montanaro, A. Delmastro, A. Bacchiorini, Couplage d’action 556
de certains paramètres physiques sur le développement de la réaction alcalis-granulats, From 557
Materials Science to Construction Materials Engineering, 1st International RILEM Congress 558
on Durability of Construction Materials, Versailles, France, 1987, Vol.3, pp 919-926. 559
[13] X. Zhang, G. W. Groves, The alkali-silica reaction in OPC-silica glass mortar with 560
particular reference to pessimum effects, Advances in Cement Research 3 (9) (1990) 9-13. 561
[14] C. Zhang, A. Wang, M. Tang, B. Wu, N. Zhang, Influence of aggregate size and 562
aggregate size grading on ASR expansion, Cement and Concrete Research, 29 (9) (1999) 563
1393-1396. 564
[15] A. Shayan, Value-added Utilisation of Waste Glass in Concrete, IABSE Symposium 565
Melbourne 2002. 566
[16] Z. Xie, W. Xiang, Y. Xi, ASR Potentials of Glass Aggregates in Water-Glass 567
Activated Fly Ash and Portland Cement Mortars, Journal of Materials in Civil Engineering,15 568
(1) (2003) 67-74. 569
[17] T. Kuroda, S. Nishibayashi, S. Inoue, A. Yoshino, Effects of the particle size of 570
reactive fine aggregate and accelerated test conditions on ASR expansion of mortar bar, 571
Transactions of the Japan Concrete Institute, 22 (2000) 113-118. 572
[18] Y. Shao, T. Lefort, S. Moras, D. Rodriguez, Studies on concrete containing ground 573
waste glass, Cement and Concrete Research, 30 (1) (2000) 91-100. 574
[19] T. Kuroda, S. Inoue, A. Yoshino, S. Nishibayashi, Effects of particle size, grading and 575
content of reactive aggregate on ASR expansion of mortars subjected to autoclave method, 576
12th International Conference on Alkali-Aggregate Reaction in Concrete, Tang M. and Deng 577
M. (Editors), Beijing, China, 2004, pp.736-743. 578
[20] K. Ramyar, A. Topal, O. Andic, Effects of aggregate size and angularity on alkali– 579
silica reaction, Cement and Concrete Research, 35 (2005) 2165-2169. 580
[21] M. Moisson, M. Cyr, E. Ringot, A. Carles-Gibergues, Efficiency of reactive aggregate 581
powder in controlling the expansion of concrete affected by alkali-silica reaction (ASR), 12th 582
International Conference on Alkali-Aggregate Reaction in Concrete, Tang M. and Deng M. 583
(Editors), Beijing, China, 2004, pp.617-624. 584
[22] S. Multon, M. Cyr, A. Sellier, N. Leklou, L. Petit, Coupled effects of aggregate size 585
and alkali content on ASR expansion, Cement and Concrete Research, 38 (2008) 350-359. 586
[23] S. Multon, M. Cyr, A. Sellier, P. Diederich, L. Petit, Effect of aggregate size and 587
alkali content on ASR expansion, Cement and Concrete Research, 40 (2010) 508–516. 588
[24] C.F. Dunant, K.L. Scrivener, Effects of aggregate size on alkali–silica-reaction 589
induced expansion, Cement and Concrete Research 42 (6) (2012) 745–751. 590
[25] RFM Bakker, The influence of test specimen dimensions on the expansion of reactive 591
alkali aggregate in concrete. Proceedings of the 6th ICAAR, Copenhagen, Denmark, 1983, 592
pp. 369-375. 593
[26] C. Zhang, A. Wang, M. Tang, N. Zhang, Influence of dimension of test specimen on 594
alkali aggregate reactive expansion, ACI Materials Journal, 96 (1999) 204-207. 595
[27] J. Duchesne, M-A. Bérubé, Effect of the cement chemistry and the sample size on 596
ASR expansion of concrete exposed to salt, Cement and Concrete Research, 33 (2003) 629– 597
634. 598
[28] N. Smaoui, M-A. Bérubé, B. Fournier, B. Bissonnette, Influence of specimen 599
geometry, direction of casting, and mode of concrete consolidation on expansion due to ASR. 600
Cement, Concrete and Aggregate, 26 (2004) 58-70. 601
[29] P. Goltermann, Mechanical predictions on concrete deterioration. part 1: Eigenstresses 602
in concrete, ACI Materials Journal, 91 (6) (1994) 543–550. 603
[30] Z.P Bazant, A. Steffens, Mathematical model for kinetics of alkali-silica reaction in 604
concrete, Cement and Concrete Research, 30 (2000) 419–428. 605
[31] I. Comby-Perot, F. Bernard, P.-O. Bouchard, F. Bay, E. Garcia-Diaz, Development 606
and validation of a 3D computational tool to describe concrete behaviour at mesoscale. 607
Application to the alkali-silica reaction, Computational Material Science, 46 (4) (2009) 1163-608
1177. 609
[32] C.F. Dunant, K.L. Scrivener, Micro-mechanical modelling of alkali–silica-reaction 610
induced degradation using the AMIE framework, Cement and Concrete Research 40 (4) 611
(2010) 517–525. 612
[33] Y. Furusawa, H. Ohga, T. Uomoto, An analytical study concerning prediction of 613
concrete expansion due to alkali-silica reaction, in Malhotra (ed.), 3rd International 614
Conference on Durability of Concrete, Nice, France, 1994, pp 757–780. 615
[34] S. Multon, A. Sellier, M. Cyr, Chemo–mechanical modeling for prediction of alkali 616
silica reaction (ASR) expansion, Cement and Concrete Research, 39 (2009) 490-500. 617
[35] S. Poyet, A. Sellier, B. Capra, G. Foray, J.-M. Torrenti, H. Cognon, E. Bourdarot, 618
Chemical modelling of Alkali Silica reaction: Influence of the reactive aggregate size 619
distribution, Materials and Structures, 40 (2007) 229–239. 620
[36] A. Nielsen, F. Gottfredsen, F. Thogersen, Development of stresses in concrete structures 621
with alkali-silica reactions, Material and Structures, 26 (1993) 152-158. 622
[37] A. Sellier, J-P. Bournazel, A. Mébarki, Modelling the alkali aggregate reaction within a 623
probabilistic frame-work, 10th International Conference of Alkali Aggregate Reaction, 624
Melbourne, Australia, 1996, pp 694-701. 625
[38] A. Suwito, W. Jin, Y. Xi, C. Meyer, A mathematical model for the pessimum effect of 626
ASR in concrete, Concrete Science and Engineering, 4 (2002) 23-34. 627
[39] A. Sellier, J-P. Bournazel, A. Mébarki, Une modélisation de l'alcali-réaction intégrant 628
une description des phénomènes aléatoires locaux, Materials and Structures 28 (1995) 373-629
383. 630
[40] L. Charpin, A. Ehrlacher, A computational linear elastic fracture mechanics-based 631
model for alkali–silica reaction, Cement and Concrete Research, 42 (4) (2012) 613-625. 632
[41] H.W. Reinhardt, O. Mielich, A fracture mechanics approach to the crack formation in 633
alkali-sensitive grains, Cement and Concrete Research, 41 (3) (2011) 255-262. 634
[42] X.X. Gao, S. Multon, M. Cyr, A. Sellier, Optimising an expansion test for the 635
assessment of alkali-silica reaction in concrete structures, Materials and Structures, 44 (2011) 636
1641–1653. 637
[43] X.X. Gao, Contribution to the requalification of Alkali Silica Reaction (ASR) 638
damaged structures: Assessment of the ASR advancement in aggregates, PhD thesis, 2010, 639
Université de Toulouse, France. 640
[44] J. Lemaître, J-L. Chaboche, Mécanique des Matériaux Solides, Dunod (Eds.), Paris, 641
France, 1988. 642
[45] D. François, A. Pineau, A. Zaoui, Comportement mécanique des matériaux : 643
viscoplasticité, endommagement, mécanique de la rupture, mécanique du contact, Hermes 644
Eds, 1993. 645
[46] V. Saouma, L. Perotti, Constitutive model for alkali-aggregate reactions, ACI 646
Materials Journal, 103 (3) (2006) 194-202. 647
[47] E. Garcia-Diaz, J. Riche, D. Bulteel, C. Vernet, Mechanism of damage for the alkali– 648
silica reaction, Cement and Concrete Research, 36 (2006) 395 – 400. 649
[48] M. Ben Haha, E. Gallucci, A. Guidoum, K.L. Scrivener, Relation of expansion due to 650
alkali silica reaction to the degree of reaction measured by SEM image analysis, Cement and 651
Concrete Research 37 (2007) 1206–1214. 652
[49] D.W. Hobbs, Deleterious alkali–silica reactivity in the laboratory and under field 653
conditions, Magazine of Concrete Research 45 (163) (1993) 103–112. 654
[50] C. A. Rogers, R. D. Hooton, Reduction in Mortar and Concrete Expansion with 655
Reactive Aggregates Due To Alkali Leaching, Cement, Concrete and Aggregates 13(1) (1991) 656
42-49. 657
[51] M.H. Shehata, M.D.A. Thomas, The effect of fly ash composition on the expansion of 658
concrete due to alkali–silica reaction, Cement and Concrete Research 30 (7) (2000) 1063– 659
1072. 660
[52] M.D.A. Thomas, B.Q. Blackwell, P.J. Nixon, Estimating the alkali contribution from fly 661
ash to expansion due to alkali-aggregate reaction in concrete, Magazine of Concrete Research 662
48 (177) (1996) 251–264. 663
[53] S. Goto, D. M. Roy, Diffusion of ions through hardened cement pastes Cement and 664
Concrete Research, 11 (5–6) (1981) 751-757. 665
[54] H.F.W. Taylor, Cement Chemistry, Academic Press, London, 1990. 666
[55] K. L. Scrivener, K. M. Nemati, The percolation of pore space in the cement 667
paste/aggregate interfacial zone of concrete, Cement and Concrete Research 26(1) (1996) 35-668
40. 669
[56] K. L. Scrivener, A. K. Crumbie, P. Laugesen, The interfacial transition zone (ITZ) 670
between cement paste and aggregate in concrete, Interface science 12 (2004) 411-421. 671
[57] A. Sellier, E. Bourdarot E., S. Multon, M. Cyr, E. Grimal, Combination of structural 672
monitoring and laboratory tests for the assessment of AAR-swelling: application to a gate 673
structure dam, ACI Materials Journal 106 (3) (2009) 281-290. 674
675 676
677
TABLES
678 679 680
Table 1: Reactive silica contents of different aggregates [43]
681
Reactive silica (SiO2) SL O Q QA
Percentage by mass (%) 6.9 50.4 7.6 2.7
Content (mol/m3 of aggregate) 3000 21900 3300 1170
682 683
Table 2: Parameters of model
Parameter Symbol Identification Value Units
Aggregate
Reactive silica content s measurement D.N.A.* mol/m3
Coefficient of diffusion Da curve fitting D.N.A.* m²/s
Porosity p usual value 0.01 %
Paste
Porosity of mortar pmort measurement 18.0 %
Thickness of the connected porous interface zone
tc curve fitting 14.0 x 10⁻⁶ m
Gel
Molar volume of ASR gel Vgelmol curve fitting 1.7 x 10⁻⁴ m3/mol
Scale effect coefficient c curve fitting 0.037 (mol/m3)-χ
Silica content exponent χ curve fitting 0.75 -
* depends on the nature of the aggregate
684 685
686
FIGURES
687 688
Figure 1: ASR expansions according to the alkali concentration of the immersion solution for SL (0.77, 1.0 and 1.25 mol/l) and to the nature of the aggregate (O: opal, SL: siliceous limestone, Q: quartzite and QA: quartz aggregate) stored in the 1 mol/l NaOH immersion solution
689 690
(a)
(b)
Figure 2: Cracking patterns of specimens cast with the siliceous limestone (a) and with opal (b) 691 692 693 0.00 0.40 0.80 1.20 1.60 0 100 200 300 400 O SL - 0.77M SL - 1M SL - 1.25M Q QA A S R e x p a n si o n (% ) Time (days) SL QA Q O 20 x 20 x 160
(a)
(b)
(c)
Figure 3: ASR expansions on prismatic specimens 20x20x160 mm (a), 40x40x160 mm (b) and 70x70x280 mm (c) 694 695 696 0.0 0.2 0.4 0.6 0.8 1.0 1.2 0 100 200 300 400 500 A S R e x p a n s io n ( % ) Time (days) 315-630 630-1250 1250-2500 0-315 20x20x160 mm 0 0.2 0.4 0.6 0.8 1 1.2 0 100 200 300 400 500 A S R E x pa ns ion (% ) Time (days) 315-630 630-1250 1250-2500 0-315 40x40x160 mm 0 0.2 0.4 0.6 0.8 1 1.2 0 100 200 300 400 500 A S R e x p a n s io n ( % ) Time (days) 315-630 630-1250 1250-2500 0-315 70x70x280 mm
697
698
Figure 4: Final ASR expansions according to specimens size and aggregates size 699
700 701 702
703
Figure 5: Four phases of ASR development: ion diffusion (a), reaction with the reactive silica
704
(b), gel pressure (c), and stress development (d). Top line: diffuse reactive silica distribution, 705
bottom line: veins 706
Figure 6: Final expansions according to reactive silica content
Figure 7: Measured and calculated expansions at 50 days according to the alkali
concentration of the solution (calculations performed with or without the threshold of 0.625 mol/l) 0 0.4 0.8 1.2 1.6 0 5000 10000 15000 20000 25000 F in a l e x p a n s io n (% )
Reactive silica content in m3aggregate (mol/m3)
QA Q SL O 0.00 0.10 0.20 0.30 0.40 0.50 0.60 0.6 0.8 1 1.2 E x p a n s io n ( % ) Alkali concentration