https://doi.org/10.4224/20377907
READ THESE TERMS AND CONDITIONS CAREFULLY BEFORE USING THIS WEBSITE.
https://nrc-publications.canada.ca/eng/copyright
Vous avez des questions? Nous pouvons vous aider. Pour communiquer directement avec un auteur, consultez la
première page de la revue dans laquelle son article a été publié afin de trouver ses coordonnées. Si vous n’arrivez pas à les repérer, communiquez avec nous à PublicationsArchive-ArchivesPublications@nrc-cnrc.gc.ca.
Questions? Contact the NRC Publications Archive team at
PublicationsArchive-ArchivesPublications@nrc-cnrc.gc.ca. If you wish to email the authors directly, please see the first page of the publication for their contact information.
NRC Publications Archive
Archives des publications du CNRC
For the publisher’s version, please access the DOI link below./ Pour consulter la version de l’éditeur, utilisez le lien DOI ci-dessous.
Access and use of this website and the material on it are subject to the Terms and Conditions set forth at
Development of Micro Combined Heat and Power Technology
Assessment Capability at the Canadian Centre for Housing Technology Bell, M.; Swinton, M. C.; Entchev, E.; Gusdorf, J.; Kalbfleisch, W.; Marchand, R. G.; Szadkowski, F.
https://publications-cnrc.canada.ca/fra/droits
L’accès à ce site Web et l’utilisation de son contenu sont assujettis aux conditions présentées dans le site
LISEZ CES CONDITIONS ATTENTIVEMENT AVANT D’UTILISER CE SITE WEB.
NRC Publications Record / Notice d'Archives des publications de CNRC:
https://nrc-publications.canada.ca/eng/view/object/?id=45f659d3-bd7f-4959-bbf6-94a0736bb4ac https://publications-cnrc.canada.ca/fra/voir/objet/?id=45f659d3-bd7f-4959-bbf6-94a0736bb4ac
Canadian
Centre
Centre
canadien
des
for Housing Technology
technologies résidentielles
Development of Micro Combined Heat and Power Technology Assessment Capability At the Canadian Centre for Housing Technology
Bell, M.; Swinton, M.; Entchev, E.; Gusdorf, J.; Kalbfleisch, W.; Marchand, R.; Szadkowski, F.
B-6010
The Canadian Centre for Housing Technology (CCHT)
Built in 1998, the Canadian Centre for Housing Technology (CCHT) is jointly operated by the National Research Council, Natural Resources Canada, and Canada Mortgage and Housing Corporation. CCHT's mission is to accelerate the development of new technologies and their acceptance in the marketplace.
The Canadian Centre for Housing Technology features twin research houses to evaluate the whole-house performance of new technologies in side-by-side testing. The twin houses offer an intensively monitored real-world environment with simulated occupancy to assess the performance of the residential energy technologies in secure premises. This facility was designed to provide a stepping-stone for manufacturers and developers to test innovative technologies prior to full field trials in occupied houses.
As well, CCHT has an information centre, the InfoCentre, which features a showroom, high-tech meeting room, and the CMHC award winning FlexHouse™ design, shown at CCHT as a demo home. The InfoCentre also features functioning state-of-the art equipment, and demo solar photovoltaic panels. There are over 50 meetings and tours at CCHT annually, with presentations and visits occurring with national and international visitors on a regular basis.
D
EVELOPMENT OFM
ICROC
OMBINEDH
EAT ANDP
OWERT
ECHNOLOGYA
SSESSMENTC
APABILITY AT THEC
ANADIANC
ENTRE FORH
OUSINGT
ECHNOLOGYF
INALR
EPORTMike Bell, co-Project Manager, Natural Resources Canada
Mike Swinton, co-Project Manager, National Research Council Canada Evgueniy Entchev, Natural Resources Canada
John Gusdorf, Natural Resources Canada
Walter Kalbfleisch, National Research Council Canada Roger Marchand, National Research Council Canada Frank Szadkowski, Natural Resources Canada
Table of Contents
Preface... iii Acknowledgement ... iii Acronyms... iv Executive Summary ... v 1.0 Introduction... 1 2.0 Project Background... 1 3.0 Objective ... 3 4.0 Approach... 4 4.1 Electrical Modifications... 4 Costs... 5Electricity Meters and Link to the Data Logging System... 6
Power Quality Meters ... 6
4.2 Balance of Plant Design and Installation ... 7
Setups of the BOP... 8
4.3 The CHP - Stirling Engine... 9
4.4 Control Strategy ... 9
CHP Unit Control ... 9
Balance of Plant Control... 9
4.5 Instrumentation of the BOP ... 10
5.0 Monitoring and Results... 10
Analysis Approach - Calculation of Efficiencies from Energy Balances... 11
CHP Unit Efficiency ... 14
BOP and System Efficiency... 15
Parasitic Pump Losses... 15
Potential for Electrical Power Reduction and Export to the Grid... 16
Role of Thermal Storage Interfacing Between CHP and Air Handler... 19
Power Quality Analysis ... 19
6.0 Discussion ... 19
7.0 Conclusion ... 21
References... 22
APPENDIX A - Definitions and Terminology... 23
APPENDIX B – Electrical Drawings ... 26
APPENDIX C – Power Quality Metering: Outputs and Analysis... 28
List of Power Quality Meter Outputs for Consideration ... 28
Manitoba Hydro Analysis ... 31
Hydro-Québec Analysis: Evaluation of Power Quality Data in the Development of Micro Combined Heat and Power Technology Assessment Capability at the Canadian Centre for Housing Technology ... 32
Output power and voltage distortion (impact on voltage distortion)... 32
Measurements ... 32
Conclusions on voltage THD... 35
Output power and current distortion (current distortion while running) ... 36
Measurements ... 36
Conclusions on current THD ... 39
Overall conclusions... 40 APPENDIX D - Summary of CHP Plant Operation and Interruptions ... 41 APPENDIX E - Residential Stirling Engine Micro CHP Unit ... 43 APPENDIX F- Range of Outdoor Temperatures Experienced during the CHP project. 44 APPENDIX G - Table of Simulated Occupancy Events in the CCHT Test House ... 47
Preface
This project was undertaken by Natural Resources Canada, National Research Council Canada, and Canada Mortgage and Housing Corporation to develop and demonstrate a test facility at the Canadian Centre for Housing Technology (CCHT) which would incorporate the capability of assessing residential micro combined heat and power (CHP) systems under real-world conditions.
The project was overseen be a Steering Committee representing the funders of the project. Steering Committee members played an important role in reviewing the work, raising key issues to be addressed and promoting clarity and relevance of the reporting.
Steering Committee
BC Hydro - Gary Hamer/Jim Gurney Manitoba Hydro - Sean Quigley
Enbridge Gas Distribution Inc. - T.J. Hwang/David Furdas Hydro-Québec - Éric Le Courtois/Michel Dostie
Fuel Cell Technologies Ltd. - John Stannard and Gord McAlary Public Works and Government Services Canada - Edward Morofsky Canada Mortgage and Housing Corporation - Ken Ruest
National Research Council - Francois Girard (Innovation Ctr.) and Mike Swinton (CCHT) Natural Resources Canada - Mike Bell
The Project Working Group members participated in project execution, including planning and modifications of the facility, as well as monitoring, and reporting.
Project Working Group
NRCan
Mike Bell, co-Project Manager Evgueniy Entchev
John Gusdorf Frank Szadkowski NRC
Mike Swinton, co-Project Manager Walter Kalbfleisch
Roger Marchand
Acknowledgement
The authors wish to acknowledge the collaboration and contributions of Éric Le Courtois, Laboratoire des technologies de l’énergie, Hydro-Québec, for analyzing and evaluating the power quality performance of the CHP system, as reported in Appendix C.
Acronyms
AH - air handler, which is comprised of a fan motor, fan, and coil connected to the house’s forced air circulation system.
BOP - balance of plant, which makes use of the heat generated by the CHP unit CHP - combined heat and electrical power generation
DG - distributed generation, also DR – distributed resource DHW - domestic hot water heater
FID - flame ionization detector
HVAC - Heating, Ventilating and Air-conditioning systems HW - hot water
HWT - hot water tank NG - natural gas PQ - power quality PQM - power quality meter ST - hot water storage tank THD - total harmonic distortion
WG - WhisperGen, the CHP unit manufactured by Whisper Tech Ltd.
CCHT - Canadian Centre for Housing Technology CMHC - Canada Mortgage and Housing Corporation NRCan - Natural Resources Canada
NRC - National Research Council Canada
NRC- IFCI - NRC - Institute for Fuel Cell Innovation ENVLAB - Environmental Laboratory
RFCSTS - Residential Fuel Cell System Test Station
Executive Summary
In 2003, Natural Resources Canada, National Research Council Canada, and Canada Mortgage and Housing Corporation developed and demonstrated a test facility at the Canadian Centre for Housing Technology (CCHT) which incorporated the capability of assessing residential micro combined heat and power (CHP) systems under real-world conditions. The intent of the project was to adapt one of two existing research houses at CCHT to integrate a prototype CHP unit that would provide some electricity and heat to the house, and supply surplus electricity back to the grid. Documentation of the
adaptation and CHP operation, including building integration issues and CHP
performance characteristics, were key objectives, with the intent of providing valuable information to CHP manufacturers and researchers alike.
The CHP unit chosen for this demonstration was the Whisper Tech Ltd. Stirling engine, fuelled by natural gas. The unit had a small electrical capacity (750 W) and a larger thermal output (6.5 kW). It was designed to be ‘heat-driven’- controlled according to heat demand of the residence, so that electricity generation is a by-product. The unit was installed as a grid-connected device, with local electrical inspections performed. The Test House at CCHT, a fully automated and monitored house, was adapted to allow waste heat from the CHP unit to be collected, stored and used to meet space and water heating loads of the house. This portion of the CHP system was referred to as the ‘Balance of Plant’ (BOP). As well, the house’s electrical wiring was reconfigured to permit the CHP generator to provide electricity to both the house, addressing a portion of the house’s electrical needs, and to the electrical power grid, on occasions where the house loads were less than the CHP unit electrical output.
The CHP unit was then installed in the basement of the Test House and connected to thermal and electrical systems. The existing house thermostat on the main floor wall, and the programmed demand for hot water ultimately controlled the CHP’s BOP by calling for heat from the system. Controls in the BOP signalled a need for heat from the CHP unit when heat stores were being depleted. The CHP generated electricity simultaneously whenever there was a demand for heat. Installed meters kept track of how much
electricity was being generated and where it was going, whether to the house, to the grid or both.
Operation of the house with the CHP unit occurred between March and June 2003. Both the house performance and the CHP system were monitored extensively. Outdoor conditions ranged from late winter to summer conditions in the Ottawa area. This
allowed the CHP unit performance to be assessed under a range of space heating loads, as well as a daily profile of water heating loads associated with the CCHT Test House operation. (The house features a simulated occupancy in which all major appliances and water using devices were used under a realistic schedule).
Results showed good performance of the CHP unit, with many scenarios or combinations being tested over the monitoring period. The CHP unit was observed to supply all of the space and water heating loads in most circumstances, requiring heating backup in a few instances during CHP unit shutdown. The CHP unit was shown to provide a considerable percentage of the house’s electrical requirement, 43% in one example, and even exported 6% of its electricity generation back to the grid in that same period.
The overall performance of the CHP system was shown to compare favourably with the efficiency of domestic combination space and water heaters fired by natural gas, e.g. about 82% total efficiency of the CHP unit, with 6% of the inputs going to electricity generation and 76% going to heating on average. The heat storage and distribution system designed for this demonstration averaged about 57% efficiency resulting in a total CHP system efficiency of about 50%. All efficiencies were noted to be higher in colder weather, when the heat was better utilized, and resulted in fewer standby losses. Better optimization of the BOP may be needed (possibly a one tank system) to reduce standby heat losses.
Some of the issues addressed but not necessarily resolved over the course of this study included:
• The variability in acceptance by local utilities across Canada of the concept of feeding electricity back to the grid on a micro level. (This was not a problem in our jurisdiction as the NRC campus already has a co-generation plant in
operation).
• The cost of electrical modifications for an actual house (as opposed to our test house) – estimated to be of the order of $2k to $3k.
• The need by the Canadian Electrical Code of an ‘external, weatherproof, lockable disconnect’ to allow the power utility to manually disconnect the CHP from the grid during periods of power failure and repair. This requirement is to protect linesmen from uncontrolled sources of power to the grid during line repair. This feature was included in our design, but the 200 amp service originally installed to give us flexibility for growth of the electrical system necessitated a more robust and expensive disconnect than may normally be required.
• The cost of the CHP unit itself – ours was $12k US for the prototype unit. Current models cost approximately $7.5k US.
• Issues relating to reliability, durability, and value of the electricity generated were discussed within the context of ‘return on investment’ or ‘payback’, but these were not examined in detail.
• The long warm-up period for the CHP unit to start generating electricity after shutdown (e.g. about 30 minutes).
• The design and control of the Balance of Plant (for heat storage and distribution) to minimize shutdown of the CHP, and maximize the overall efficiency of that part of the system.
• The role of a heat-driven CHP unit in the summer, when the thermal load is small and the BOP heat losses to the house are relatively high.
• Whether or not a backup burner (in the form of a water heater in our case) was needed to address all space and water heating loads of the house.
The Whisper Tech Ltd. CHP was used to demonstrate the CHP testing and monitoring capability of the converted CCHT house. While the testing of the WhisperGen itself was not intended to be exhaustive, the performance of the CHP during the demonstration suggests that the system has promise and merits follow-up work to address the above issues.
It was concluded that this project met all three of its objectives, including
• the successful adaptation of the CCHT test house to integrate a micro CHP grid-connected system;
• quantification of the CHP unit and overall system performance for a range of conditions spanning late winter to summer conditions in Ottawa; and
• collection of information and development of experience in installing, commissioning, monitoring and analyzing the performance of residential cogeneration systems in houses.
D
EVELOPMENT OFM
ICROC
OMBINEDH
EAT ANDP
OWERT
ECHNOLOGYA
SSESSMENTC
APABILITY ATCCHT
1.0 Introduction
Small combined heat and power (CHP) systems which can generate thermal and
electrical energy at a community or even single household level are beginning to emerge as a viable alternative to large and expensive power generating stations in some
circumstances. In a combined heat and power application, electricity is produced where it is needed (distributed generation (DG)) and opportunities exist for heat recovery from waste heat, which boosts efficiency. As well, emissions can be reduced by using fuel sources more efficiently and possibly by using cleaner fuels.
Events like the 1998 Ice Storm in Eastern Canada, rolling brownouts in California, and the recent blackout in Eastern North America (August 2003) have increased
homeowners’ interest in small power plants that can provide primary or back-up power for their houses. In addition, CHP systems may be particularly attractive for remote communities where connection to the grid is not a cost-efficient alternative.
There are several technologies being developed for residential CHP. At this time, promising clean-fuel CHP technologies include Stirling engines and fuel cells. Residential Stirling engine CHP systems appear to be closest to commercialisation. However, fuel cell technology, while still in the developmental stages, offers much promise for combined heat and power. Developers have realized that there are market opportunities and they have been busy developing CHP systems for residential
applications. Machines ranging in size from 1 to 10 kW could provide all or part of the electricity and heat required by a typical Canadian household. Some systems are intended for remote, off-grid applications, while others are designed for houses that are grid-connected. In either case, heat co-generated with electricity generation can be recovered to provide space and water heating to the house, as well as other potential uses. Several Canadian companies are currently focussing on the development of residential fuel cell CHP systems.
2.0 Project
Background
A major challenge is the integration of CHP systems into residential electrical and heating (HVAC) systems.
Questions surround issues such as:
• The sizing of the CHP system relative to average and peak residential electrical and thermal loads
• Optimisation of CHP system operation and run time
• Electrical lead (control by electrical demand) versus thermal lead (control by heat demand) and dealing with the simultaneous production of heat and electricity
• Need for and sizing of thermal and electrical storage (especially for off-grid systems)
• Handling and use of possible excess heat in summer
• Grid connection techniques and issues
• Internal house wiring to provide safety, minimize costs and allow emergency operation of critical loads
At the present time, prototype Canadian fuel cell CHP plants are undergoing laboratory testing by the manufacturers. Discussions with several fuel cell companies have
indicated that field-testing of first generation prototypes in a well-controlled but realistic residential setting such as the Canadian Centre for Housing Technology would
significantly accelerate integration development of these systems. This would be a very beneficial step before proceeding to full field trials in occupied houses.
The two research houses at the Canadian Centre for Housing Technology (CCHT) offered an intensively monitored real-world environment, with simulated occupancy to assess the performance of residential CHP systems in secure premises. This facility, which is jointly operated by the National Research Council (NRC), Natural Resources Canada (NRCan) and Canada Mortgage and Housing Corporation (CMHC) was designed to provide a stepping-stone for manufacturers of innovative technologies or systems prior to full field trials in occupied houses. See references 1 and 2 for a description of the research houses and their features, and Appendix G for a list of scheduled events that make up the ‘simulated occupancy’.
Assessing the performance of CHP systems at CCHT was intended to provide
manufacturers and researchers with a wealth of information about the performance of such systems under realistic operating conditions, including simulated human activity. The project described in this report involved making the CCHT houses CHP ready, proving the performance capability, and testing an early Stirling CHP system. A description of the Whispertech Stirling engine CHP system is provided in Appendix E. As part of this project, features were added to CCHT that are necessary for CHP testing and development, and the facility is ready and proven by the testing of the initial residential CHP prototype.
Modifications were made to the electrical wiring, the HVAC/DHW and monitoring systems of the CCHT Test House to allow residential micro CHP systems to be quickly connected, and to allow monitoring of all essential electrical and thermal micro CHP quantities.
Once the house was modified, the performance capability of CCHT as a CHP testing tool was demonstrated and proven by installing and testing an early residential CHP system (Stirling engine). As this system is not based on fuel cell technology, it allowed the Canadian fuel cell manufacturers to participate in the project in a pre-competitive
environment. This project provided participants with preliminary insights into the integration of residential CHP and the operation of the Stirling engine CHP system. This work also gave the participating scientific and technical personnel experience with installing, commissioning, monitoring and analyzing the performance of a residential cogeneration system in a house. For example, the residential fuel cell system laboratory test facility currently being built at the NRC Fuel Cell Program facility at the NRC Institute for Fuel Cell Innovation (NRC-IFCI) in Vancouver will benefit from the results of this work. This facility, composed of a Residential Fuel Cell System Test Station (RFCSTS) and an Environmental Laboratory (ENVLAB), is complementary to CCHT in that it addresses system design issues while the CCHT will tackle systems integration in a real world residential application. The information gathered through the work at CCHT was to provide the background for testing protocols for CHP fuel cell systems.
This unique combination of “residential CHP-ready” facility and multidisciplinary expertise was intended to provide Canadian manufacturers of residential fuel cells and other types of residential CHP systems with a resource that is unmatched elsewhere in the world and from which they can derive a significant competitive advantage in the global marketplace. It was also intended to provide gas and electric utilities with a facility in which to evaluate the performance of residential CHP systems to assess impact on distribution systems, sales and business opportunities.
3.0 Objective
One objective of this project was to develop and demonstrate a test facility at the CCHT with the capability to assess residential CHP systems and their integration into houses, under real-world conditions. The project was intended to result in a highly sophisticated “residential CHP-ready” facility operated by a multidisciplinary team of professionals experienced in installation, commissioning, monitoring, analysis, optimization and modeling of such systems.
Another objective was to quantify the performance of one early residential CHP system (Stirling engine based) and to examine building integration issues such as HVAC interface, storage, control, CHP system sizing, etc. This information should be useful to residential CHP manufacturers, utilities and others to evaluate building integration issues, to evaluate the CHP system under test in particular and to gain impressions of residential CHP in general.
As well, this project gathered information to feed the NRC-RFCSTS-ENVLAB facility with relevant knowledge for laboratory testing of residential fuel cell CHP systems. The NRC-RFCSTS-ENVLAB facility was intended to cover system testing in a lab
environment, system design and accelerated testing while CCHT was to look at system integration/controlled field-testing under real world conditions. Such a combined national facility would be unmatched in the world for complete system testing and evaluation of residential CHP.
4.0 Approach
The project consisted of designing and implementing the facility modifications in the following areas:
1. Electrical modifications to integrate the CHP system into the CCHT Test House’s electrical system, and to allow the CHP to export electricity to the grid. This work included the design of the electrical modifications, added wiring, safety switches, electrical panels, metering for the datalogging equipment and power quality meters.
2. Design and installation of the Balance of Plant (BOP) to integrate the CHP system into the Test House’s space and water heating system. Added components of the BOP included a hot water storage tank, pumps and piping, and controls. These were integrated with an existing water heater and air handler that had been
adapted to supply both space and water heating to the house in a previous project. 3. Installation and connection of the CHP system.
4. Specification and installation of several control systems for the CHP and BOP. 5. Development of an extensive monitoring package for each of the sub-systems that
formed the CHP System.
Once the modifications were completed, the facility was commissioned and experiments were performed from March to June 2003, when space-heating demand was reduced to zero.
This report documents the changes to the CCHT Test House facility, the experimental program and the results of the monitoring.
4.1 Electrical Modifications
The electrical modifications were designed by the Administrative Services and Property Management (ASPM) unit of NRC with input from the Working Group and the Steering Committee, as well as local regulatory authorities. ASPM is responsible for all buildings on the NRC campus, including electrical and HVAC systems. ASPM had previous experience integrating their own commercial-sized CHP system into the grid, and their expertise contributed to the project, including a good understanding and working relationship with local regulatory authorities.
The modifications were made to accommodate the installation of combined heat and power (CHP) systems having a generating capacity up to 40 kWe, for either grid-dependent operation (this project) or stand-alone, grid-ingrid-dependent operation (possible future projects).
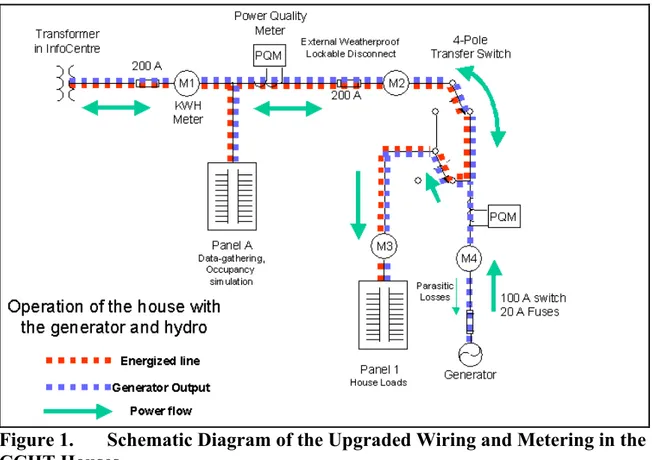
The following wiring changes were made to each1 test house:
1. Three additional bi-directional, pulse generating kilowatt-hour meters, and an additional power quality meter were added for monitoring purposes.
2. A weatherproof, padlockable disconnect switch was installed on the exterior of each house to meet requirements of rule 84-028 of the Canadian Electrical Code.
3. A four-pole transfer switch was installed to allow various generator configurations without re-wiring.
4. A 100-amp disconnect / isolating switch with 20-amp fuses was installed to protect and isolate the CHP generator under test.
A schematic diagram of the integration of these elements to the Test house is shown in Figure 1.
Figure 1. Schematic Diagram of the Upgraded Wiring and Metering in the CCHT Houses.
Costs
The cost of these wiring modifications was $13,080.65 for both houses, or $6,540.33 for each house. Because these houses were modified to allow for various types of CHP systems, both connected and off-grid, and sized up to 40 kW, the wiring scheme is more elaborate than would be the case for a normal residential installation.
1
Both the Reference and Test houses at CCHT were upgraded according to the wiring diagram in Figure 1. The Test house was the focus of this project, because the CHP unit was installed in that house.
The changes necessary (and costs) for a typical residential installation would depend on many factors:
• Size of the CHP
• Grid-connected, off-grid, or emergency standby capabilities
• Type of generator (induction or DC with inverter)
• Metering requirements
• Local electrical utility requirements (can vary from municipality to municipality) It is estimated that the cost to retrofit a typical residence could be less than the $6.5k required for adaptation of the CCHT test house, and probably in the range of $2k to $3k. This cost could decrease if simpler installation requirements were acceptable to electrical authorities (such as elimination of the external disconnect switch as suggested by the MicroPowerConnect Committee).
Electricity Meters and Link to the Data Logging System
New electrical meters were added to the set of existing meters in the houses, and new components were needed to tie these into the existing data logging system:
• ABB forward and reverse power meters (M1, M2 and M4 in Figure 1)
• installation of NUDAM pulse counters to interpret the signal generated by the meters and,
• an interface between the pulse counters and CCHT’s main data acquisition system (HP-VEE based system) to read and report on the new meters. Data is stored in Excel-compatible “*.CSV” files, and transferred daily on CCHT’s main data transfer site.
Power Quality Meters
Electric utilities and CHP manufacturers had an interest in the power quality of the power generator. As a result, the following steps were undertaken to monitor power quality:.
• The two 7600 ION power quality meters (PQM) were installed and tested. The first was located between the grid and the house, and the second between the CHP generator under test and the house circuits and grid.
• The PQMs were configured according to the type of installation involved in our project.
• A simplified version of the PQMs’ software was set up on a dedicated computer, to allow the team to familiarize itself with the outputs.
• Purchased and setup the PQM “Ion Enterprise” software, for more complete access to data being monitored by the PQMs.
• Contacted the PQM manufacturer and secured the name of a qualified programmer, if more refined analysis should be of interest. .
• Files with power data (power, voltage and current) were recorded every 15 minutes and a variety of power quality data were recorded at one-hour intervals.
A list of outputs recorded from the PQM is provided Appendix C.
4.2 Balance of Plant Design and Installation
The Balance of Plant consists of:
• the Storage Tank (ST),
• the Hot Water Tank (HWT),
• the Air Handler (AH), and
• 3 Pumps and a Mixing Valve as illustrated in Figure 2.
The existing hot water tank (HWT), as well as the air handler (AH), were already in the house as a result of a previous experiment. The HWT was already hooked-up to the house, providing a means of domestic hot water and space heating distribution. The burner on the HWT served as a backup or top-up burner in instances where the CHP unit could not supply all of the heat requirements, either due to heavy demand or shut down of the CHP unit.
Figure 2 Schematic Diagram of The Balance of Plant and Sensors
The storage tank, three pumps, mixing valve and piping connections were specified and installed to complete the BOP. Specifications of BOP components are as follows:
Rheem Hot Water Tank Specifications (HWT in Fig. 2) Rheem PVR50-80
189 liters, 60 US gallons capacity 80,000 Btu/h input
Air Handler Specifications (AH in Fig. 2) Applied Air Systems Inc. air handler Model B3-06
73,000 Btu/h output @ 70ºF entering air temperature and 140ºF entering water temperature.
Storage Tank Specifications (ST in Fig.2) Hubbell Model TU40-20S
40 US gallon capacity 20 sq feet of heat exchanger Pumps
Installed 3 Armstrong Astro –50B pumps Installed sensors and controls as per sketch Copper Pipe
¾ inch copper
Setups of the BOP
The experimental nature of this project afforded the opportunity to configure the same BOP components in two different ways to investigate whether the strategy for directing heated water and cooler return water had an impact on the operating efficiency of the CHP and the BOP, as well as that of the overall system. These approaches are described below.
Setup 1: The Storage tank ST is used as a supplementary heater to the HWT (warm water in storage circulated to HWT, and cooler HWT water back to storage. HWT gets the fresh water supply)
Setup 2: ST is in series with the HWT (hot water from the hot water storage tank circulated to HWT and then to space heat load and back to ST, or to water heating, with fresh water into ST)
In both configurations, the CHP unit is the heating source to the storage (ST), with a closed loop and heat exchangers linking the CHP unit to the storage.
4.3 The CHP - Stirling Engine
The prototype Stirling engine was purchased prior to the start of this project by NRCan for $12k US - current models are available at time of report writing for $7.5k US. The unit was installed at CCHT as a residential micro combined heat and power (micro CHP) device. A Stirling engine is an external combustion device and can burn many different fuels (diesel, NG, propane, biogas, kerosene, and solid fuels) providing the heat
exchanger is specifically designed for the selected fuel and sufficient temperatures can be reached (700 to 1000C).
NRCan purchased this unit and completed lab testing at the Natural Gas Technology Centre (NGTC) with a Natural Gas industry partner, as a separate project preceding this one. The manufacturer’s specification is 750We, 230V AC grid connected, continuous duty, with 6.5kW of co-generated water heating. The fuel is natural gas and the control is by heat demand (heat lead) rather than electrical demand. It performed well in the
previous lab tests, producing 750We gross (with net output of 575We once parasitic electrical consumption of the CHP was subtracted) and produced 6.5kW of heat. The results of the lab tests were made available to funding partners of this CHP project. The CHP unit was installed at CCHT in February 2003, and operated from March till mid-June 2003.
4.4 Control Strategy
CHP Unit Control
As indicated above, the CHP unit was a heat-driven device, so that it is turned on when there is a need for heat in the BOP system. The following is the control strategy for the CHP unit:
• The CHP unit and the pump are turned on if:
o The CHP unit is in stand-by mode (ready to start), and o The top of the ST is < 60ºC.
• The CHP unit is turned off if its output is > 80 ºC.
• The CHP circulation pump is turned off 25 minutes after the CHP unit is turned off.
Balance of Plant Control
The BOP controls turn on and off circulation pumps according to temperatures in the storage tank and the Hot Water:
• The Circulation Pump between the Storage Tank (ST) and the Hot Water Tank (HWT):
o The pump is turned on if the Hot Water tank needs heat and can get it from the Storage tank:
The bottom of the HWT is between 47 and 70 ºC, and
The temperature difference between ST top and HWT bottom is > 7 ºC.
o The pump is turned off if:
The bottom of the HWT is not between 47 and 70 ºC, or The temperature difference is < 2 ºC.
• Operation of the Air Handler (AH) pump and fan is controlled by the house thermostat.
4.5 Instrumentation of the BOP
Each heat transfer loop of the BOP had 2 thermocouples and a flow meter. Shown in Figure 2, the loops are:
–from the CHP unit to the Storage Tank (ST), –from the ST to the Hot Water Tank (HWT), –from the HWT to the Air Handler (AH), and –from the HWT to hot water taps.
Data was collected, and heat flows were calculated every 10 seconds. These were averaged and saved every minute.
Two existing natural gas meters were used to monitor the gas consumption of the CHP unit and that of the HWT back-up burner.
5.0 Monitoring
and
Results
Monitoring took place between March 13 and June 10 2003. For analysis purposes, the overall monitoring period was split up into 39 individual ‘runs’(see terminology in Appendix A) for which energy balances and system efficiencies were calculated. In essence, each ‘run’ can be viewed as an individual experiment. Some of the
characteristics of these runs include:
• The duration of each run ranged from 23 to 65 hours, with an average of 40 hours per run. The duration of runs varied due to CHP unit problems and changes from one Set-up to another.
• 11 runs (497 hours) were in Setup #1.
• 16 runs (594 hours) were in Setup #2.
• 3 additional runs occurred during which the CHP unit failed, and were not analyzed with the others. These ‘failed’ runs demonstrated that the gas burner in the HWT serves as a backup, supplying all space heat and HW demands when the CHP had failed.
• In all runs, the house space heat and hot water demands were met.
• 8 runs used additional heat from the HWT gas burner. This was due to the control strategy and HWT setting, not to lack of available heat from the CHP. For these cases, the gas use by the HWT was 6% or less of total gas use.
The range of outdoor temperatures that prevailed through the test period is shown in Appendix F, along with the list of dates and times for each run.
Analysis Approach - Calculation of Efficiencies from Energy Balances
The analysis kept track of three efficiencies: the CHP unit efficiencies (both electrical and thermal), the BOP Efficiency (thermal) and the System Efficiency (a combined electrical and thermal efficiency). The efficiencies are, by definition, an account of energy outputs divided by energy inputs. Each of these is specified in more detail in Appendix A.
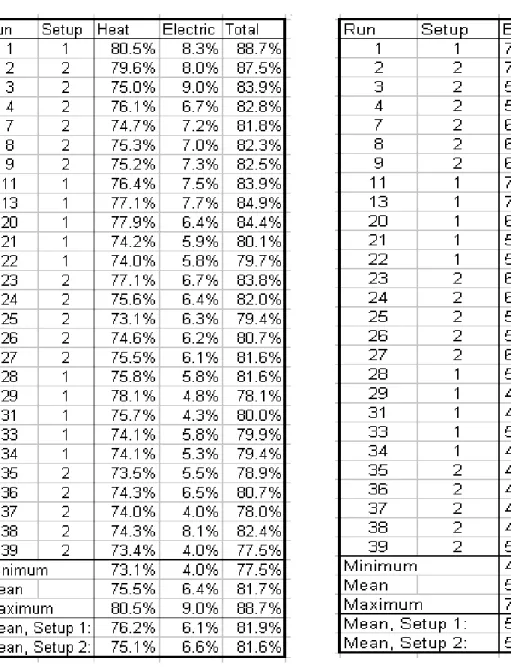
Tables 1 and 2 present the monitoring results of the 39 runs for the CHP unit, the Balance of Plant (BOP), and the System as a whole.
During the review and analysis of results, it was realized that the quantity of heat required by the house for space and water heating would have an influence on each component of the CHP system. Accordingly, each set of efficiencies derived from the monitoring was plotted against the thermal output of the Balance of Plant (which is synonymous with ‘total space and water heating demand’). Those functional relationships are shown in Figures 3, 4 and 5.
Table 1. CHP Unit Efficiencies Table 2. Balance of Plant and
Figure 3. CHP (WhisperGen) Unit Efficiency plotted against the thermal output of the Balance of Plant.
Figure 5. System Energy Efficiency plotted against Balance of Plant Output.
As can be observed, both the CHP unit and the Balance of Plant performance are
dependent on the BOP output, to varying degrees. Some of the trends emerging from this analysis are described below.
CHP Unit Efficiency
• The CHP unit efficiency increased only slightly with an increase in the thermal load. This is probably due to lower average inlet temperatures of the cooling system for the CHP, associated with higher space heating loads.
• When there is no demand for space heat (hot water demand only), the average demand on the BOP is 0.48 kW.
• There were 10 runs with no space heating.
• With no space heating, demand on BOP varied from 0.39 to 0.62 kW, due to different start and end times (different HW demands), and different CHP unit run time patterns.
All three curves in Figures 3,4 and 5 are projected to reach close to the CHP unit output capacity (6.5 kW. At 75% BOP efficiency, that’s 4.88 kW of delivered heat)
According to the regressions in Figure 3:
• The CHP unit heating efficiency varied from 74% for hot water only to about 79% at system capacity.
• The CHP unit electrical efficiency varied from 5.5% to about 9% at system capacity.
• The CHP unit total efficiency varied from 79.5% for HW only to about 88% at system capacity.
BOP and System Efficiency
Observations on the Balance of Plant (Figure 4) and System efficiencies (Figure 5) include:
• The energy efficiencies of both the BOP and the System show significant dependence on thermal load. This is due to the fact that the stand-by losses from the BOP are relatively constant, while the useful heat varies mainly with space heat load.
• According to the regressions, the BOP efficiency varies from 47.6% for HW only to near 80% at CHP capacity, and the system efficiency varies from 41% for HW only to over 70% at CHP capacity.
Results by Setup Configuration
Finally, there were only small differences between the two setups investigated, although setup #2 appeared to generate a slightly better electrical efficiency. Analysis of each setup for dependence on BOP Output showed little appreciable difference in the
sensitivity of the setup to that factor. Note that the last two columns of Table 3 divide the system energy efficiency (column 9) into electrical and heat efficiencies.
Table 3. Summary of Efficiencies by Setup
Parasitic Pump Losses
The BOP includes 3 pumps that are controlled as described above. These pumps consume approximately 78 W for the CHP unit, 86 W for circulation and 73 W for space heating. The CHP pump uses an average of 1.19 kWh per run, or 7.8% of the CHP net electrical output in each run. All 3 pumps together use an average of 1.95 kWh per run, or 12.4% of the CHP net output. All 3 pumps together use an average of 0.4% of the System Output (heat plus net CHP electricity).
The pump energy is therefore low in comparison with CHP unit electrical generation, and insignificant in comparison with total output. Furthermore the pump energy could be
reduced if the pumps were optimized in terms of size, efficiency and control, and/or the electrical output of the CHP were higher, as it would be with a fuel cell sized for a house.
Potential for Electrical Power Reduction and Export to the Grid
Two examples were selected to highlight how much electricity is generated by the CHP in proportion to house electricity demand, and where that electricity goes. The first example, shown in Figure 6a represents one of the colder periods of testing. As well, the run shown in Figure 7a was chosen to show the profiles on a milder day. The figures sort out from where and when the house gets its electricity. The reduction in electrical requirements from the grid due to the CHP unit is apparent, and in some periods electricity is exported back to the grid (negative grid supply).
The summary electricity balance over each run shown in Table 4 illustrates the overall impact of the system. (Table 4 summarizes the information in Figures 6a and 7a). It can be seen that whereas most of the electricity produced by the CHP unit goes to the house (94 and 98% in these examples), there were still instances of export to the grid (6 and 2%), even with this small electrical generator that is regulated on a heat-demand basis. When the house electrical demand is analyzed, it can be seen from these two examples that the CHP does supply important percentages of the house’s electricity requirement (43 and 25% in these examples).
Table 4. Example Electricity Balance for the CHP Supply and the House Demand
Run 13 (April 1 & 2) Run 23 (April 24)
CHP Total Electricity, kWh % Total Electricity, kWh %
CHP electricity generation 9.95 100% 5.34 100%
CHP electricity used by the house 9.36 94% 5.23 98%
CHP electricity exported to the grid 0.60 6% 0.11 2%
Demand Account
Total house electricity consumption 21.74 100% 20.72 100%
Electricity supplied by the grid 12.38 57% 15.49 75%
Role of Thermal Storage Interfacing Between CHP and Air Handler
Figures 6b & 7b show how the thermal storage of the BOP receives heat from the CHP unit over longer periods but in small quantities, and delivers that heat to the air handler and hot water devices in shorter but more heat intensive bursts. It is these characteristics that highlight the importance of the storage design. An optimized storage system could probably stretch the operation of the CHP unit into even longer runs, reducing standby losses, while satisfying the air handler’s and hot water system’s needs for energy on their own demand schedules.
Power Quality Analysis
The facility has recorded a range of data relating to power quality of the CHP unit and of the local utility, and this data has been handed to utility experts on the team for their interpretation and analysis. Example graphs and analyses are presented in Appendix C. The following conclusions are drawn from the power quality analysis.
The CHP unit does not seem (from the available information) to impact the grid voltage although we have seen that the current total harmonic distortion, while running, is higher than the accepted DR standards. The reason why there is negligible impact on the grid is basically due to the low power output of the CHP unit itself. At maximum, it fed 700 W on the 240 V circuit. This represents less than 25 % of the electrical power of a typical oven element, which is not very high.
Based of the available data, we do think that a unit having higher power output or the simultaneous use of many units of this type, all connected to the same feeder, could impact the grid voltage power quality.
More data would have been necessary to be more conclusive. Since the shortest duration of operation is around 45 minutes, recording data every 5 minutes would have been preferable. Moreover, having the information on current harmonic content would have helped characterize the power quality of the outputted power. Finally, if another project is undertaken with a CHP unit using electric power devices as the means of interconnection, the DC current component would have to be measured.
6.0 Discussion
This project successfully adapted one of two existing research houses at CCHT to integrate a prototype CHP unit to provide some electricity and heat to the house, and supply surplus electricity back to the grid. The adaptation consisted of electrical
modifications to incorporate a CHP unit to the electrical system, including added wiring, safety switches, electrical panels, metering for the datalogging equipment and power quality meters. Thermal modifications including added components of the BOP: a hot
water storage tank, pumps and piping, and controls, which were integrated with an existing water heater and air handler that had been adapted to supply both space and water heating to the house in a previous project. These modifications also included extensive monitoring upgrades to the existing systems in the CCHT houses, to capture key performance indicators. All of these were documented in this final report, and address the other key objectives of the study - providing valuable information to CHP manufacturers and researchers alike.
Some of the issues addressed but not necessarily resolved over the course of this study included:
• The variability in acceptance by local utilities across Canada of the concept of feeding electricity back to the grid on a micro level. (This was not a problem in our jurisdiction as the NRC campus already has a co-generation plant in
operation).
• The cost of electrical modifications for an actual house (as opposed to our test house) – estimated to be of the order of $2k to $3k.
• The need by the Canadian Electrical Code of an ‘external, weatherproof, lockable disconnect’ to allow the power utility to manually disconnect the CHP from the grid during periods of power failure and repair. This requirement is to protect linesmen from uncontrolled sources of power to the grid during line repair. This feature was included in our design, but the 200 amp service originally installed to give us flexibility for growth of the electrical system necessitated a more robust and expensive disconnect than may normally be required.
• The cost of the CHP unit itself – ours was $12k US for the prototype unit. Current models cost approximately $7.5k US.
• Issues relating to reliability, durability, and value of the electricity generated were discussed within the context of ‘return on investment’ or ‘payback’, but these were not examined in detail.
• The long warm-up period for the CHP unit to start generating electricity after shutdown (e.g. about 30 minutes).
• The design and control of the Balance of Plant (for heat storage and distribution) to minimize shutdown of the CHP, and maximize the overall efficiency of that part of the system.
• The role of a heat-driven CHP unit in the summer, when the thermal load is small and the BOP heat losses to the house are relatively high.
• Whether or not a backup burner (in the form of a water heater in our case) was needed to address all space and water heating loads of the house.
The Whisper Tech CHP was used to demonstrate the CHP testing and monitoring capability of the converted CCHT houses. While the testing of the Whisper Tech itself was not intended to be exhaustive, the performance of the Whisper Tech CHP during the demonstration suggests that the system has promise and merits follow-up work to address the above issues.
7.0 Conclusion
The primary objective of this demonstration project was to develop and demonstrate a test facility at the CCHT with the capability to assess residential CHP systems and their integration into houses, under real-world conditions. This objective has been met: with the modifications to its electrical and thermal installations, combined with the monitoring and data analysis techniques demonstrated in this project, the CCHT test house now has a proven track record that clearly demonstrates that this facility is ready to test a range of combined heat and power systems in residential application, including fuel cells, and can deliver very useful performance information on the CHP unit and its related sub-systems. Some of the proven features include: the bi-directional grid connection including wiring and switches, power meters and power quality meters.
The second objective was to quantify the performance of an early residential CHP system (Stirling engine based) and to begin to examine building integration issues such as
HVAC interface, storage, control, and CHP system sizing. This objective has also been met over the course of the project. The BOP, controls and data collection have
performed as expected and provided a good base for tests and evaluations of overall CHP performance. The efficiencies of the CHP unit, the BOP, and the System were all
quantified for a range of conditions and good functional relationships were developed that describe the performance of this system over a broad range of conditions. The complementary analytic techniques developed over the course of the study shed some light on the role of system sizing and storage size. Both of these factors were shown to affect duty cycle and standby times, the latter being identified as a major component of the BOP inefficiency.
The CHP unit was shown to compare favourably with the efficiency of domestic water heaters, while generating by-product electricity. These efficiencies could be improved with optimized balance of plant design.
Finally, this project was designed to gather information and develop experience in installing, commissioning, monitoring and analyzing the performance of residential cogeneration systems in houses. The information and experience reported in this project and shared with the Steering Committee members has fulfilled that objective.
References
1. Swinton, M.C.; Moussa, H.; Marchand, R.G. "Commissioning twin houses for assessing the performance of energy conserving technologies," Performance of Exterior Envelopes of Whole Buildings VIII Integration of Building Envelopes (Clearwater, Florida, Dec, 2001), pp. 1-10, 2001 (NRCC-44995).
2. Swinton, M.C.; Entchev, E.; Szadkowski, F.; Marchand, R.G. "Benchmarking twin houses and assessment of the energy performance of two gas combo heating systems," 9th Canadian Conference on Building Science and Technology (Vancouver, B.C. 2003-02-27), pp. 365-381, Feb, 2003 (NRCC-38459). http://irc.nrc-cnrc.gc.ca/fulltext/nrcc38459/
3. Natural Resources Canada (prepared by Natural gas Technology Centre-Boucherville, QC), “Evaluation of Whisper Tech Ltd Personal Power Station-WhisperGen.” December 2001.
APPENDIX A - Definitions and Terminology
System & Balance of Plant (BOP)
• The System consists of:
– the WhisperGen (WG) CHP unit and, – the Balance of Plant (BOP)
• The Balance of Plant (BOP) consists of: – the Storage Tank (ST),
– the Hot Water Tank (HWT), – the Air Handler (AH), and – 3 Pumps and a Mixing Valve.
Runs
A run is a more or less arbitrary division in time. Some runs were defined by a change from one setup to another, and some by the CHP unit failures, but others (3 & 4, 7, 8 & 9, and 20, 21 & 22) were separated to give more data points under different weather
conditions
Setups
Recall that the heat storage and related control operates in either of two set-up configurations (see Figure to help visualize):
Setup 1: The storage tank ST is used as a supplementary heater to the hot water tank (HWT) (warm water in storage circulated to HWT, and cooler HWT water back to storage. HWT gets the fresh water supply)
Setup 2: ST is in series with the HWT(hot water from the hot water storage tank circulated to HWT and then to space heat load and back to ST, or to water heating, with fresh water into ST)
In both configurations, the WhisperGen CHP is the heating source to the storage (ST), with a closed loop and heat exchangers linking the CHP to the storage.
Calculation of Efficiencies
The system consists of two components or subsystems: the CHP and the BOP. CHP Unit Efficiencies
• The CHP has 1 input & 3 outputs: o Input: Natural gas to the CHP
o Outputs: Heat to the BOP, Net electricity, and Losses.
Electrical Efficiencychp = Net CHP Electricity / CHP Nat Gas Thermal Efficiencychp = Heat to BOP / CHP Nat Gas
Total Efficiencychp = Electrical Efficiency + Thermal Efficiency
= (Net CHP Electricity + Heat to BOP) / CHP Nat Gas Balance of Plant Efficiency
• The BOP has 3 inputs, 3 outputs & 2 stores:
o Inputs: Heat from the CHP, Natural gas to HWT, and Pump Energy. o Outputs: Heat to space heat, Heat to hot water, and Losses.
o Stores: The Storage Tank and the Water Heater
(Note: Inputs and release from storage are negative, outputs and storage of heat are positive).
BOP Efficiency = (Heat to Space Heat + Heat to Hot Water + Positive Storage) (Heat from CHP + HWT Nat Gas + Pump Energy)
Total System Efficiency
• The System has 3 inputs, 5 outputs and 2 stores:
o Outputs: Net CHP Electricity, Heat to Space Heat, Heat to Hot Water, Losses from CHP, and Losses from BOP.
o Stores: The Storage Tank and the Water Heater.
System Efficiency = (Net CHP Electricity + Heat to Space Heat + Heat to Hot Water + Positive Storage) (CHP Nat Gas + HWT Nat Gas + Pump Energy)
APPENDIX B – Electrical Drawings
M1 B A N 200A SPACE SPACE GARAGE PANEL #2 15A.,1P. 40A.,2P. 3 40A.,2P. 1 2 SPACE SPACE BLOWN PLATE PANEL #3 BLOWN PLATE 200A A N B 200A PANEL A PANEL #1 A B N INFORMATION CENTRE FOR FUTURE CONNECTION OPENER/LIGHTS SPACE HOUSE LOAD 200A SPLITTER 100A A BN 200A A BN POWER QUALITY MONITOR 120/240V 120/240V UPS
0 OCT/02 ISSUED FOR TENDER K.L.
2A 37.5KVA
I21 I11 I41 (LIME/YELLOW) V.REF V2 V1 (YELLOW) (ORANGE) (ORANGE) (YELLOW) (LIME/YELLOW) L/+ N/-L1 N L1 N * * * (W HI TE ) * * * M1 B A N 200A SPACE SPACE GARAGE PANEL #2 15A.,1P. 40A.,2P. 3 40A.,2P. 1 2 SPACE SPACE BLOWN PLATE PANEL #3 BLOWN PLATE A N B PANEL A PANEL #1 A B INFORMATION OPENER/LIGHTS SPACE HOUSE LOAD 200A SPLITTER 100A A BN 200A A B N 120/240V 120/240V MONITOR POWER QUALITY CENTRE (GRID) A N A B M3 KWH KWH KWH M4 M2 KWH ELECTRICAL NOTES 1. EXISTING ELECTRICAL EQUIPMENT & WIRING TO BE REMAINED.
2. PROVIDE NEW ELECTRICAL EQUIPMENT AS SHOWN. 3. PROVIDE NEW ELECTRICAL WIRING AS SHOWN. 4. PROVIDE ONE NEW 4-POLE DOUBLE THROW SWITCH FOR HOUSE B.
5. NEW 4-POLE DOUBLE THROW SWITCH SUPPLIED BY NRC FOR HOUSE C. ELECTRICAL CONTRACTOR TO INSTALL.
6. EQUIPMENT PROVIDED BY OTHERS.
7. RELOCATE EXISTING CT INTO SPLITTER. ELECTRICAL CONTRACTOR TO PROVIDE WRING & CONNECTIONS. 8. SCHEMATIC IS SHOWN FOR ONE HOUSE ONLY. PROJECT INVOLVES CHANGES TO BOTH HOUSES.
9. NEUTRAL LUGS IN ALL ELECTRICAL EQUIPMENT TO BE UNGROUNDED. S4 S3 SWITCH TRANSFER 4-POLE
HYDRO GRID AND GENERATOR HYDRO GRID ONLY CT S1 S3 200A,240V 20A,H.R.C 3 #3/0 RW90 + GND JB 3 #3/0 RW90 + GND 100:5 B UPS ~ 2A B A N 4 5 1 1 1 1 1 1 2 3 2 3 #3/0 RW90 3 3 #3/0 RW90 + GND 3 3 2 1 2 1 1 2 3 #3/0 TECK + GND 10" X 10" 3 7 CT 100:5 LM2 CSA ENCL. 3 CSA ENCL. 3 LM2 2 LM2 CSA ENCL. 3 + GND IN 2" EMT 2A 1 CUTLER-HAMMER LM2 CSA ENCL. 3 CUTLER-HAMMER FROM CUTLER-HAMMER 37.5KVA IN 2" EMT IN 2" EMT CUTLER-HAMMER FUSE FUSE 1
0 OCT/02ISSUED FOR TENDER K.L.
200A 2 S5 PADLOCKABLE SWITCH 2P WEATHERPROOF ON BUILDING EXTERIOR 3 #3/0 TECK +GND 3 3 #3/0 TECK +GND 1 QUALITY POWER MONITOR 1 UPS ~ FROM WHISPER GEN IN 2" EMT 2#12 NMD MAR/03 1 AS BUILTS K.L. I12 I22 I4 2 I41 I21 I11 V.R E F V2 V1 (R E D ) (B L A CK ) (YELLO W) (O RA NG E ) (L IME/YELLO W) (L IM E/YELLO W) (O RA NG E ) (YELLO W) L/+ N/ -I42 I12 I22
APPENDIX C – Power Quality Metering: Outputs and
Analysis
List of Power Quality Meter Outputs for Consideration
# Parameters Paramètres
1 Power Factor Facteur de puissance
2 Voltage transients
(These could trigger disconnecting the unit if protective relays are used)
Transitoires de tension (événements). (Responsable de la déconnexion de
l'équipement de production si des fonctions ou relais de protection sont utilisés)
3 Sag, swell, and frequency variation (RMS)
Variations de fréquence et tension RMS
4 Voltage Harmonics – THD, single harmonic amplitudes (2nd to 30th minimum and electric phase angle if available).
Harmoniques de tension - THD et amplitude (phase si disponible)
Des harmoniques individuelles k=2 à 30 minimum, la distortion en tension (réseau) peut influencer le comportement de l'alternateur
5 KW, KVAR, KVA KW, KVAR, KVA (mesures de puissances)
6 Voltage and current waveform : Snapshots during special events
Forme de l'onde : Information sur la forme de tension / courant lors d'événements spéciaux 7 Flicker – if available
(Flicker is a visual irritant
manifested in lighting intensity, due to variations in voltage.)
Papillotement - si disponible. (Le papillotement est une mesure de
l'irritation visuelle que génère la variation de l'intensité lumineuse lors de variations de la tension. Cette variation de tension peut être créée par le démarrage-arrêt de charges électriques ou d'unités de production électriques.)
8 Current Harmonics - THD, single harmonic amplitudes (2nd to 30th minimum and electric phase angle if available).
Harmoniques de courant - THD et amplitude (phase si disponible)
Des harmoniques individuelles k=1 à 30 minimum, la distortion en tension (réseau) peut influencer le comportement de l'alternateur
Total Harmonic Distortion 0 1 2 3 4 5 6
15-Mar-03 20-Mar-03 25-Mar-03 30-Mar-03 04-Apr-03 09-Apr-03 14-Apr-03 19-Apr-03 24-Apr-03
Date and time
TH
D
V1 THD high V2 THD high
Power factor of CHP Unit
0 10 20 30 40 50 60 70 80 90 100 3-31-03 12:00 PM 4-1-03 12:00 AM 4-1-03 12:00 PM 4-2-03 12:00 AM 4-2-03 12:00 PM 4-3-03 12:00 AM 4-3-03 12:00 PM
PF lag mean PF lead mean
Power Quality evaluation Eric Le Courtois, ing. M. Sc. A.
Hydro-Québec Analysis: Evaluation of Power Quality Data in
the Development of Micro Combined Heat and Power
Technology Assessment Capability at the Canadian Centre for
Housing Technology
Output power and voltage distortion (impact on voltage
distortion)
Measurements
Output power and mean voltage THD
-200 -100 0 100 200 300 400 500 600 700 800
2003-mars-24 12:00:00.000 2003-mars-25 00:00:00.000 2003-mars-25 12:00:00.000 2003-mars-26 00:00:00.000 time Power (W) -0.4 -0.2 0 0.2 0.4 0.6 0.8 1 1.2 1.4 1.6 voltage THD (%) Output power (W) mean voltage THD phase 1 mean voltage THD phase 2
Power Quality evaluation Eric Le Courtois, ing. M. Sc. A. Output power and mean voltage THD
-200 -100 0 100 200 300 400 500 600 700 800
2003-mars-25 16:48:00.000 2003-mars-25 21:36:00.000 2003-mars-26 02:24:00.000 2003-mars-26 07:12:00.000 time Power (W) -0.4 -0.2 0 0.2 0.4 0.6 0.8 1 1.2 1.4 1.6 voltage THD (%) output power (W) mean voltage THD phase 1 mean voltage thd phase 2
Figure 2 2003-03-25 (15:30) to 2003-03-26 (15:30)
Output power and voltage THD
-200 -100 0 100 200 300 400 500 600 700 800 2003-avr-01 07:12:00.000 2003-avr-01 12:00:00.000 2003-avr-01 16:48:00.000 2003-avr-01 21:36:00.000 2003-avr-02 02:24:00.000 2003-avr-02 07:12:00.000 2003-avr-02 12:00:00.000 time power (W) -0.4 -0.2 0 0.2 0.4 0.6 0.8 1 1.2 1.4 1.6 voltage THD (%) W tot mean
mean voltage THD phase 1 mean voltage THD phase 2
(current measurement inversed…)
Power Quality evaluation Eric Le Courtois, ing. M. Sc. A.
power output and voltage THD
-200 -100 0 100 200 300 400 500 600 700 800 2003-avr-19 07:12:00.000 2003-avr-19 16:48:00.000 2003-avr-20 02:24:00.000 2003-avr-20 12:00:00.000 2003-avr-20 21:36:00.000 2003-avr-21 07:12:00.000 time power (W) -0.4 -0.2 0 0.2 0.4 0.6 0.8 1 1.2 1.4 1.6 voltage THD (%) output power (W) mean voltage THD mean voltage THD phase 2
Figure 4 2003-04-19 (11:00) to 2003-04-21 (08:00)
output power and voltage THD
-200 -100 0 100 200 300 400 500 600 700 800 2003-mai-08 12:00:00.000 2003-mai-09 00:00:00.000 2003-mai-09 12:00:00.000 2003-mai-10 00:00:00.000 2003-mai-10 12:00:00.000 time power (W) -0.4 -0.2 0 0.2 0.4 0.6 0.8 1 1.2 1.4 1.6 voltage THD (%) power (W)
mean voltage THD phase 1 mean voltage THD phase 2
Power Quality evaluation Eric Le Courtois, ing. M. Sc. A.
Output power and voltage THD
-200 -100 0 100 200 300 400 500 600 700 800 2003-juin-04 12:00:00.000 2003-juin-04 21:36:00.000 2003-juin-05 07:12:00.000 2003-juin-05 16:48:00.000 2003-juin-06 02:24:00.000 time power ( W ) -0.4 -0.2 0 0.2 0.4 0.6 0.8 1 1.2 1.4 1.6 vol tage THD (%) power (W)
mean voltage THD phase 1 mean voltage THD phase 2
Figure 6 2003-06-04 (09:00) to 2003-06-06 (09:00)
Conclusions on voltage THD
1) Operating duration varies from around 45 minutes to 3h 15 minutes. 2) Power output : 1 point every 15 minutes.
3) Voltage THD : 1 point every hour.
4) Not enough measurements during operating conditions to be sure of impact. 5) As much as it is possible to see, the WhisperGen doesn't seem to impact the
Power Quality evaluation Eric Le Courtois, ing. M. Sc. A.
Output power and current distortion (current distortion while
running)
Measurements
output power and current THD
-200 -100 0 100 200 300 400 500 600 700 800
2003-mars-24 12:00:00.000 2003-mars-24 21:36:00.000 2003-mars-25 07:12:00.000 2003-mars-25 16:48:00.000 time power (W) -40 -20 0 20 40 60 80 100 120 140 160 mean current THD (%) output power
mean current THD phase 1 mean current THD phase 2
Power Quality evaluation Eric Le Courtois, ing. M. Sc. A.
output power and current THD
-200 -100 0 100 200 300 400 500 600 700 800
2003-mars-25 16:48:00.000 2003-mars-25 21:36:00.000 2003-mars-26 02:24:00.000 2003-mars-26 07:12:00.000 time power (W) -40 -20 0 20 40 60 80 100 120 140 160 mean current THD (%) output power (W) mean current THD phase 1 mean current THD phase 2
Figure 8 2003-03-25 (15:30) to 2003-03-26 (15:30)
output power and current THD
-200 -100 0 100 200 300 400 500 600 700 800 2003-avr-01 09:36:00.000 2003-avr-01 14:24:00.000 2003-avr-01 19:12:00.000 2003-avr-02 00:00:00.000 2003-avr-02 04:48:00.000 2003-avr-02 09:36:00.000 time power (W) -40 -20 0 20 40 60 80 100 120 140 160 mean current THD (%) output power
meran current THD phase 1 mean current THD phase 2
(reversed current measurement)
Power Quality evaluation Eric Le Courtois, ing. M. Sc. A.
output power and current THD
-200 -100 0 100 200 300 400 500 600 700 800 2003-avr-19 09:36:00.000 2003-avr-19 19:12:00.000 2003-avr-20 04:48:00.000 2003-avr-20 14:24:00.000 2003-avr-21 00:00:00.000 2003-avr-21 09:36:00.000 time power (W) -40 -20 0 20 40 60 80 100 120 140 160 mean current THD (%) output power
mean current THD phase 1 mean current THD phase 2
Figure 10 2003-04-19 (11:00) to 2003-04-21 (08:00)
power output and current THD
-200 -100 0 100 200 300 400 500 600 700 800 2003-mai-08 14:24:00.000 2003-mai-09 00:00:00.000 2003-mai-09 09:36:00.000 2003-mai-09 19:12:00.000 2003-mai-10 04:48:00.000 time power (W) -40 -20 0 20 40 60 80 100 120 140 160 mean current THD (%) output power
mean current THD phase 1 mean current THD phase 2
Power Quality evaluation Eric Le Courtois, ing. M. Sc. A.
output power and current THD
-200 -100 0 100 200 300 400 500 600 700 800 2003-juin-04 12:00:00.000 2003-juin-04 21:36:00.000 2003-juin-05 07:12:00.000 2003-juin-05 16:48:00.000 2003-juin-06 02:24:00.000 time power (W) -40 -20 0 20 40 60 80 100 120 140 160 mean current THD (%) output power
mean current THD phase 1 mean current THD phase 2
Figure 12 2003-06-04 (09:00) to 2003-06-06 (09:00)
Conclusions on current THD
1) Operating duration varies from around 45 minutes to 3h 15 minutes. 2) Power output : 1 point every 15 minutes.
3) Current THD : 1 point every hour.
4) Not enough measurements during operating conditions to be sure of impact. 5) When the unit is in standby, the THD levels don't mean anything since the RMS
current amplitude is very low and it should not be taken into account since the impact is also very low.
6) IEEE P1547 standard and IEEE 519 recommended practice state that a DR should limit its current THD to 5 % when measured in regard to nominal current. For the WhisperGen, nominal output power is around 700 W (electric). At 700 W, the measured THD seem to stand around 12 %, which is higher than what is specified by the standards.
7) There is no measurement on single harmonics amplitudes and electrical phase angles so it is hard to evaluate the reason for such high harmonic THD.
Waveform
One waveform (voltage/current) has been captured by the ION while the DR was outputting power. It is presented in Figure 13.