Publisher’s version / Version de l'éditeur:
Applied Acoustics, 63, December 12, pp. 1353-1374, 2002-12-01
READ THESE TERMS AND CONDITIONS CAREFULLY BEFORE USING THIS WEBSITE.
https://nrc-publications.canada.ca/eng/copyright
Vous avez des questions? Nous pouvons vous aider. Pour communiquer directement avec un auteur, consultez la
première page de la revue dans laquelle son article a été publié afin de trouver ses coordonnées. Si vous n’arrivez pas à les repérer, communiquez avec nous à [email protected].
Questions? Contact the NRC Publications Archive team at
[email protected]. If you wish to email the authors directly, please see the first page of the publication for their contact information.
NRC Publications Archive
Archives des publications du CNRC
This publication could be one of several versions: author’s original, accepted manuscript or the publisher’s version. / La version de cette publication peut être l’une des suivantes : la version prépublication de l’auteur, la version acceptée du manuscrit ou la version de l’éditeur.
For the publisher’s version, please access the DOI link below./ Pour consulter la version de l’éditeur, utilisez le lien DOI ci-dessous.
https://doi.org/10.1016/S0003-682X(02)00035-X
Access and use of this website and the material on it are subject to the Terms and Conditions set forth at
Sound propagation between two adjacent rectangular workstations in
an open-plan office. II: Effects of office variables
Wang, C.; Bradley, J. S.
https://publications-cnrc.canada.ca/fra/droits
L’accès à ce site Web et l’utilisation de son contenu sont assujettis aux conditions présentées dans le site LISEZ CES CONDITIONS ATTENTIVEMENT AVANT D’UTILISER CE SITE WEB.
NRC Publications Record / Notice d'Archives des publications de CNRC:
https://nrc-publications.canada.ca/eng/view/object/?id=c68054d9-a3e2-43b1-b8bc-7f7dcd9812ed https://publications-cnrc.canada.ca/fra/voir/objet/?id=c68054d9-a3e2-43b1-b8bc-7f7dcd9812ed
Sound propagation between two adjacent rectangular workstations in an open-plan office. II: Effects of office variables
Wang, C.; Bradley, J.S.
NRCC-46315
A version of this document is published in / Une version de ce document se trouve dan Applied Acoustics, v. 63, no. 12, Dec. 2002, pp. 1353-1374
Sound Propagation between Two Adjacent
Rectangular Workstations in an Open-plan Office,
II: Effects of Office Variables
C. Wang∗ and J. S. BradleyAcoustics Laboratory, Institute for Research in Construction National Research Council Canada, Ottawa, ONT, K1A 0R6, Canada
Abstract
In part one of this paper a general model was developed of sound propagation between adjacent rectangular workstations in a conventional open-plan office. In this paper, the new model is used to investigate the importance of various office design parameters on calculated speech privacy. The additional effects of the side and back panels of complete workstations are examined in detail. Calculations for systematic variations of the principal design parameters show that the separating screen height and the ceiling absorption have the largest effects on expected speech privacy. High speech privacy can only be achieved with the combination of high screens, high ceiling absorption, and high panel absorption. Empirical corrections are developed to estimate how the presence of ceiling lights reduces the effective ceiling absorption. The complete model is shown to accurately predict speech privacy for a range of office design configurations with an RMS error in predicted SII values 0.02.
∗ Current address: Milford Proving Ground, General Motors Corp., Mail Code: 483-394-201, Milford, MI48380, USA.
1. Introduction
Adequate speech privacy has long been considered the critical acoustical design goal for conventional open-plan offices. The design of an open-plan office for adequate speech privacy involves estimating the amount of intruding speech sounds from adjacent workstations. The propagation of speech sounds between workstations is influenced by many variables, including: the screen and ceiling heights, the sound absorption of the ceiling, floor, and screens, as well as the workstation size, and orientation. It is difficult to obtain adequate speech privacy in open plan offices without the optimization of all of the important design parameters. The margin of error between just good enough and unacceptable is very small. Consequently a successful design procedure must be quite accurate. Simple empirical approaches that do not specifically include the influences of each parameter will usually be inadequate. For example, the empirical procedure in ISO17624[1] was shown to be no better than a rough estimate of actual measured attenuations[2].
By examining single screens in an office, Moreland[3] found that various office parameters interact in a complex manner to produce a given level of speech privacy. In an attempt to incorporate all of these office parameters into a mathematical model for open-office design, Moreland[4] developed a linear regression model for obtaining a global view of office variables affecting the Articulation Index (AI)[5]. The standard error of his estimation of AI values was 0.095[2]. However as pointed out by Moreland[4], since the relationship between the office variables and the AI are not necessarily linear, nor can they necessarily be transformed to linear relationships, the regression model may not be of sufficient accuracy for critical applications. Also such regression models are always limited by the range of the input variables included in the measurements and hence may not be generally representative.
Recently, the authors developed a general mathematical model, which considers all major office variables, for a single screen in an open-plan office including ceiling and floor reflections[6]. The model uses the Maekawa screen diffraction results and represents floor and ceiling reflections using an image source technique. The model also included an empirical correction of measured diffuse field ceiling absorption coefficients to values representative of the effective absorption of the ceiling in an open plan office. This model was successfully applied to predicting the Speech Intelligibility Index (SII)[7],
(which is the newer replacement of the AI[5]), behind a single screen in an open-plan office with an RMS error of 0.03[8]. Subsequently, an extended mathematical model for the sound propagation between two adjacent rectangular workstations was developed[2], in which the effects of the side and back panels of a workstation were also included. Again reflections were represented using an image source technique. Only first-order reflection effects were considered[2] because designs for satisfactory speech privacy require screens to be sound absorbing and in these cases higher order reflection effects were assumed to be very small. This model was validated by comparisons with measurements of sound attenuation between pairs of workstations and shown to be quite accurate.
This paper reports on the results of further investigations of the acoustical properties of workstations using this new model[2]. The contribution of the side and back panels of workstations and the orientation of openings to sound propagation between adjacent rectangular workstations is first examined. Then the influences of various office parameters on calculated SII values are systematically examined. To facilitate the use of the model in practical situations, the effects of light fixtures in the ceiling are investigated experimentally and incorporated into the model as empirical corrections. The complete model is then validated with respect to measurements of sound attenuations between a range of different pairs of workstations.
2. Effects of the Side and Back Panels
Source Receiver
d
l
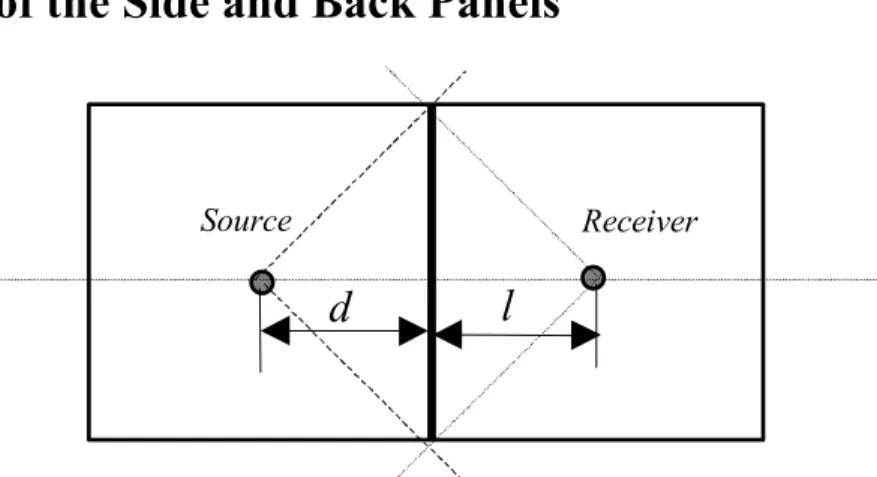
Figure 1. Plan of two adjacent rectangular workstations
In this section, the effects of the side and back panels, including the absorption of these panels, the workstation size, and workstation orientation are discussed in terms of the results of calculations using the model. In the calculations, it is assumed, unless otherwise specified, that: the plan of each of two adjacent workstations is 2.74 m Х 2.74 m; the screen height is 1.52 m; and the ceiling height, H, is 2.74 m. For convenience, the source and the receiver are assumed to be 1.22 m high and always at the centre of the workstations. Except for discussing the workstation orientation, the workstations are assumed to be a closed ‘fence’ (partial height screens) without openings, as shown in Figure 1. To see the differences relative to a single screen more clearly, the effects are described in terms of the increase of the sound pressure level at the receiving point compared to the results for a single dividing screen in an open-plan office. That is, these results show only the incremental effect of adding side and/or back panels to the workstation.
In [2], it was shown that the image sources directly associated with side panels on the source side only affect the receiving points in the region l<d, while those associated with the side panels on the receiving side affect the points in the region l>d. That is, for these conditions, reflections from the side panels are geometrically possible. Here d and
l are the distances of the source and receiver from the screen respectively as shown in
Figure 1. However, it should be mentioned that this demarcation is not rigorous because the condition was derived by assuming that the sound behaves as simple rays. In the calculations of this section the source and receiver are at the centre of each workstation, and l=d. For this condition, the side panels on both the source and the receiving sides should have some effect. Therefore, the estimation using the equations derived either for
the source side or the receiving side at this point may not be accurate[2]. However, by assuming that sound pressure level changes continuously around l=d, the effects of the side panels at the position l=d can be calculated by averaging the results obtained at two nearby positions along the centre line of the workstation. In this Section, the two nearby positions are chosen to be at 0.305 m away from the point l=d.
2.1 Effects of side panels
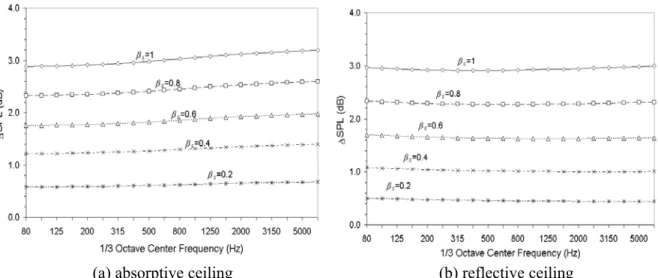
Figure 2 shows the increase of the sound pressure level, compared to the single-screen results, due to the side panels of both the source and the receiver sides for both source and receiver at the centre of each workstation. Since the ceiling reflection is an important factor affecting the sound propagation between workstations[8], the two cases in which the ceiling is highly absorptive and highly reflective, are discussed here. These results include variations of the reflection coefficients of: the floor βf, the ceiling βc, and
the screens βs. It can be seen that generally the effects of the side panels increase as the
sound reflection coefficients of the side panels increase. This result is expected because the more reflective the side panels, the more sound energy will go over the dividing screen to the receiving point. However, depending on the ceiling absorption, the maximum increment of the sound pressure level at the receiving point is about 4 dB for the highly absorptive ceiling case and 2 dB for the highly reflective ceiling case. This is because when the ceiling is highly reflective, more sound energy would reflect over the dividing screen from the ceiling to the receiving point directly. As a result, the sound reflection due to the side panels becomes relatively less important.
(a) absorptive ceiling (b) reflective ceiling Figure 2. The increment of the sound pressure level at the receiving point due to side
panels on both source and receiving sides for varied panel reflection coefficient βs with a
2.2 Effects of the back panel
The effects of the back panels may depend on the existence of side panels[2]. Therefore, the increment of the sound pressure level due to the back panels, compared to the results of a layout with a dividing screen and side panels, is first shown in Figure 3. It is seen that the maximum increment is about 3 dB for either the highly absorptive or the highly reflective ceiling situations. This result indicates that for two adjacent workstations, a reduction of a maximum of 3 dB in the sound pressure level at the receiving point can be obtained if the back panels on both sides are made completely absorptive. Note that the results shown in Figure 3 include the effects of the back panels on both the source side and the receiving side. It is assumed that the two back panels contribute equally to the effects because the layout is symmetrical.
(a) absorptive ceiling (b) reflective ceiling
Figure 3. The increment of the sound pressure level at the receiving point due to back panels for varied panel reflection coefficient βs: (a) βf=1; βc=0, (b) βf=1; βc=1.
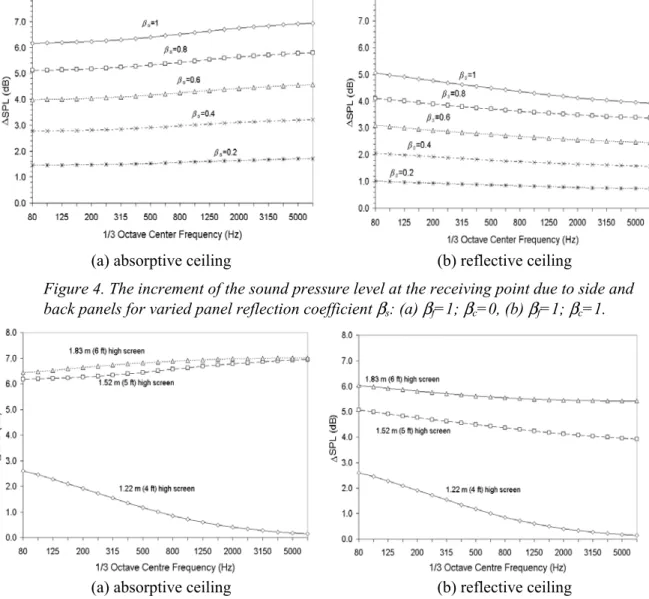
In order to have an overview of the effects of the side and back panels, the increase of the sound pressure levels, due to the back and side panels, compared to the results of a single screen, are shown in Figure 4. The maximum increment is about 6 to 7 dB for the highly absorptive ceiling and 4 to 5 dB for the highly reflective ceiling. These results actually can be obtained by summing the corresponding results shown in Figure 2 and Figure 3. From these figures, it is seen that when all the panels are highly absorptive, the effects of the side and back panels can be neglected, and therefore the single-screen results[8] should apply directly. This indicates that in addition to a highly absorptive ceiling, highly absorptive side panels are also important to the speech privacy in an open-plan office.
(a) absorptive ceiling (b) reflective ceiling
Figure 4. The increment of the sound pressure level at the receiving point due to side and back panels for varied panel reflection coefficient βs: (a) βf=1; βc=0, (b) βf=1; βc=1.
(a) absorptive ceiling (b) reflective ceiling
Figure 5. The increment of the sound pressure level at the receiving point due to side and back panels for varied screen height: βs=1, (a) βf=1; βc=0; (b) βf=1; βc=1.
It should be noted that in the discussions above, the screen height was fixed at 1.52 m. To examine the influence of the screen height, Figure 5 shows the maximum increment of the sound pressure level for varied screen height. It is seen that the higher the screen, the larger the increment of the sound pressure level at the receiving point. However, when the ceiling is highly absorptive, the variation of this increment as the screen height changes from 1.52 m to 1.83 m is very small. This indicates that the reduction of the directly diffracted energy is apparently compensated for by increased reflected and diffracted energy so that in total there is little change. There is an apparent trade off between decreased indirectly diffracted sound and increased reflected and diffracted sound energy. When the ceiling is highly reflective, the corresponding variation is about 1 dB. Although as for the absorbing ceiling case, the higher screen may not increase the total diffracted sound passing over the dividing screen, it would reflect more sound
energy to the ceiling and then to the receiving point. This again shows that the ceiling absorption is very important to speech propagation between workstations.
In Figure 5, the results for the 1.22 m high screen are much lower than those for the 1.52 m and 1.83 m screens. For this case the source and the receiver are at the same height as the screen top, and the effective height of all panels is zero[8]. (Effective height is the height of the screen relative to the source height). As a result, sound reflections from the side and back panels are not so important compared with the sound energy going directly over the dividing screen.
2.3 Effects of the workstation size
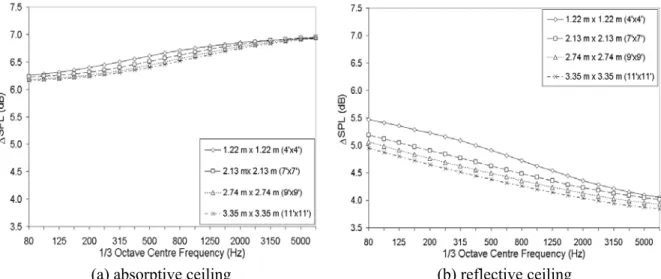
In Figure 6, the maximum increment of the sound pressure level due to the side and back panels is shown as a function of workstation size. It is seen, that the smaller the workstation size, the more sound energy passes over the dividing screen to the receiver. However in either case, i.e. highly absorptive or highly reflective ceiling, the variation of this increment with workstation size is less than 0.5 dB. Thus even for this large range of workstation sizes (1.22m by 1.22 m to 3.35m by 3.35m), the incremental effects of workstation size on the effects of these panels is very small. Note that when a workstation gets smaller, the source and receiver would get closer together and to the dividing screen. Generally, larger workstations lead to higher speech privacy than smaller workstations. This is simply because the sound pressure level received by the receiver is lower in larger sized workstations due to the longer propagation distances.
It should be pointed out here that it is not always appropriate to discuss the acoustic behavior of a workstation in terms of insertion loss because this can indicate miss-leading improvements in speech privacy. For example, small workstations may have higher insertion loss (i.e., the difference in the sound pressure level at the receiving point with and without the workstation present) because the source and receiver are closer to the dividing screen[8]. However, because of the shorter distances between source and receiver the sound pressure level at the receiver will be higher in small workstations and the speech privacy would tend to be lower than for larger workstations.
(a) absorptive ceiling (b) reflective ceiling
Figure 6. The increment of the sound pressure level at the receiving point due to side and back panels for varied workstation size: βs=1, (a) βf=1; βc=0; (b) βf=1; βc=1.
2.4 Workstation orientation
In the discussions above, each workstation was assumed to be a closed rectangular ‘fence’ (partial height screens), and the orientation of the workstation openings was not considered. In this section, the effect of the orientation is discussed by examining the increment of the sound pressure level when an opening is introduced. It should be pointed out here that as shown in [2], the effects of the workstation orientation not only depend on the position of the opening but also depend on the opening size D. Obviously, it is not possible to examine all of the possible combinations here. In this section, by assuming an opening width D=0.91 m, only the three cases discussed in [2] and shown in Figure 7, are investigated.
D D D (a) (b) (c)
Figure 7. Different workstation configurations: D, the opening size.
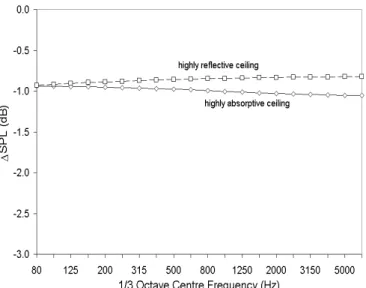
Figure 8 shows the results for configuration (a) (of Figure 7). It can be seen that with the opening in the back panel, the sound pressure level at the receiving point decreases by about 1 dB for both the highly absorptive and the reflective ceiling cases. Note that the workstation layout studied is symmetrical. Each opening can be assumed to have about a 0.5 dB effect at the receiving point. Presumably, this number would increase with the
opening width D. However according to Figure 3, it is expected that the maximum effect wouldn’t be more than 1.5 dB for each of the two openings.
Figure 8. The increment of the sound pressure level at the receiving point
due to the opening in the back panels (configuration (a)): βs=1, βf=1.
For configuration (b) of Figure 7, however, there are no image sources or image receiving points that should be ignored in the calculation when the openings are added[2]. This therefore means that the openings in configuration (b) do not affect the calculated speech propagation between the two workstations.
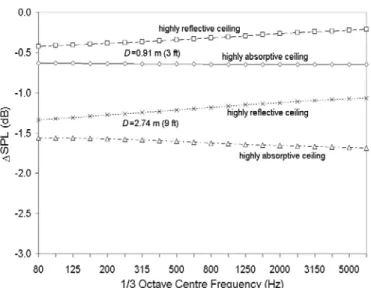
Figure 9 shows the results for configuration (c). When the opening width D is 0.91 m, the sound pressure level at the receiving point decreases by about 0.4 dB for a highly reflective ceiling, and 0.7 dB for a highly absorptive ceiling. When the opening size is increased to 2.74 m, the corresponding decreases in the sound pressure level become 1.2 dB and 1.6 dB respectively. Although these effects appear to be quite small, for configuration (c) additional sound energy would also reach the receiving point by diffraction around the vertical edge at the two adjacent openings.
Figure 9. The increment of the sound pressure level at the receiving point for configuration (c) due to the openings in the side panels: βs=1, βf=1.
3. Calculation examples
In order to have a more general understanding of the variations of speech privacy with changes to various workstation parameters, a series of demonstration calculations were performed using the model. Speech privacy was measured in terms of the Speech Intelligibility Index (SII)[7]. The parameters that were varied inlcuded: the effective height of the screen, the ceiling, floor, and panel absorption, as well as the workstation size. The results are shown in Figure 10 – 14. In these calculations, the ‘normal’ speech spectrum level included in ANSI S3.5-1997[7] was used as the speech source and an assumed ambient noise equal to an RC40 spectrum were used. For simplicity, the absorption coefficients of the ceiling, floor and the screen were all assumed to be independent of frequency, and the source and the receiver are always at the centre of the workstation. The workstation orientation is assumed to be as in configuration (a) of Figure 7.
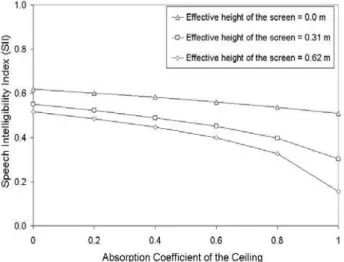
Figure 10. SII versus the ceiling absorption for varied effective height of the workstation panels:
workstation size is 2.74 m x 2.74 m; s=1.22 m, H=2.74 m, βs=0.5, βf=0.5.
It can be seen from Figures 10 and 11 that, as for a single screen in an office[8], ceiling absorption and screen height have the most important influences on SII values. Figure 10 shows that high speech privacy (corresponding to low SII values) only occurs for the highest ceiling tile absorption values and with adequate screen height. Similarly Figure 11 shows that significant increases in privacy (reductions in SII values) only occur with increased screen height and when there is also a highly absorbing ceiling. Thus, the effects of screen height and ceiling absorption interact and it is only with both higher screen heights and highly absorbing ceilings that adequate privacy can be achieved.
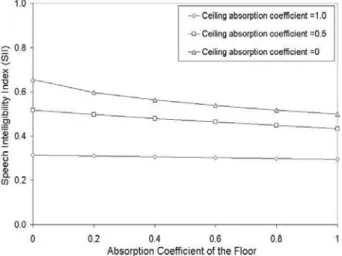
From Figure 12, it can be seen that for complete workstations, floor absorption has a smaller influence on SII values than ceiling absorption. The maximum change in SII values associated with floor absorption is no more than 0.1 and this only occurs when the ceiling is highly reflective. This is similar to the results for a single screen in offices.
Figure 11. SII versus the effective height of the workstation (hef ) for varied ceiling absorption:
workstation size is 2.74 m x 2.74 m; s=1.22 m, H=2.74 m, βs=0.5, βf=0.5.
Figure 12. SII versus the floor absorption for varied ceiling absorption: workstation
size is 2.74 m x 2.74 m; s=1.22 m, h= 1.52 m, H=2.74 m, βs=0.5.
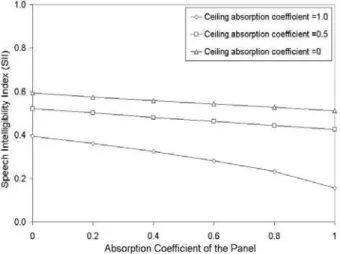
However, due to the existence of the side and back panels, the effect of panel absorption on SII is more significant. According to Figure 13, by changing the panels from highly reflective to highly absorptive, SII can be reduced by 0.1 for a highly reflective ceiling, and 0.2 for a highly absorptive ceiling. Thus the benefits of a highly absorbing ceiling can be compromised by inadequate panel absorption. This again demonstrates the need to have all office parameters near optimum in order to obtain high speech privacy.
From Figure 14, it can be seen that SII decreases as the workstation size increases. This is because with the workstation size increasing, the source and the receiver are getting
further away from each other. Figure 14 shows that when the workstation size varies from 0.91 m x 0.91 m to 4.57 m x 4.57 m, SII decreases by 0.15, almost independent of the ceiling absorption value. Thus larger workstations generally will have better speech privacy than smaller ones. However, for a fixed sized workstation, possible movement of the talker and/or listener are usually limited and the expected influence of the distance between the talker and the listener on SII will then be small.
Figure 13. SII versus the panel absorption for varied ceiling absorption: workstation
size is 2.74 m x 2.74 m; s=1.22 m, h= 1.52 m, H=2.74 m, βf=0.5.
Figure 14. SII versus workstation size for varied ceiling absorption:
4. Effects of lights in the ceiling
As discussed above, the absorptive properties of the ceiling can have a large effect on speech privacy in offices. High speech privacy was shown to only occur when the ceiling tiles are highly absorptive. Therefore, to be a practically useful tool for office design, the model developed here must be able to correctly include the effect of the complete ceiling system. In [8], a procedure for determining the effective absorption coefficients of the ceiling system in offices from measured ASTM C423 data obtained in reverberation chamber tests was presented to facilitate the practical use of the model. This correction factor includes the effects of the backspace and typical incident angles on the absorption coefficients of the ceiling system. However, the effects of lights on the ceiling were not considered. Generally when there are lights in the ceiling, the absorptive properties of the ceiling system will change, depending on the type, dimensions, and positions of the lights.
Because of the great variety of lighting systems in open-plan offices, it is rather difficult if not impossible to undertake a comprehensive study, either experimentally or theoretically, of all possible lighting types and configurations. Here it is only intended to provide results indicative of the range of effects possible from various types of lighting.
For this purpose, the attenuation between adjacent workstations was measured with two types of lights in two different locations and for different ceiling tiles and workstation sizes. The two types of lights were flat lens and open grill light fixtures, and they were located either over the centre of the workstation or over the dividing screen. The configuration that most degraded the speech privacy was one flat lens light over the dividing screen. This is because the flat reflecting surface of the light provides an obvious reflection of sound energy over the screen into the adjacent workstation, as shown in Figure 15. Generally, as the lights move away from the dividing screen, the effects of the lights become less. However, when lights are over the centre of each workstation, the open grill lights affect the attenuation and SII a little more than two flat lens lights at the same positions. This may be because the sound energy is scattered back over the separating screen by the open grill light fixtures, as shown in Figure 15. The experimental results indicated that, one flat lens light over the dividing screen and two open grill lights over the centre of the workstations will most reduce speech privacy.
R S
Figure 15. Effects of lights on the speech propagation: , flat lens light; , open grill light.
In the model, only these two lighting configurations are considered. Note that lights affect the speech propagation by changing the effective absorptive properties of the ceiling system. Therefore further corrections to the effective absorption coefficients of the ceiling system corresponding to these two different lighting configurations are needed. To do so, nine measured attenuation curves, corresponding to three workstation plan sizes (2.13 m x 2.13 m, 2.74 m x 2.74 m, 3.35 m x 3.35 m) combined with three different ceiling conditions (2.74 m high H-B type high absorption ceiling tiles, 2.74 m and 2.44 m high L-A type low absorption ceiling tiles, see [8] for the absorption coefficients of these tiles), were used for obtaining the empirical correction factors for each lighting configuration. By applying the model developed in [2] to each workstation configuration and adjusting the reflection coefficients of the ceiling to fit the measured attenuation, the model-fitted reflection coefficients of the ceiling with the lights were obtained. By converting the model fitted reflection coefficients to model-fitted absorption coefficients, the ratio between the absorption coefficients of the ceiling with lights and the coefficients without lights were obtained. Figure 16 shows the resulting correction factors for the two lighting configurations. The average results of each set of measurements are used to describe how each type of lighting reduces the effective sound absorption of the ceiling. For other lighting configurations, the correction factors for two open grill lights over the centre of the workstations (Figure 16(a)) are thought be appropriate, and will generally lead to a conservative estimation of expected SII.
Although the individual ratio curves for each lighting type are not identical, they show roughly similar trends indicating reduced ceiling absorption above 630 Hz. When examined in more detail, there are possible trends indicating that the effects of lights
may also depend on the workstation size or the ceiling height. As a result, if more accurate correction factors are required, one would have to carry out more extensive tests to more precisely evaluate these possible effects.
(a) (b)
Figure 16. Correction factors to the absorption coefficients of the ceiling for lights: (a) two open grill lights over the centre of the workstation;
(b) one flat lens light over the dividing screen. The heavy lines with solid dots represent the average values.
5. Validation of the Complete Model
In order to validate the complete model, including the correction factors shown in Figure 16, the attenuation between pairs of adjacent workstations were calculated and compared with measurements in Figures 17-19 for combinations of: three different workstation plan sizes (2.13 m x 2.13 m, 2.74 m x 2.74 m, 3.35 m x 3.35 m), two different screen heights (1.52 m, 1.83 m), as well as two different lighting types. It is seen that the agreement between calculation and measurement is generally quite good at mid and high frequencies. At low frequencies, some discrepancies can be observed in the attenuation curves. These are probably due to interference effects for which the current model does not account and errors due to the assumption of specular reflections that would be inaccurate at lower frequencies when panels are comparable to or smaller than the wavelength. However, SII values and expected speech privacy are not much influenced by these low frequency effects and so it is not important to include them to obtain accurate predictions of expected speech privacy.
Figure 20 shows a plot of predicted versus measured SII values for 19 different pairs of adjacent workstations. These included 3 different workstation sizes as well as variations in the screen height, the ceiling tiles and the type of lighting. It can be seen that the correlation of measured and predicted SII is good and the corresponding RMS error is 0.02.
Figure 17. The sound attenuation between two adjacent 2.13 m x 2.13 m workstations: 2.74 m high H-B type ceiling tiles, h=1.52 m, s = 1.22 m, 50 mm thick foam on the screen,
* ---, predicted; +——, measured; (a) one flat lens light over the dividing screen;
Figure 18. The sound attenuation between two adjacent 2.74 m x 2.74 m workstations: 2.74 m high H-B type ceiling tiles, h=1.83 m, s = 1.22 m, 50 mm thick foam on the screen,
*
---, predicted; +——, measured; (a) one flat lens light over the dividing screen;
(b) two open grill lights over the centre of workstations.
.
Figure 19. The sound attenuation between two adjacent 3.35 m x 3.35 m workstations: 2.74 m high L-D type ceiling tiles, h=1.52 m, s = 1.22 m, 50 mm thick foam on the screen,
*
---, predicted; +——, measured; (a) one flat lens light over the dividing screen;
(b) two open grill lights over the centre of workstations.
6. Conclusions
This paper has used a model of sound propagation between adjacent rectangular
workstations in a conventional open-plan office to investigate the importance of various office design parameters on estimates of speech privacy. The new model was a
development from a simpler model that considered the propagation of sound for a single screen in the presence of floor and ceiling reflections. Both models have used image source techniques to represent reflections and Maekawa’s screen diffraction results to model diffraction. By adding the influence of the side and back panels of complete workstation enclosures, the new model can be used as a general design tool for conventional open office situations.
The incremental effects of separately adding side and back panels were examined. The combined effect of side and back panels can increase sound levels in the receiver workstation by up to about 6 dB depending on the absorption of the panels, the ceiling absorption, and the workstation size. Workstation panel absorption has a significant effect on sound attenuation between workstations and low absorption panels are
particularly detrimental where a highly absorbing ceiling would otherwise provide good speech privacy. Workstation size and orientation generally have smaller effects on speech privacy.
Example calculations were performed to evaluate the effects of various office design parameters on speech privacy measured in terms of SII values. The height of separating screens and the absorption of the ceiling area are again shown to be the most important determinants of speech privacy. Floor absorption and workstation size, generally have smaller effects. However, workstation panel absorption is important and it is only with the combination of high screens, high ceiling absorption, and high panel absorption that high speech privacy can be achieved.
Empirical corrections to the ceiling absorption were developed to account for the effective reduction of ceiling absorption when lights are added to the ceiling. Separate corrections were developed for the case of a flat lens light located over the separating screen and for open grill lights located over the centre of each workstation. These two corrections both show that lights reduce the effective absorption of the ceiling above 630 Hz and that the larger effect of flat lens lights located over the separating screen should particularly be avoided.
Comparison of measured and predicted SII values for propagation between adjacent rectangular workstations agreed well with an RMS error in predicted SII values of 0.02.
Acknowledgements
This work is part of the COPE project supported (at time of writing) by Public Works and Government Services Canada, Ontario Realty Corporation, USG Corporation, Natural Resources Canada, Steelcase, British Columbia Buildings Corporation, and The Building Technology Transfer Forum. The donation of ceiling tile material by USG Corporation and Ottawa Fibre was much appreciated. The authors would like to thank Mr. B. Biffard and Mr. S. Bumpus for their contributions to the experimental work of the project at NRC. Suggestions given by the members of the Cope Acoustics Team are appreciated. C. Wang also acknowledges receipt of a National Research Council Postdoctoral Fellowship for the pursuit of the study.
References
1. ISO/DIS 17624, 2001 (draft), Acoustics - Guidelines for noise control in offices and workrooms by means of acoustical screens.
2. Wang, C. and Bradley, J.S., 2002, “Sound propagation between two adjacent rectangular workstations in open-plan offices I: mathematical modeling”, submitted for publication Applied Acoustics.
3. Moreland, J.B., 1988, “Role of the screen on speech privacy in open plan offices”, Noise Control Engineering Journal, 30(2), pp. 43-56.
4. Moreland, J.B., 1989, “Speech privacy evaluations in open-plan offices using the articulation index”, Noise Control Engineering Journal, 33(1), pp. 23
5. ANSI S3.5-1969, American National Standard Methods for the Calculation of the Articulation Index.
6. Wang, C. and Bradley, J.S., 2002, “A mathematical model for a single-screen barrier in open-plan offices”,. Applied Acoustics, 63(8), pp. 849-866.
7. ANSI S3.5-1997, American National Standard Methods for Calculation of the Speech Intelligibility Index.
8. Wang, C. and Bradley, J.S., 2002, “Prediction of the speech intelligibility index behind a single screen in open-plan offices”,. Applied Acoustics, 63(8), pp867-883.