DOI 10.1007/s00421-014-2835-8
OrIgInAl ArtIclE
Cerebral oxygenation during the Richalet hypoxia sensitivity test
and cycling time‑trial performance in severe hypoxia
Nicolas Bourdillon · Jui‑Lin Fan · Bengt Kayser
received: 4 September 2013 / Accepted: 25 January 2014 / Published online: 9 February 2014 © Springer-Verlag Berlin Heidelberg 2014
O2Hb by 2.2 ± 1.2 μmol (p < 0.05 vs. resting normoxia); hypoxic exercise further lowered it to −7.6 ± 3.1 μmol below baseline (p < 0.05). cerebral HHb, increased by 3.5 ± 1.8 μmol in resting hypoxia (p < 0.05), and further to 8.5 ± 2.9 μmol in hypoxic exercise (p < 0.05). changes in cBF and cerebral tissue oxygenation during rt did not correlate with tt performance loss (R = 0.4, p > 0.05 and
R = 0.5, p > 0.05, respectively), while tissue oxygenation and SaO2 changes during tt did (R = −0.76, p < 0.05). Significant correlations were observed between SaO2,
McAv and HHb during rt (R = −0.77, −0.76 and 0.84 respectively, p < 0.05 in all cases).
Conclusions cBF and cerebral tissue oxygenation changes during rt do not predict performance impairment in hypoxia. Since the changes in SaO2 and brain HHb dur-ing the tt correlated with performance impairment, the hypothesis that brain oxygenation plays a limiting role for global exercise in conditions of severe hypoxia remains to be tested further.
Keywords Altitude · Hypoxia · Exercise · Performance · Brain
Introduction
Acute hypoxia impairs peak aerobic power (i.e., maximum oxygen consumption, ˙VO2peak) and hinders optimal
per-formance in global exercises (e.g., running or cycling) such as time-to-exhaustion, time-trial, and maximum distance covered in a given time [see roach and Kayser (2001) for review]. Studies have tried to identify the underlying mechanisms of this impairment (lawler et al. 1988; Fer-retti et al. 1997; Woorons et al. 2007; Amann and Kayser
2009; calbet et al. 2009). two consensuses arise from these Abstract
Background the richalet hypoxia sensitivity test (rt), which quantifies the cardiorespiratory response to acute hypoxia during exercise at an intensity corresponding to a heart rate of ~130 bpm in normoxia, can predict suscepti-bility of altitude sickness. Its asuscepti-bility to predict exercise per-formance in hypoxia is unknown.
Objectives Investigate: (1) whether cerebral blood flow (cBF) and cerebral tissue oxygenation (O2Hb; oxygenated hemoglobin, HHb; deoxygenated hemoglobin) responses during rt predict time-trial cycling (tt) performance in severe hypoxia; (2) if subjects with blunted cardiorespira-tory responses during rt show greater impairment of tt performance in severe hypoxia.
Study design thirteen men [27 ± 7 years (mean ± SD), Wmax: 385 ± 30 W] were evaluated with rt and the results related to two 15 km tt, in normoxia and severe hypoxia (FIO2 = 0.11).
Results During rt, mean middle cerebral artery blood velocity (McAv: index of cBF) was unaltered with hypoxia at rest (p > 0.05), while it was increased during normoxic (+22 ± 12 %, p < 0.05) and hypoxic exercise (+33 ± 17 %, p < 0.05). resting hypoxia lowered cerebral
communicated by carsten lundby. n. Bourdillon (*) · J.-l. Fan · B. Kayser
ISSUl institute of Sport Sciences, University of lausanne, lausanne 1015, Switzerland
e-mail: [email protected] B. Kayser
e-mail: [email protected] J.-l. Fan
lemanic neuroscience Doctoral School, University of lausanne, lausanne, Switzerland
studies: first, people with higher ˙VO2peak in normoxia are
more adversely affected (Martin and O’Kroy 1993; gore et al. 1996; Ferretti et al. 1997; Woorons et al. 2007; cal-bet and lundby 2009); and second, this is due to a greater drop in arterial oxygen saturation (SaO2), arterial oxy-gen content (caO2), and mass O2 transport (Ekblom et al.
1975; chapman et al. 1999; Woorons et al. 2007; calbet and lundby 2009), leading to an early onset of muscle fatigue and exhaustion (Amann and Kayser 2009). In mod-erate hypoxia, maximum cardiac output is similar to that in normoxia, which supports the notion that mass cardio-vascular oxygen transport is a main limiting factor. But in more severe hypoxia (SaO2 < 75 %), peak heart rate and cardiac output are blunted at maximal exercise, while there is less muscle fatigue at the point of exhaustion, suggest-ing early limitation of motor drive and disengagement from the effort before the advent of important peripheral mus-cle fatigue (Kayser 2003; Amann et al. 2007; Amann and Kayser 2009; calbet and lundby 2009; Seifert et al. 2010; Subudhi et al. 2011).
near infrared spectroscopy (nIrS) allows for the con-tinuous measure of oxy- and deoxyhemoglobin concen-trations in brain tissue thus potentially giving precious information on the oxygenation status during exercise and exposure to hypoxia (Bourdillon and Perrey 2012). Exposure to hypoxia at rest lowers prefrontal cortex tissue oxygenation, while global exercise in normoxia elevates it (rupp and Perrey 2008; Smith et al. 2012). Since combina-tion of global exercise and hypoxia reduces cerebral tissue oxygenation (rupp and Perrey 2008; Subudhi et al. 2008; Bourdillon et al. 2009; Verges et al. 2012), some authors speculated that this reduction might limit global exercise capacity and performance in hypoxia (Amann et al. 2007; Subudhi et al. 2009; Amann and Kayser 2009; rasmus-sen et al. 2010). In agreement with this contention, during exercise in severe hypoxia, administration of supplemental oxygen at the point of exhaustion rapidly improves cere-bral oxygenation, improving peak power output (Subudhi et al. 2009; Koglin and Kayser 2013) and time to exhaus-tion (Kayser et al. 1994; Amann et al. 2007). Since this shift is too quick to result from reversal of the accrual or depletion of metabolites associated with muscle fatigue, it was suggested that the improvement in performance may be mediated by improved cerebral oxygen delivery (Kay-ser et al. 1994; Amann et al. 2007; Subudhi et al. 2009).
cerebral oxygen delivery is the product of cerebral blood flow (cBF) and caO2. In normoxia, submaximal global exercise increases middle cerebral artery blood veloc-ity (McAv) and presumably blood flow (Jørgensen et al.
1992; Madsen et al. 1993; Ide et al. 1999). Hypoxemia per se leads to cerebral vasodilation, while hyperventilation-induced hypocapnia associated with hypoxemia causes cerebral vasoconstriction (Ainslie and Ogoh 2010). the net
effect of exposure to hypoxia on cBF depends on the sum of these opposing drives (Peltonen et al. 2007; nishimura et al. 2010). Whether cBF and cerebral oxygenation play a limiting role in exercise performance in hypoxia remains unclear (Subudhi et al. 2008; Peltonen et al. 2009; Subudhi et al. 2011; Verges et al. 2012; Fan and Kayser 2013).
the extent of hypoxemia and hypocapnia upon acute exposure to hypoxia is function of the hypoxic ventilatory response, defined as the increase in ventilation in hypoxic conditions, through the stimulation of the peripheral chemoreceptors. For acclimatization to high altitude and mountaineering performance, a strong hypoxic ventilatory response (i.e., large increase in ventilation) is thought to be a factor for success, but may also increase the risk of brain damage because of excessive hyperventilation hypocapnia-induced cerebral hypoxemia (Hornbein et al. 1989). In contrast, findings by Bernardi et al. (2006) suggest that a blunted ventilatory response to hypoxia gives acclimatized elite climbers more respiratory reserve, which would allow them to perform better at extreme altitude.
richalet et al. (1983, 2012) developed a hypoxia sen-sitivity test and reported that a blunted cardiorespiratory response to hypoxia during cycling exercise (at an inten-sity reaching a heart rate of ~130 bpm in normoxia) pre-dicts risk for acute mountain sickness (AMS). cBF and cerebral tissue oxygenation responses during this test have not yet been reported. We hypothesized that a brisk cBF response during a richalet test would protect cerebral tis-sue oxygenation and be accompanied by less impairment of cycling time-trial performance in severe hypoxia, while a brisk ventilatory response to hypoxia would impede cer-ebral oxygenation and impair time-trial performance. to test these hypotheses, we measured cBF with transcranial Doppler and prefrontal cerebral cortex oxygenation with nIrS during a richalet test in unacclimatized subjects and related the changes with the subjects’ all-out 15 km time-trial (tt) cycling performances in normoxia and acute nor-mobaric hypoxia.
Methods Participants
thirteen healthy male subjects participated in this study [age: 27 ± 7 years (mean ± SD); body mass index: 22.3 ± 1.3 kg/m2,
and Wmax: 385 ± 30 W]. All were trained amateur cyclists living in geneva, Switzerland (389–450 m) and not acclima-tized to high altitude. they were non-smokers, had no previ-ous history of cardiovascular, cerebrovascular, or respiratory disease and were not taking any medication at the time of the study. Informed written consent was obtained from the subjects prior to their participation. the study was approved
by the research Ethical committee of the University Hos-pitals of geneva and conformed to the standards set by the Declaration of Helsinki.
Experimental design
In the context of another study (Fan et al. 2013) the par-ticipants had three laboratory visits. the first visit included familiarization (which included adjustment of bike settings and familiarization with all devices and procedures used for the experiments), and the richalet hypoxia sensitivity test (described below), followed by an incremental ramp test on a cycle ergometer (Ergoselect 100, Ergoline gmbH, Bitz, germany). the participants then returned on two separate days to perform a 15 km tt in either normoxia (ambient air at 389 m) or hypoxia (normobaric, FIO2 = 0.11, equiva-lent of an altitude of ~5,000 m) in a randomized, balanced, single-blind design. the tests were separated by three to fourteen days. Before each experimental session, the par-ticipants were asked to abstain from caffeine for 12 h, and heavy exercise and alcohol for 24 h. Each time-trial ses-sion comprised of 20 min of instrumentation followed by a 2-min resting baseline collection with the participants breathing room air. they were seated on a racing bicycle fitted to a computrainer Pro model trainer (racerMate, Seattle, WA, USA), which was calibrated prior to each session according the manufacturers’ instruction manual. While breathing room air, the subjects were asked to per-form a 5-min self-selected warm-up exercise with heart rate <130 bpm. they then rested for 5 min after which they were switched to breathe from a gas mixing system (Alti-trainer, SMtec, nyon, Switzerland) for another 4-min rest-ing baseline collection. the participants were instructed to perform a 15 km tt cycling as fast as possible. they were free to shift gears during tt and constant feedback regard-ing the distance was provided on a monitor by means of a cursor along a horizontal bar and a countdown distance dis-play (computrainer 3D software version 3.0, racermate). time-trial performance was expressed as the time spent to cover the 15 km as well as the average power output during the tt. throughout all three experimental sessions, the par-ticipants wore a nose-clip and breathed through a mouth-piece attached to a low resistance one-way non-rebreath-ing valve (Hans-rudolph 2700, Kansas city, MO, USA). Hypoxia was achieved attaching the gas mixing system to the inspiratory valve of the mouthpiece using low resist-ance tubing. the device consists of a reservoir in which air and experimental gasses are mixed and from which the participant inspires. During the time-trials the fraction of inspired O2 (FIO2) was kept constant at either 0.21 or
0.11, corresponding to sea level and an altitude of 5,000 m, respectively. the participants always breathed through the same circuit, were kept naive to what gas mixture they
were breathing, and were not informed in detail about the rationale of the study. For each participant, the experiments were carried out at the same time of day under consistent laboratory conditions (temperature 21 ± 1 °c, humidity 32 ± 5 %, barometric pressure 726 ± 6 mmHg).
richalet test
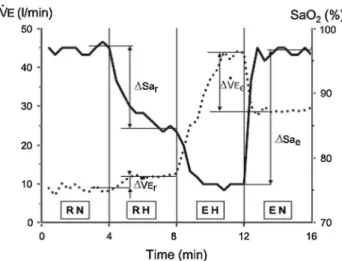
Figure 1 shows the richalet hypoxia sensitivity test (rich-alet et al. 2012) of which we performed the four 4-min steps: (a) resting normoxia (rn); (b) resting hypoxia (rH; FIO2 = 11 %); (c) hypoxic exercise (EH); and (d)
nor-moxic exercise (En). Mechanical power output on the cycle ergometer was adjusted at the beginning of the first cycling phase to attain a heart rate (Hr) at around 120–130 bpm in hypoxia and then kept constant (corresponding to 37 ± 7 % of maximal normoxic power output). Arterial oxygen satura-tion from pulse oximetry (SpO2), ventilation (˙VE) and Hr variations between phases were used to characterize sub-jects’ sensitivity to hypoxia (richalet et al. 2006, 2012) by calculating:
Desaturation at rest: ∆Spr= Sprn− Sprh (%)
Desaturation at exercise: ∆Spe= Spen− Speh (%)
Ventilation changes at rest: ∆ ˙VEr= ˙VErh− ˙VErn (1/min);
Ventilation changes at exercise: ∆ ˙VEe= ˙VEeh− ˙VEen(1/min);
Fig. 1 Hypoxia exercise test, modified from richalet et al. (2012). RN rest in normoxia, RH rest in hypoxia, EH exercise in hypoxia, EN exercise in normoxia. Hypoxia was produced by breathing a normo-baric hypoxic gas mixture (FIO2 = 0.115). Exercise was performed at
approximately 37 ± 7 % of maximal power output in phases EH and En. Ventilatory response to hypoxia during exercise (HVre);
Arte-rial oxygen saturation (Sa, SaO2); Arterial oxygen saturation during
rest (Sae); Arterial oxygen saturation during exercise (Sar);
pulmo-nary ventilation ( ˙VEe); Pulmonary ventilation during exercise ( ˙VEe).
Dotted line, ˙VE; solid line, Sa. reprinted with permission of the American thoracic Society. copyright © 2014 American thoracic Society (richalet et al. 2012). Official Journal of the American thoracic Society
Ventilatory response at rest: HVRr= ∆ ˙VEr/∆Spr/BW (l/min/kg);
Ventilatory response at exercise: HVRe= ∆ ˙VEe/∆Spe/BW (l/min/kg);
cardiac response at rest:
HCRr= (HRrh−HRrn)/∆Spr (beats/min/ %);
cardiac response during exercise:
HCRe= (HReh−HRen)/∆Spr (beats/min/ %).
Sp = O2 saturation, Hr = heart rate, ˙VE = ventilation,
BW = body weight, r = rest, e = exercise, n = normoxia, h = hypoxia.
Measurements
Respiratory variables
gas exchange was monitored breath-by-breath (Medgraph-ics cPX, St Paul, Mn, USA) measuring flow at the mouth (Pitot tube). Fractions of inspired and expired O2 and cO2 were recorded with fast responding gas analysers (infrared and paramagnetic) integrated in the system. Ventilation was calculated from the flow signal and expressed in l.min−1
BtPS. Partial pressures of end-tidal O2 (PetO2) and cO2
(PetcO2) were also measured by the gas analysis system.
Prior to each experimental session, the system was cali-brated using a 3-l syringe (M9474, Medikro Oy, Finland) and gas mixtures of known O2 and cO2 concentrations.
Cerebrovascular variables
Middle cerebral artery blood flow velocities (McAv) were measured bilaterally using a 2-MHz pulsed Dop-pler ultrasound system (St3, Spencer technology, Seat-tle, WA, USA). the probes were positioned over the tem-poral windows and held firmly in place with an adjustable head frame (Marc 600, Spencer technology, Seattle, WA, USA). the signals were acquired at depths ranging from 43 to 54 mm. Signal quality was optimized and an M-mode screen shot was recorded to facilitate subsequent probe placements. Depth and velocity of McAv signals were recorded and compared between sessions to ensure within-subject repeatability. In our hands, day-to-day reproduc-ibility of McAv has a coefficient of variation of <10 %. Bilateral McAv were averaged to represent an index of overall cBF. cerebral oxygenation in the left prefrontal lobe was assessed by monitoring changes in oxy-, deoxy- and total hemoglobin (O2Hb, HHb and tHb, respectively), obtained with spatially resolved, continuous wave nIrS (Artinis, Oxymon MKIII, Zetten, the netherlands). the nIrS probe was centered on the Fp1 point according to the EEg 10-20 system, i.e., 10 % of the nasion-vertex-inion distance, up from the nasion; and 10 % of the nasion-tem-poral-inion distance, left from the nasion. nIrS measures
changes in infrared light attenuation diffusing through tis-sue. Positioned over the scalp, this non-invasive device allows monitoring of regional changes in cerebral hemo-dynamics and reflects local tissue oxygenation. the signals reflect variations in concentrations of O2Hb, HHb and tHb in brain blood vessels (arterioles, capillaries, venules and veins), not O2 in the tissue itself. Source-detector spacing was set at 4.1 cm and data obtained from the optode was used to calculate changes with regard to baseline resting conditions in O2Hb, HHb and tHb with a differential path
length factor computed according to the subjects’ age (van der Zee et al. 1992). All reported concentrations of O2Hb, HHb and tHb are changes with regard to normoxic resting baseline. For the richalet test the resting baseline was set at 0 during the rn phase.
Cardiovascular variables
Beat-to-beat mean arterial blood pressure (MAP) was monitored using finger photoplethysmography (Finometer-MIDI, Finapress Medical Systems, Amsterdam, the neth-erlands). From the MAP traces, beat-to-beat Hr was cal-culated (labchart version 7.2, ADInstruments, Bella Vista, Australia). Peripheral O2 saturation (SpO2) was measured with a pulse oximeter (radical-7™, Masimo corporation, Irvine, cA, USA) on the right earlobe after application of a hyperaemia-inducing ointment (Decontractyl, Sanofi-Aventis, Paris, France). Arterialized blood gas samples of 75 μl were taken from the other ear lobe of the subjects during baseline, and at the 5th, 10th and 15th km of the tt. Samples were immediately analyzed on a rapidlab 248 (Siemens, Erlangen, germany) for PaO2, PacO2, and pH, with [HcO3-] and SaO
2 calculated by the system.
Data were acquired using an analogue-to-digital con-verter (Ml880, Powerlab 16/30, ADInstruments, Bella Vista, Australia) with commercially available software (labchart version 7.2, ADInstruments, Bella Vista, Aus-tralia), and stored on a computer for analysis. With the exception of the blood samples, all variables were recorded continuously at 200 Hz throughout the richalet test and the 15 km tt tests.
Data and statistical analysis
From the richalet tests the average data obtained in the last 30 s of the 4-min phases were used. Data are reported as mean ± SD. A paired t test (p < 0.05) was used to com-pare normoxic and hypoxic 15 km time-trial times, average power output, Hr and SpO2. repeated-measures AnOVA with an alpha level of p < 0.05 were used to compare the 30 s means at each kilometer of the tt for these vari-ables (Matlab r2013b, MathWorks®, natick, MA, USA).
assessed using repeated-measures AnOVA with an alpha level of p < 0.05. Post hoc analysis of significant results from the AnOVAs was performed through Fischer’s lSD. correlation between variables was quantified by Pearson product (R = σxy/(σx. σy) with σxy covariance between parameters x and y; σx and σy standard deviations of parameters x and y) using Matlab.
Results
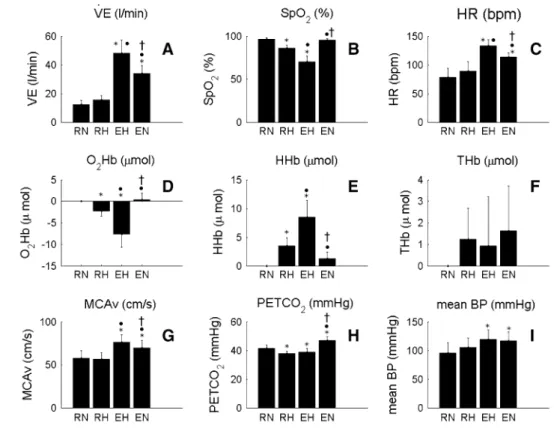
the main parameters during the four phases of the richalet test are summarized in Fig. 2 and typical traces of McAv and nIrS variables are shown in Fig. 3. resting hypoxia tended to increase ˙VE (p > 0.05), while normoxic exercise, corresponding to 37 ± 7 % of maximum aerobic work capacity in normoxia, increased it by 22 ± 7 l/min (12 ± 3 vs. 34 ± 5 l/min, p < 0.05); hypoxic exercise furthered this increase by 36 ± 10 l/min (12 ± 3 vs. 48 ± 9 l/min,
p < 0.05 vs. resting normoxia, Fig. 2a). Hypoxia at rest lowered SpO2 by 11 ± 3 % (p < 0.05 vs. resting normoxia).
the normoxic exercise did not decrease SpO2 (p > 0.05 vs. resting normoxia), while hypoxic exercise lowered SpO2 by 27 ± 5 % (p < 0.05, Fig. 2b). resting hypoxia tended to increase Hr by 11 ± 4 bpm (p > 0.05); Hr was increased by 36 ± 10 bpm during normoxic exercise (p < 0.05 vs. resting normoxia), while the hypoxic exercise increased Hr by 55 ± 9 (p < 0.05 vs. resting normoxia, Fig. 2c). the
patterns of change of those three parameters corresponded to those described by richalet et al. (2006, 2012).
resting hypoxia decreased PetcO2 by 3.6 ± 1.2 mmHg
(p < 0.05), while normoxic exercise increased PetcO2
by 5.5 ± 1.9 mmHg (p < 0.05). Hypoxic exercise did not change PetcO2 as compared to resting hypoxia (p > 0.05,
Fig. 2h).
Mean BP was modified by exercise only (p < 0.05), while hypoxia had no effect (p > 0.05, Fig. 2i).
Mean McAv was unaltered with resting hypoxia (p > 0.05), while it was increased during normoxic exercise (by 22 ± 12 %, p < 0.05) and to an even greater extent during hypoxic exercise (by 33 ± 17 %, p < 0.05, Figs. 2g and 3).
the nIrS data for one subject were lost due to a tech-nical issue (n = 12). O2Hb followed the same trend as
SpO2, decreasing by 2.2 ± 1.2 μmol in resting hypoxia
(p < 0.05), while hypoxic exercise during the richalet test further lowered cerebral O2Hb to −7.6 ± 3.1 μmol from baseline (p < 0.05, Figs. 2d, 3). In contrast, normoxic exer-cise had no effect on cerebral O2Hb (p > 0.05). cerebral
HHb showed mirror changes compared to cerebral O2Hb, increasing by 3.5 ± 1.8 μmol in hypoxic rest (p < 0.05 vs. normoxic rest). Hypoxic exercise increased cerebral HHb by 8.5 ± 2.9 μmol (p < 0.05), while normoxic exer-cise had no effect (p > 0.05, Figs. 2e, 3). cerebral tHb did not change throughout the four phases of the richalet test (Fig. 2f).
Fig. 2 changes in parameters during the four phases of the richalet hypoxic sensitivity test. RN resting normoxia, RH resting hypoxia, EH hypoxic exercise, EN normoxic exercise. Hypoxia was simulated at an altitude equivalent to 4,800 m; exercise intensity was set at 130 bpm during the hypoxic exercise. Ventilation ( ˙VE); Pulse oxygen saturation (SpO2); HR heart rate, Oxyhemoglobin con-centration (O2Hb); Deoxyhemo-globin concentration (HHb); Mean middle cerebral artery blood flow velocity (McAv); Partial pressure of end-tidal cO2 (PetcO2); Mean blood pressure (mean BP). Asterisks different from rn (p < 0.05); filled circle different from rH (p < 0.05); dagger different from EH (p < 0.05)
Mean HVre was 0.77 ± 0.41 l/min/kg and mean HVrr
was 0.50 ± 0.51 l/min/kg. none of our subjects were below richalet’s thresholds for normal values (richalet et al.
2006). neither HVre nor HVrr correlated with the
perfor-mance decrement in hypoxic tt (R = 0.12, 0.08 respec-tively, p > 0.05 for both).
SpO2 and McAv correlated well during the hypoxic phases of the richalet test (rH vs. EH, r = −0.77,
p < 0.05, Fig. 4).
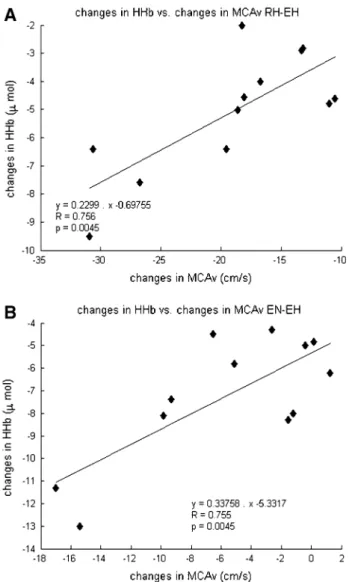
there were good correlations for the McAv and cer-ebral HHb changes between normoxic and hypoxic exer-cise (R = 0.76, p < 0.05, n = 12, Fig. 5b) and between hypoxic rest and hypoxic exercise (R = 0.76, p < 0.05,
n = 12, Fig. 5a) during the richalet test. A similar trend was found for SpO2 and cerebral HHb between normoxic versus hypoxic exercise (R = −0.64, p = 0.05, n = 12) and between hypoxic rest and hypoxic exercise (R = −0.76,
p < 0.05 n = 12).
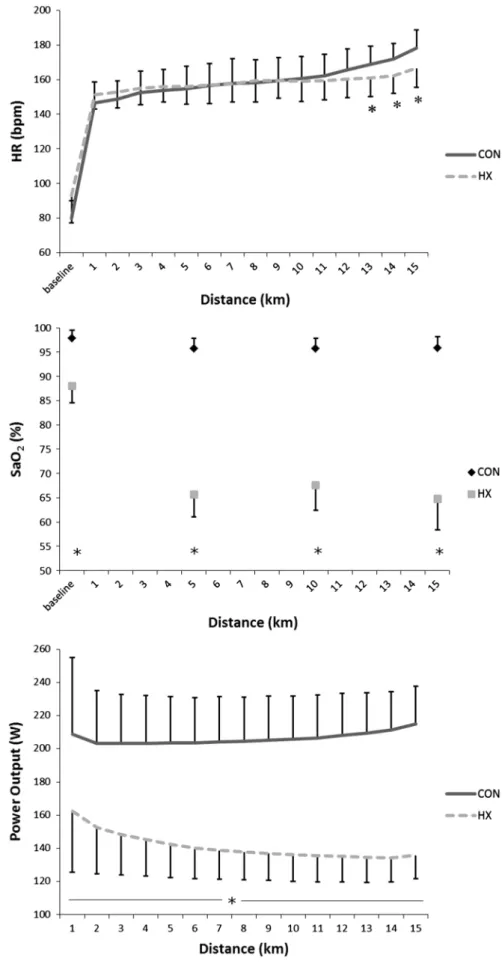
time to complete the 15 km increased in hypoxia by 20.2 ± 6.2 % (1,904 ± 75 s vs. 1,581 ± 60 s; p < 0.05).
SaO2 at the 5th, 10th, and 15th km, along with Hr, and power output at each kilometer during the tt in normoxia and hypoxia are reported on Fig. 6 (n = 11, due to difficul-ties in blood sampling from two subjects). Hr was higher at rest in hypoxia (p < 0.05), but lower during the last 3 km of the trials (p < 0.05). Power output and SaO2 were lower in hypoxia at all times (p < 0.05 for both).
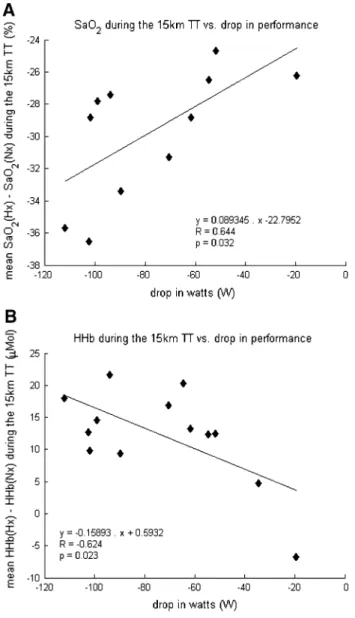
Figure 7a shows the correlation between the mean drop in SaO2 and the drop in performance during the 15 km tt (R = 0.64, p < 0.05, n = 11). Figure 7b shows the cor-relation between mean brain HHb during the tt and the drop in performance (R = 0.62, p < 0.05). there was no
Fig. 3 typical traces of McAv and nIrS measurements during the four phases of the richalet test. RN rest in normoxia, RH rest in hypoxia, EH exercise in hypoxia, EN exercise in nor-moxia. Middle cerebral artery blood flow velocity (McAv). the upper boundary represents peak systolic flow, the lower boundary end-diastolic flow; Oxyhemoglobin concentration (O2Hb); Deoxyhemoglobin concentration (HHb)
Fig. 4 correlation between changes in O2 saturation and
cere-bral blood flow velocity during the RH resting hypoxia and the EH hypoxic exercise phases of the richalet test (cf. Fig. 1). Pulse oxy-gen saturation (SpO2); Middle cerebral artery blood flow velocity
correlation between mean McAv during the tt and the drop in performance.
Discussion
the variations in SpO2, McAv and prefrontal brain HHb between the phases of the richalet test correlated with each other, but not with the tt performance decrement in hypoxia, which refutes our first hypothesis. there was also no correlation between the hypoxic ventilatory response as quantified by the richalet test (HVrr and HVre) and the
impairment of tt performance, which refutes our second hypothesis. conversely, the changes in SaO2 and of pre-frontal brain HHb during the tt were correlated with the
drop in tt performance, suggesting that mass oxygen sup-ply to the brain during the tt was limited by the exposure to hypoxia, thus leaving the hypothesis that brain oxygena-tion may play a limiting role for global exercise in condi-tions of severe hypoxia to be tested further.
cerebral blood flow and oxygenation during the richalet test
Prefrontal cortex O2Hb was decreased by hypoxia and
fur-ther reduced with exercise and hypoxia combined (Figs. 2d,
3). this reduction in O2Hb coincided with increased pre-frontal HHb while tHb remained unchanged (Fig. 2f), indicating reduced prefrontal cortex oxygenation (Figs. 2d– f, 3). McAv and HHb correlated during the richalet test (Fig. 5a, b). Since the nIrS data consistently showed reduced oxygenation during hypoxic exercise, the increase in cBF (as estimated by McAv) was insufficient to prevent the drop in cerebral tissue oxygenation. As suggested by Verges et al. (2012), the balance between O2 delivery and utilization in the prefrontal cortex was probably modified towards a lower level of oxygenation during exercise in hypoxia. the reduction in cerebral O2 delivery, potentially associated with an increased cerebral metabolic rate dur-ing whole-body exercise in hypoxia (Subudhi et al. 2007), would thus account for the reduced O2Hb. However, since
nIrS assesses changes in deoxygenation in both pre- and post-capillary areas, it is also possible that oxygen extrac-tion might have been increased (Brugniaux et al. 2007; Smith et al. 2013).
the changes in McAv and nIrS variables during the richalet test did not correlate to tt performance. Profound hypoxemia (SaO2 < 75 %) is thought to limit performance through a shift from predominantly peripheral muscle fatigue towards a cnS based inhibitory effect on central motor drive (Amann et al. 2007; Amann and Kayser 2009; rasmussen et al. 2010). It is likely that the limited hypox-emia during the richalet test was of insufficient magnitude to limit central motor output. Moreover, the intensity of exercise during the richalet test, corresponding to ~50– 60 % of peak hypoxic aerobic capacity, probably did not sufficiently challenge mass oxygen transport to muscle and brain. As such, subjects with a greater decrease in SpO2 during the richalet test showed a greater increase in McAv and HHb (Figs. 4, 5), but these changes do not provide insight to the variations in McAv and HHb up to maximal exercise, nor do they predict tt performance decrease in hypoxia.
We found no correlation between PetcO2 and other
variables in our study, probably because the decrease in PetcO2 in hypoxia was too small (Fig. 2h) to provoke a
significant vasoconstriction in the cerebral vasculature. the increase in McAv associated with hypoxia, increased
Fig. 5 correlation between changes in cerebral tissue deoxy-genation, cerebral blood flow velocity. a resting hypoxia (rH) vs. hypoxic exercise (EH) phases of the richalet test; b normoxic exer-cise (En) vs. hypoxic exerexer-cise (EH). Middle cerebral artery blood flow velocity (McAv); Deoxyhemoglobin concentration (HHb)
Fig. 6 Average values of heart rate (top panel), arterial O2 saturation (middle panel), and power output (bottom panel) during 15 km time-trial in normoxia and hypoxia. Solid line: normoxic control room air (con), dashed line: hypoxic trial (Hx). Asterisks different from normoxia (p < 0.05)
cardiac output and systemic blood pressure during exer-cise would also counteract the vasoconstrictive effect of reduced PetcO2.
Although McAv and cerebral nIrS variables during the richalet test were not predictive of performance, these variables are of interest in order to characterize the cBF response to hypoxia, which is normally difficult to test, as cBF is normally insensitive to acute hypoxia during rest, unless hypoxia is very severe (PetO2 < 50 mmHg). Further
studies are needed to determine whether specific nIrS or McAv responses to hypoxia would be predictive of altitude sickness.
Exercise limitation in severe hypoxia
the impairment of aerobic power and exercise perfor-mance in severe hypoxia (SaO2 < 75, 66 % in the present study) is still not well understood (Amann et al. 2007; calbet et al. 2009). While the lack of oxygen is the obvi-ous cause, the exact mechanisms by which hypoxia initi-ates an earlier disengagement from an exercise challenge remain unclear. Since biochemical, electromyographic, and mechanical signs of muscle fatigue at exhaustion are lower compared to normoxia, muscle metabolic fatigue does not appear to be the main cause of impaired whole-body exercise performance in severe hypoxia (Verges et al. 2012). Upon reaching exhaustion in severe hypoxia, subjects can continue cycling when surrepti-tiously switched to normoxia and/or hyperoxia (Kay-ser et al. 1994; Amann et al. 2007; Subudhi et al. 2008; Koglin and Kayser 2013), which supports the role of supra-spinal limitation in exercise performance. Amann et al. (2007) speculated that the degree of hypoxia influ-ences the relative role of muscle fatigue in the cessation of dynamic exercise with large muscle groups. they noted that similar levels of muscle fatigue were observed at task failure from constant load exercise to exhaus-tion, when SaO2 averaged 94, 82, or 76 %, respectively (FIO2 = 0.21–0.12), but less muscle fatigue at a SaO2 of
67 % (FIO2 = 0.10). From this, they reasoned that there is a threshold of SaO2 for a switch from a predominant effect of peripheral fatigue to a predominant effect in the cnS. In the present study both SaO2 and HHb
concentra-tions during the 15 km tt correlated to performance in hypoxia. Since SaO2 during the tt dropped well below the 75 % threshold proposed by Amann et al. (2007), tt performance was likely curtailed by some degree of cnS based limitation to motor drive. Since nIrS vari-ables reflect a mean between pre- and post-capillary states, therefore potentially including mechanisms for O2 extraction, there might be a role of adaptive oxygenation fraction extraction in hypoxia.
In similar conditions of severe hypoxia (SaO2 < 75 %), calbet et al. (2009) found that the reduction in systemic and leg O2 delivery during cycling corresponded with
the reduction in ˙VO2 peak. Since ˙VO2 peak was reached
at submaximal cardiac output as compared to normoxia, they speculated that the impaired maximal cardiac output, leg blood flow, O2 delivery to the leg muscles, and
subse-quent reduced ˙VO2 peak and exercise performance could
be attributed to a cardio-inhibitory reflex associated with lower brain O2 delivery in severe acute hypoxia.
In agreement with this hypothesis we found a decrease in brain oxygenation in our setup and a correlation between the change in prefrontal brain HHb between normoxic and hypoxic tt and the drop in tt performance (Fig. 7b).
Fig. 7 correlation between the changes in average power output, arterial O2 saturation (top panel), and cerebral tissue deoxygenation (bottom panel) during the 15 km time-trial. Arterial oxygen saturation (SaO2); Deoxyhemoglobin concentration (HHb)
However, we found no significant correlation between the changes in McAv and performance. the latter might be due to the strong increase in McAv during intense exercise, equally in normoxia and hypoxia. We recently reported that augmenting FIcO2 led to an increase in cBF dur-ing submaximal exercise in normoxia, but not in hypoxia, indicating that the ‘normal’ cerebrovascular response to hypercapnia (i.e., vasodilation) is blunted during exer-cise in hypoxia, possibly due to an exhaustion of cerebral vasodilatory reserve (Fan and Kayser 2013). If severe hypoxia cannot increase McAv further than that resulting from intense exercise, it may explain the lack of correla-tion between hypoxic-normoxic McAv differences and tt performance.
Hypoxic ventilatory response and performance at altitude Schoene et al. (1984) reported that climbers with a strong hypoxic ventilatory response were more success-ful on Everest, reaching and sleeping at higher altitudes. Meanwhile, Bernardi et al. (2006) measured the venti-latory response to hypoxia in 11 elite climbers attempt-ing Everest and K2 and found that the successful climb-ers (i.e., those summiting without using bottled oxygen) had lower resting minute ventilation, respiratory rate, and ventilatory response to hypoxia, and higher ventilatory reserve and ventilatory efficiency at 5,200 m, compared to the non-summiteers. those authors concluded that a blunted hypoxic ventilatory response at moderate altitude was advantageous for these summiteers, as it meant that they had a greater ventilatory reserve at lower altitudes, thereby permitting more sustainable ventilations near the summits. Since there was no difference in the hypoxic ventilatory response at low altitude prior to acclimatiza-tion, it appears that this blunted ventilation at altitude was likely to be an adaptive response rather than a constitu-tive characteristic (Bernardi et al. 2006). Additionally, Hornbein et al. (1989) suggested that a strong ventilatory response may lead to such important drops in PacO2 that hypocapnic cerebral vasoconstriction dominates hypoxic vasodilation, leading to excessive tissue hypoxia, and impaired neurobehavioral function and residual effects upon return from a prolonged altitude exposure. Van Dorp et al. (2007) found improved cognitive performance in hypoxia when adding cO2 to inspirate, suggesting that the balance between hypoxia-induced vasodilation and hypocapnia-induced vasoconstriction is indeed important. In the present study, the hypoxic stimulus was unlikely to be strong enough to reach ventilatory reserve and the intensity of exercise during the richalet test was not suffi-cient to obtain a convincing correlation between the vari-ations in SpO2 and ˙VE or HVre as defined by richalet et al. (2012).
limitations
the richalet test was originally designed to predict sus-ceptibility for altitude illness (richalet et al. 2012). In predisposed subjects and those who ascend too quickly, AMS develops between four and height hours after arrival to altitudes above 2,500–3,500 m (Hackett et al.
1976). In our experimental design, the tt was performed after about 5 min of exposure to normobaric hypoxia, which is too short for AMS symptoms to develop. Whether cBF and brain oxygenation reactivity during a richalet test relate to AMS during a prolonged stay at altitude remains an open question. the relationship between richalet test results and the risk for AMS was evaluated on thousands of measurements (richalet et al.
2012). Because of the limited number of subjects in our study we cannot exclude the possibility that the lack of correlation between cBF and cerebral oxygenation indi-ces during the richalet test with time-trial performance might be due to type-II error.
We opted to use the original richalet test altitude of 4,800 m but tested performance at 5,000 m. According to the measured FIO2 the actual difference between the two simulated altitudes was 165 m. Since the richalet test yields the same outcome at different simulated altitudes this should not have influenced the results (richalet et al.
2012).
We used left prefrontal HHb and O2Hb measured by nIrS as indicators of global cerebral tissue oxygenation, which is a simplification, even though good agreements have been found between nIrS and fMrI measurements of cerebral tissue oxygenation levels over various cortices (Kleinschmidt et al. 1996; Strangman et al. 2002). nIrS bears further limitations (Bourdillon and Perrey 2012) such as bias from skin blood flow variations, since the light trav-erses the skin and the bone layers before entering the tissue of interest. According to tew et al. (2010) such changes due to skin effects can be considered negligible compared to the changes in the brain tissue.
Since the two McAs supply ~80 % of global cBF (lindegaard et al. 1987), we used transcranial Doppler ultrasound to measure bilateral McAv as an index of global cBF changes. McAv has been shown to reflect changes in cBF assessed with the direct Fick method dur-ing initial exposure to high altitude (roy et al. 1968). Sato et al. (2012) found good agreement between McAv and internal carotid artery blood flow changes (measured by duplex ultrasonography) during exercise from moderate (60 % ˙VO2peak) to high intensity (80 % ˙VO2peak). they
further demonstrated that the relative contribution of the internal carotid artery (and therefore McA) to global cBF remained relatively unchanged (~65 %) at high intensity exercise. As such, we contend that McAv is a reasonable
index of changes in global cBF from rest to heavy exer-cise. nevertheless, we cannot exclude variations between different areas of the brain.
During the richalet test and the tt we measured SpO2 with an oximeter. Only during the tt we repeatedly meas-ured SaO2 in capillary earlobe blood samples. Since
dur-ing the tt SpO2 dropped below 65 %, below the range in which values are reliable (70 to 100 % following the manufacturer’s instructions), we used SaO2, collected at rest and at 5th, 10th, and 15th km of the tt. SaO2 was not
corrected for temperature changes during the tt; however, an increase in body core temperature from 37 to 39 °c dur-ing exercise would only have modified SaO2 from 0.968 to 0.970 in normoxia and from 0.640 to 0.641 in hypoxia [estimations made using the OSA program, (Siggaard-Andersen 1974, 2003)].
Perspectives
there may be a trade-off between aerobic performance at moderate high altitude and extreme altitude, the former improving with a brisk ventilatory response to hypoxia, the latter with a blunted response. It would therefore be inter-esting to relate the routine results of the richalet test not only to altitude illness but also to altitude performance (for example highest altitude reached, summit success) and to complement the test with cBF, frontal lobe nIrS measure-ments and cognitive performance tests, if possible repeated upon return from altitude.
Conclusions
We found that the results of the richalet test were not pre-dictive of the impairment of 15 km time-trial cycling per-formance in severe hypoxia. Since the hypoxia-caused decrease in SaO2 and in prefrontal brain HHb during the tt correlated with the decrease in tt performance, mass oxygen supply to the brain during the tt seemed limited by hypoxia, leaving the hypothesis that brain oxygenation may play a limiting role for global exercise in conditions of severe hypoxia to be tested further.
References
Ainslie Pn, Ogoh S (2010) regulation of cerebral blood flow in mammals during chronic hypoxia: a matter of balance. Exp Phys-iol 95:251–262
Amann M, Kayser B (2009) nervous System Function during Exer-cise in Hypoxia. High Alt Med Biol 10:149–164
Amann M, romer lM, Subudhi AW et al (2007) Severity of arterial hypoxaemia affects the relative contributions of peripheral mus-cle fatigue to exercise performance in healthy humans. J Physiol 581:389–403
Bernardi l, Schneider A, Pomidori l et al (2006) Hypoxic ventila-tory response in successful extreme altitude climbers. Eur respir J 27:165–171
Bourdillon n, Perrey S (2012) What does cerebral oxygenation tell us about central motor output? neuroimaging. cogn clin neurosci. doi:10.5772/23609
Bourdillon n, Mollard P, letournel M et al (2009) Interaction between hypoxia and training on nIrS signal during exercise: contribution of a mathematical model. respir Physiol neurobiol 169:50–61
Brugniaux JV, Hodges AnH, Hanly PJ, Poulin MJ (2007) cer-ebrovascular responses to altitude. respir Physiol neurobiol 158:212–223
calbet JAl, lundby c (2009) Air to muscle O 2 delivery during exer-cise at altitude. High Alt Med Biol 10:123–134
calbet JAl, robach P, lundby c (2009) the exercising heart at alti-tude. cell Mol life Sci 66:3601–3613
chapman rF, Emery M, Stager JM (1999) Degree of arterial desatu-ration in normoxia influences VO2max decline in mild hypoxia. Med Sci Sports Exerc 31:658–663
Ekblom B, Huot r, Stein EM, thorstensson At (1975) Effect of changes in arterial oxygen content on circulation and physical performance. J Appl Physiol 39:71–75
Fan J-l, Kayser B (2013) the effect of adding cO2 to hypoxic inspired gas on cerebral blood flow velocity and breathing during incremental exercise. PloS One 8:e81130
Fan J-l, Bourdillon n, Kayser B (2013) Effect of end-tidal cO2 clamping on cerebrovascular function, oxygenation, and per-formance during 15-km time trial cycling in severe normobaric hypoxia: the role of cerebral O2 delivery. Physiol rep 1:e00066 Ferretti g, Moia c, thomet JM, Kayser B (1997) the decrease of
max-imal oxygen consumption during hypoxia in man: a mirror image of the oxygen equilibrium curve. J Physiol 498(Pt 1):231–237 gore cJ, Hahn Ag, Scroop gc et al (1996) Increased arterial
desatu-ration in trained cyclists during maximal exercise at 580 m alti-tude. J Appl Physiol 80:2204–2210
Hackett PH, rennie D, levine HD (1976) the incidence, importance, and prophylaxis of acute mountain sickness. lancet 2:1149–1155 Hornbein tF, townes BD, Schoene rB et al (1989) the cost to the
central nervous system of climbing to extremely high altitude. n Engl J Med 321:1714–1719
Ide K, Horn A, Secher nH (1999) cerebral metabolic response to submaximal exercise. J Appl Physiol 87:1604–1608
Jørgensen lg, Perko g, Secher nH (1992) regional cerebral artery mean flow velocity and blood flow during dynamic exercise in humans. J Appl Physiol 73:1825–1830
Kayser B (2003) Exercise starts and ends in the brain. Eur J Appl Physiol 90:411–419
Kayser B, narici M, Binzoni t et al (1994) Fatigue and exhaustion in chronic hypobaric hypoxia: influence of exercising muscle mass. J Appl Physiol 76:634–640
Kleinschmidt A, Obrig H, requardt M et al (1996) Simultaneous recording of cerebral blood oxygenation changes during human brain activation by magnetic resonance imaging and near-infrared spectroscopy. J cereb Blood Flow Metab Off J Int Soc cereb Blood Flow Metab 16:817–826
Koglin l, Kayser B (2013) control and sensation of breathing during cycling exercise in hypoxia under naloxone: a randomised con-trolled crossover trial. Extrem Physiol Med 2:1
lawler J, Powers SK, thompson D (1988) linear relationship between VO2max and VO2max decrement during exposure to acute hypoxia. J Appl Physiol 64:1486–1492
lindegaard KF, lundar t, Wiberg J et al (1987) Variations in mid-dle cerebral artery blood flow investigated with noninvasive transcranial blood velocity measurements. Stroke J cereb circ 18:1025–1030
Madsen Pl, Sperling BK, Warming t et al (1993) Middle cerebral artery blood velocity and cerebral blood flow and O2 uptake dur-ing dynamic exercise. J Appl Physiol 74:245–250
Martin D, O’Kroy J (1993) Effects of acute hypoxia on the VO2 max of trained and untrained subjects. J Sports Sci 11:37–42
nishimura n, Iwasaki K, Ogawa Y, Aoki K (2010) Decreased steady-state cerebral blood flow velocity and altered dynamic cerebral autoregulation during 5-h sustained 15% O2 hypoxia. J Appl Physiol 108:1154–1161
Peltonen JE, Kowalchuk JM, Paterson DH et al (2007) cerebral and muscle tissue oxygenation in acute hypoxic ventilatory response test. respir Physiol neurobiol 155:71–81
Peltonen JE, Paterson DH, Shoemaker JK et al (2009) cerebral and muscle deoxygenation, hypoxic ventilatory chemosensitivity and cerebrovascular responsiveness during incremental exercise. respir Physiol neurobiol 169:24–35
rasmussen P, nielsen J, Overgaard M et al (2010) reduced mus-cle activation during exercise related to brain oxygenation and metabolism in humans. J Physiol 588:1985–1995
richalet JP, rathat c, Keromes A et al (1983) Plasma volume, body weight, and acute mountain sickness. lancet 1:525
richalet J-P, Herry J-P, Blein J-P (2006) Médecine de l’alpinisme et des sports de montagne. Masson, Paris, pp 258–260
richalet J-P, larmignat P, Poitrine E et al (2012) Physiological risk factors for severe high-altitude illness: a prospective cohort study. Am J respir crit care Med 185:192–198
roach rc, Kayser B (2001) Exercise and hypoxia: performance, lim-its, and training. High Alt. Explor. Hum. Adapt., Marcel Dekker. t. Hornbein and r. B. Schoene, new York, pp 663–705
roy SB, guleria JS, Khanna PK et al (1968) Immediate circulatory response to high altitude hypoxia in man. nature 217:1177–1178 rupp t, Perrey S (2008) Prefrontal cortex oxygenation and
neuro-muscular responses to exhaustive exercise. Eur J Appl Physiol 102:153–163
Sato K, Sadamoto t, Hirasawa A et al (2012) Differential blood flow responses to cO2 in human internal and external carotid and ver-tebral arteries. J Physiol 590:3277–3290
Schoene rB, lahiri S, Hackett PH et al (1984) relationship of hypoxic ventilatory response to exercise performance on Mount Everest. J Appl Physiol 56:1478–1483
Seifert t, Fisher JP, Young cn et al (2010) glycopyrrolate abolishes the exercise-induced increase in cerebral perfusion in humans. Exp Physiol 95:1016–1025
Siggaard-Andersen O (1974) the acid-base status of the blood. Wil-liams and Wilkins, Baltimore
Siggaard-Andersen O (2003) OSA.exe. charlottenlund, Denmark Smith KJ, Wong lE, Eves nD et al (2012) regional cerebral blood
flow distribution during exercise: influence of oxygen. respir Physiol neurobiol 184:97–105
Smith ZM, Krizay E, guo J et al (2013) Sustained high-altitude hypoxia increases cerebral oxygen metabolism. J Appl Physiol 114:11–18
Strangman g, culver JP, thompson JH, Boas DA (2002) A quantita-tive comparison of simultaneous BOlD fMrI and nIrS record-ings during functional brain activation. neuroimage 17:719–731 Subudhi AW, Dimmen Ac, roach rc (2007) Effects of acute hypoxia
on cerebral and muscle oxygenation during incremental exercise. J Appl Physiol 103:177–183
Subudhi AW, lorenz Mc, Fulco cS, roach rc (2008) cerebrovascu-lar responses to incremental exercise during hypobaric hypoxia: effect of oxygenation on maximal performance. Am J Physiol Heart circ Physiol 294:H164–H171
Subudhi AW, Miramon Br, granger ME, roach rc (2009) Frontal and motor cortex oxygenation during maximal exercise in nor-moxia and hypoxia. J Appl Physiol 106:1153–1158
Subudhi AW, Olin Jt, Dimmen Ac et al (2011) Does cerebral oxygen delivery limit incremental exercise performance? J Appl Physiol 111:1727–1734
tew gA, ruddock AD, Saxton JM (2010) Skin blood flow differ-entially affects near-infrared spectroscopy-derived measures of muscle oxygen saturation and blood volume at rest and during dynamic leg exercise. Eur J Appl Physiol 110:1083–1089 Van der Zee P, cope M, Arridge Sr et al (1992) Experimentally
measured optical pathlengths for the adult head, calf and forearm and the head of the newborn infant as a function of inter optode spacing. Adv Exp Med Biol 316:143–153
Van Dorp E, los M, Dirven P et al (2007) Inspired carbon dioxide during hypoxia: effects on task performance and cerebral oxygen saturation. Aviat Space Environ Med 78:666–672
Verges S, rupp t, Jubeau M et al (2012) cerebral perturbations dur-ing exercise in hypoxia. Am J Physiol regul Integr comp Physiol 302:r903–r916
Woorons X, Mollard P, Pichon A et al (2007) Moderate exercise in hypoxia induces a greater arterial desaturation in trained than untrained men. Scand J Med Sci Sports 17:431–436