ISSN 1054-6618, Pattern Recognition and Image Analysis, 2008, Vol. 18, No. 2, pp. 260–263. © Pleiades Publishing, Ltd., 2008.
Robust Classification by a Nearest Mean–Median Rule
for Generalized Gaussian Pattern Distributions
1M. G. Shevlyakova
a, V. E. Klavdiev
b, and G. L. Shevlyakov
c a École Polytéchnique Fédérale de Lausanne, 1015 Lausanne, Switzerlandb St. Petersburg State Polytechnic University, ul. Polytechnicheskaya 29, 195251 St. Petersburg, Russia c Gwangju Institute of Science and Technology, 1 Oryong-dong, Buk-gu, 500-712, Gwangju, South Korea
e-mail: [email protected], [email protected], [email protected]
Abstract—To provide stability of classification, a robust supervised minimum distance classifier based on the minimax (in the Huber sense) estimate of location is designed for the class of generalized Gaussian pattern dis-tributions with a bounded variance. This classifier has the following low-complexity form: with relatively small variances, it is the nearest mean rule (NMean), and with relatively large variances, it is the nearest median rule (NMed). The proposed classifier exhibits good performance both under heavy- and short-tailed pattern distri-butions.
DOI: 10.1134/S1054661808020107
Received November 30, 2007
1 1. INTRODUCTION
In statistical pattern recognition, pattern distribu-tions are usually unknown and may vary in a wide range from short- to heavy-tailed forms. To provide sta-bility of the classification performance under uncon-trolled departures from the assumed distribution mod-els and to protect against gross outliers in the data, var-ious approaches have been used, including nonlinear programming methods, advanced neural statistical algorithms, and robust estimation procedures [1–3].
Here we consider the simplest scalar case of super-vised classifiers, namely, the minimum distance classi-fier with the conventional decision rule
(1) where x is a pattern and and are some estimates of location for the patterns obtained from training sets. Under Gaussian pattern distributions, the use of the sample means in (1) leads to the optimal NMean-rule [3]. As the sample mean is an extremely non-robust estimate, we apply robust minimax (in the Huber sense) estimates in (1) in order to enhance the performance of classification in the conditions of uncertainty of an underlying pattern distribution.
The paper is organized as follows. In Section 2, the robust minimax (in the Huber sense) estimate of loca-tion for the class of nondegenerate pattern distribuloca-tions with a bounded variance is written out. In Section 3, a low-complexity threshold mean–median estimate of location is proposed. In Section 4, robust classifiers
1The text was submitted by the authors in English.
x–θˆ1 </> x–θˆ2,
θˆ1 θˆ2
based on minimax estimates are introduced and stud-ied. In Section 5, the conclusion is given.
2. MINIMAX ESTIMATES OF LOCATION Huber’s minimax approach [1] in robust estimation can be roughly formulated as follows: in a given class of distributions, the least favorable distribution mini-mizing Fisher information is determined and the maxi-mum likelihood method for this distribution is then applied. This approach provides a guaranteed accuracy of estimation under departures from the assumptions about an underlying distribution.
Let x1, …, xn be i.i.d. random variables with
com-mon density f(x – θ) in a convex class F. Then an
M-estimate of a location parameter θ is defined as a zero of (xi – ) = 0 with a suitable score function
ψ(x) belonging to some class Ψ [1]. The minimax approach implies the determination of the least favor-able density f* minimizing Fisher information I(f) over the class F: f* = (f) with subsequent designing of the maximum likelihood estimate (MLE) with the score function ψ* = –f*'/f*. Under rather gen-eral conditions of regularity imposed on the classes F
and Ψ, ( – θ) is asymptotically normal with vari-ance V(ψ, f) satisfying the minimax property and pro-viding the guaranteed estimation accuracy [1]
Within Huber’s minimax approach, the choice of a distribution class F determines all the subsequent stages and the character of the corresponding robust
θˆn ψ i=1 n
∑
θˆn I f∈F min arg n θˆn V(ψ* f, )≤V(ψ* f*, ) V(ψ,f). ψ Ψinf∈ f∈F sup =MATHEMATICAL THEORY
OF PATTERN RECOGNITION
PATTERN RECOGNITION AND IMAGE ANALYSIS Vol. 18 No. 2 2008
ROBUST CLASSIFICATION BY A NEAREST MEAN–MEDIAN RULE 261
procedure. In turn, the choice of distribution class depends either on the available prior information about data distributions or on the possibilities of getting this information from the data samples.
In practice there often exists prior information about the pattern distribution, for example, about its moments and quantiles. In order to raise the efficiency of robust procedures, it is advantageous to use such information in the minimax settings by introducing the correspond-ing distribution classes. Here we consider distributions different from ε-contaminated Gaussian. Henceforth, symmetry and unimodality of distributions are assumed.
In the class F1 = {f : f(0) ≥ 1/(2a) > 0} of
nondegen-erate pattern distributions with a bounded density value at the center of symmetry, the least favorable density is the Laplace [4]
Hence, we have the sign score function (x) = sgn(x)/a and the sample median mednx as the optimal
L1-norm estimate. The parameter a characterizes the
dispersion of the central part of a distribution. It is a very wide class, since any unimodal distribution den-sity with a nonzero value at the center of symmetry belongs to it.
In the class F2 = {f : σ2(f) = f(x)dx≤ } of
pat-tern distributions with a bounded variance, the Gauss-ian density is optimal, [4]
with the corresponding linear score function (x) =
x/ and the sample mean as the optimal L2-norm
estimate. Being minimax, the sample mean guarantees a reasonably good accuracy of estimation in class F2 when distribution variances are really small, and it evi-dently fails with large variances.
Since the optimal solutions in the classes F1 and F2
are qualitatively different, it is advantageous to con-sider the intersection of these classes:
(2)
The class F12 comprises qualitatively different den-sities, for example, the Gaussian, heavy-tailed ε -con-taminated Gaussian, Laplace, Cauchy (with = ∞), short-tailed densities close to the uniform, etc. In this case, the least favorable density simultaneously depends on the two parameters a and through their
f1* x( ) 1 2a --- x a ---– ⎝ ⎠ ⎛ ⎞. exp = ψ1* x2
∫
σ2 f2* x( ) 1 σ 2π --- x 2 2σ2 ---– ⎝ ⎠ ⎛ ⎞, exp = ψ2* σ2 xn F12 f : f 0( ) 1 2a --->0, σ2( ) σf ≤ 2 ≥ ⎩ ⎭ ⎨ ⎬ ⎧ ⎫ . = σ2 σ2ratio /a2, having the Gaussian and Laplace densities
as the limit cases linked by the Weber–Hermite family of distributions, which can be rather accurately approx-imated by the generalized Gaussian densities
(3)
for p ≥ 1 [4, 5]. In formula (5), β and p are the scale and shape parameters, respectively.
The corresponding minimax estimate of location has the following three branches: (i) with relatively small variances, it is the sample mean; (ii) with rela-tively large variances, it is the sample median; and (iii) with relatively moderate variances, it is a compromise between them, namely, the Lp-norm estimate with 1 <
p < 2. However, for the class of generalized Gaussian
distributions, we have a very similar result.
Theorem 1 (Shevlyakov and Vilchevski, [4]; p. 78).
In the parametric subclass of generalized Gaussian dis-tributions (3) of the class F12 of nondegenerate
distribu-tions with a bounded variance, the minimax estimate of a location parameter θ is given by the Lp-norm estimate
of the following form:
(4)
with the power p defined by
where p* satisfies the following equation
(5)
3. A LOW-COMPLEXITY THRESHOLD MEAN-MEDIAN ESTIMATE
A low-complexity approximation of the minimax estimate (4) given by Theorem 1, henceforth called the
threshold mean–median estimate, has the form
(6)
where λ is a threshold value such that 2/π≤λ≤ 2. The optimal choice of a threshold value λ can be done by solving the maximin problem
(7) σ2 fp(x; β) p 2βΓ(1/ p) --- x p βp ---– ⎝ ⎠ ⎛ ⎞ exp = θ θˆL p xi–θ p , i=1 n
∑
θ min arg = = p 2, σ2/a2≤2/π, p*, 2/π σ< 2/a2<2, 1, σ2/a2≥2, ⎩ ⎪ ⎨ ⎪ ⎧ = p*2Γ(3/ p*) Γ3 1/ p* ( ) --- σ 2 a2 ---. = θˆMM xn, σ 2 /a2≤λ, mednx, σ 2 /a2>λ, ⎩ ⎨ ⎧ = effθˆMM(p,λ) pmin∈(1 2, ) { } λ∈max(2/π,2)262
PATTERN RECOGNITION AND IMAGE ANALYSIS Vol. 18 No. 2 2008 SHEVLYAKOVA et al.
for the asymptotic efficiency eff (p, λ) of the threshold mean–median estimate of location. The pre-cise result giving the optimal value of the threshold can be formulated as follows.
Theorem 2. In the parametric subclass of
general-ized Gaussian distributions (3) of the class F12 of
non-degenerate distributions with a bounded variance, the threshold mean–median estimate of the guaranteed effi-ciency in the sense of criterion (7) is given by
(8)
or, in other words, λ = λ* = 1. The guaranteed mini-mum of efficiency is attained at the saddle point (p*,
λ*) = (1.407, 1) and is equal to the efficiencies of the sample mean and the sample median eff (p*, λ*) = eff = effmednx = 0.868.
Proof. The efficiency of the threshold mean–median
estimate depends both on the power p and the threshold
λ as follows:
(9)
where the upper and lower branches of (9) are the effi-ciencies of the sample mean and the sample median, respectively. In turn, the power p is defined through the ratio /a2 by (5). Hence, the solution of the inner
min-imization problem in (7) can be obtained by the direct comparison of the efficiencies of the sample mean and the sample median given the value of λ. These results are displayed in Table 1. From Table 1 it also can be seen that the maximum of the minimal efficiency is attained at λ = 1. Q. E. D.
From Theorem 2 it follows that the maximum loss of efficiency of the threshold mean–median estimate as compared to the precise estimate (4) of Theorem 1 can-not exceed 13%. However, the low-complexity struc-ture of estimate (8) entirely compensates this loss in its efficiency.
Finally, we deal with the following estimates: the sample mean , the sample median mednx, the
mini-θˆMM θˆMM* xn, σ 2 /a2≤1, mednx, σ 2 /a2>1, ⎩ ⎨ ⎧ = θˆMM xn effθˆMM(p,λ) Γ2 1/ p ( ) p2Γ(3/ p)Γ(2–1/ p) ---, σ2/a2≤λ, 1 Γ(1/ p)Γ(2–1/ p) ---, σ2/a2>λ, ⎩ ⎪ ⎪ ⎨ ⎪ ⎪ ⎧ = σ2 xn
max estimate (4), the mean–median estimate (8), and their adaptive versions when the characteristics of class F12 are estimated from the sample:
where x(k) is the kth order statistic (n = 2k + 1) [4, 5].
The performance of these estimates is studied both in asymptotics and on finite samples of n = 27 (this sample size originates from the practical problem of glaucoma diagnostics, for the solution of which our algorithms among others have been used) for the Gaus-sian, Laplace, Cauchy, uniform, Simpson, and general-ized Gaussian distributions. The obtained results con-firm the results of the similar studies represented in [4]: on the one hand, the minimax and mean–median esti-mates exhibit high robustness close to the sample median mednx on the heavy-tailed distributions, e.g.,
the Laplace and Cauchy; on the other hand, they are close to the sample mean for short-tailed distribu-tions like the Gaussian, Simpson, and uniform.
4. ROBUST CLASSIFIERS OF THE NEAREST MEAN TYPE: PERFORMANCE EVALUATION
In our study, we consider the following classifiers of the nearest mean type (1) based on: (i) the NMean-rule, (ii) the NMed-rule, and (iii) the NMeanMed-rule, the last having the adaptive version of the threshold mean– median estimate (8).
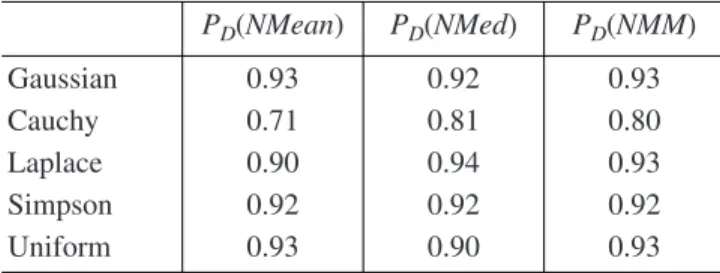
For binary classification, a Monte Carlo experiment is performed on samples n = 27 for the Gaussian, Laplace, uniform, and Simpson pattern distributions with unit variance, as well as for the extremely heavy-tailed Cauchy distribution. The classes differ in loca-tion: |θ1 – θ2| = 3.
To characterize the quality of classification, the power of classification PD is computed for each
classi-fier (in this case, the false alarm probability PF = 1 – PD)
and the number of cycles in Monte Carlo modeling is taken equal to 10000; the results of modeling are exhib-ited in Table 2.
From Table 2 it can be seen that the NMeanMed-rule is a compromise between the NMean- and NMed-rules,
θˆL p θˆMM* σˆ2 1 n–1 --- (xi–xn) 2 , i=1 n
∑
= aˆ (2fˆ 0( ))–1 (n+1)(x(k+2)–x( )k) 4 ---, = = xnTable 1. The minimal efficiency eff (p, λ) versus the value of λ
λ 2/π 0.8 0.9 1.0 1.2 1.4 1.6 2.0 (p, λ) 2/π 0.768 0.824 0.868 0.774 0.690 0.617 0.5 θˆMM min p effθ ˆMM
PATTERN RECOGNITION AND IMAGE ANALYSIS Vol. 18 No. 2 2008
ROBUST CLASSIFICATION BY A NEAREST MEAN–MEDIAN RULE 263
providing good performance both under short- and heavy-tailed pattern distributions. However, it is much closer in performance to the NMed-rule.
For short-tail distributions, the performance of all the classifiers is approximately the same; it becomes different under the heavy-tailed distributions, espe-cially for the Cauchy. In the latter case, the NMean-rule has the extremely poor performance. Also we may con-clude that the low-complexity robust NMeanMed-rule performs quite well on the chosen set of pattern distri-butions.
5. CONCLUSIONS
A low-complexity robust analogue of the nearest mean classifier based on the new minimax (in the Huber sense) estimate of location has been introduced: as the particular cases, it comprises the nearest mean and the nearest median rules. The proposed classifier demonstrates good performance on a wide set of pat-tern distributions. Finally, we note that the proposed robust classification rules can be extended to the multi-variate case on the basis of a coordinate-wise approach.
REFERENCES
1. P. J. Huber, Robust Statistics (Wiley, New York, 1981). 2. A. K. Jain, R. P. W. Duin, and J. Mao, “Statistical Pattern
Recognition: A Review,” IEEE Trans. on Pattern Analy-sis and Machine Intelligence 22, 4–37 (2000).
3. R. P. W. Duin, “A Note on Comparing Classifiers,” Pat-tern Recognition Lett. 17, 529–536 (1996).
4. G. L. Shevlyakov and N. O. Vilchevski, Robustness in Data Analysis: Criteria and Methods (Utrecht, VSP, 2002).
5. G. L. Shevlyakov and K. S. Kim, “Robust Minimax Detection of a Weak Signal in Noise with a Bounded Variance and Density Value at the Center of Symmetry,” IEEE Trans. on Information Theory 52 (3), 1206–1211 (2006).
Table 2. Performance of classifiers
PD(NMean) PD(NMed) PD(NMM) Gaussian 0.93 0.92 0.93 Cauchy 0.71 0.81 0.80 Laplace 0.90 0.94 0.93 Simpson 0.92 0.92 0.92 Uniform 0.93 0.90 0.93 NMM = NMeanMed.
Maya Shevlyakova received an
MS in Applied Mathematics from St. Petersburg State Polytechnic Uni-versity, St. Petersburg, Russia in 2006. Her work was devoted to statis-tical analysis of medical data. At present, she is a M.S. student in applied statistics at École Polytéchnique Fédérale de Lausanne, Lausanne, Swit-zerland, working on the application of statistical methods to genetics analysis.
Vladimir Klavdiev received an
MS in Fluid Mechanics from the Len-ingrad Polytechnic Institute, Lenin-grad, Russia in 1971 and a PhD in Engineering Cybernetics from the CVUT, Prague, Czechoslovakia in 1981.
Since 1981 he has been with the Department of Applied Mathematics at St. Petersburg State Polytechnic University as an Associate Professor. His research interests include statis-tics, data analysis, information theory, and mathematical logic. He has published more than 40 papers.
Georgy Shevlyakov received an
MS in Control and System Theory (summa cum laude) and a PhD in Sig-nal Processing and Information The-ory from the Leningrad Polytechnic Institute, Leningrad, Russia in 1973 and 1976, respectively. In 1991, he received a Dr. Sci. in Mathematical and Applied Statistics from the St. Petersburg Technical University, St. Petersburg, Russia.
From 1976 to 1979, he was with the Biometrics Group at the Vavilov Research Institute in Leningrad as a Research Associate. From 1979 to 1986, he was with the Department of Mechanics and Control Pro-cesses at the Leningrad Polytechnic Institute as a Senior Researcher working in the field of robust statistics and signal processing. From 1986 to 1992, he was with the Department of Mathematics of the St. Petersburg Technical University as an Associate Professor, and from 1992 as a Professor. He is currently a Visiting IT Professor at the Department of Infor-mation and Communications, Gwangju Institute of Science and Technology (GIST), Korea. His research interests include robust and nonparametric statistics, data analysis, and queuing and information theory along with their applica-tions to signal processing. He has published a monograph on robust statistics (2002), a textbook on probability and math-ematical statistics (2001), and more than 70 papers. He is a member of the IEEE and Bernoulli societies.