RESEARCH PAPER
Development, validation, and application of a novel LC-MS/MS
trace analysis method for the simultaneous quantification of seven
iodinated X-ray contrast media and three artificial sweeteners
in surface, ground, and drinking water
Waldemar Ens&Frank Senner&Benjamin Gygax& Götz Schlotterbeck
Received: 19 December 2013 / Revised: 4 February 2014 / Accepted: 19 February 2014 / Published online: 4 March 2014 # Springer-Verlag Berlin Heidelberg 2014
Abstract A new method for the simultaneous determination of iodated X-ray contrast media (ICM) and artificial sweet-eners (AS) by liquid chromatography-tandem mass spectrom-etry (LC-MS/MS) operated in positive and negative ionization switching mode was developed. The method was validated for surface, ground, and drinking water samples. In order to gain higher sensitivities, a 10-fold sample enrichment step using a Genevac EZ-2 plus centrifugal vacuum evaporator that pro-vided excellent recoveries (90±6 %) was selected for sample preparation. Limits of quantification below 10 ng/L were obtained for all compounds. Furthermore, sample preparation recoveries and matrix effects were investigated thoroughly for all matrix types. Considerable matrix effects were observed in surface water and could be compensated by the use of four stable isotope-labeled internal standards. Due to their persis-tence, fractions of diatrizoic acid, iopamidol, and acesulfame could pass the whole drinking water production process and were observed also in drinking water. To monitor the fate and occurrence of these compounds, the validated method was applied to samples from different stages of the drinking water production process of the Industrial Works of Basel (IWB). Diatrizoic acid was found as the most persistent compound which was eliminated by just 40 % during the whole drinking water treatment process, followed by iopamidol (80 % elim-ination) and acesulfame (85 % elimelim-ination). All other com-pounds were completely restrained and/or degraded by the
soil and thus were not detected in groundwater. Additionally, a direct injection method without sample preparation achieving 3–20 ng/L limits of quantification was compared to the de-veloped method.
Keywords Iodinated X-ray contrast media . Artificial sweeteners . Liquid chromatography-mass spectrometry . Trace analysis . Drinking water production
Introduction
In the past, increasing attention has been given to the contam-ination of aquatic environment by pharmaceutical compounds and artificial sweeteners (AS). Iodinated X-ray contrast media compounds (ICM) (Table1) are the most widely used phar-maceutical compounds for intravascular administration [1]. Very high doses up to 200 g ICM per patient are administered for medical X-ray imaging to increase the contrast between organs or vessels that could otherwise not be examined due to low X-ray absorption [2]. Artificial sweeteners (AS; Table1) are used as sugar substitutes in the food and beverage industry, but also to give pharmaceuticals a sweet taste [3]. The large number of sweeteners available to the product developer enables the creation of sweet-tasting products without the calorie contribution of traditional sugars, as they are not decomposed as carbohydrates [4].
ICM and AS are used in large quantities throughout the world. Since they are metabolically stable, they are excreted mainly unchanged from the human body via urine or feces and reach the aquatic environment daily via sewage systems [3,5]. These compounds have become chemicals of emerging cern to the public because of their high environmental con-centrations and their potential to leak through wastewater-W. Ens
:
F. Senner:
B. GygaxIndustrielle Werke Basel, Margarethenstrasse 40, 4002 Basel, Switzerland
G. Schlotterbeck (*)
FHNW University of Applied Sciences and Arts Northwestern Switzerland, School of Life Sciences, Gründenstrasse 40, 4132 Muttenz, Switzerland
e-mail: [email protected] DOI 10.1007/s00216-014-7712-0
treatment plants (WWTP) and even reach drinking water [2,6,
7]. Although ICMs and AS are believed not to be harmful, any subtle effects of mixtures, their metabolites, or other micropollutants are currently unknown and may pose ecolog-ical or human health issues. Given the very low biodegrad-ability of some of these compounds, they also may accumulate in the environment [8].
Hirsch et al. [9] found iopamidol, diatrizoic acid, iomeprol, iopromide, ioxithalamic acid, and iothalamic acid at almost the same levels in influents and effluents of municipal WWTP
[2]. Whereas the AS saccharin and cyclamate are usually degraded by more than 90 % during wastewater treatment, acesulfame and sucralose pass through wastewater treatment plants mainly unchanged [6]. The elevated concentrations of ICM and AS in the aquatic environment can thus be explained by their persistence. Their polar character and stability against environmental degradation enable them to persist in the aquat-ic environment. These properties and their high concentrations in wastewater make these compounds ideal tracers for waste-water in surface and groundwaste-water [6,10].
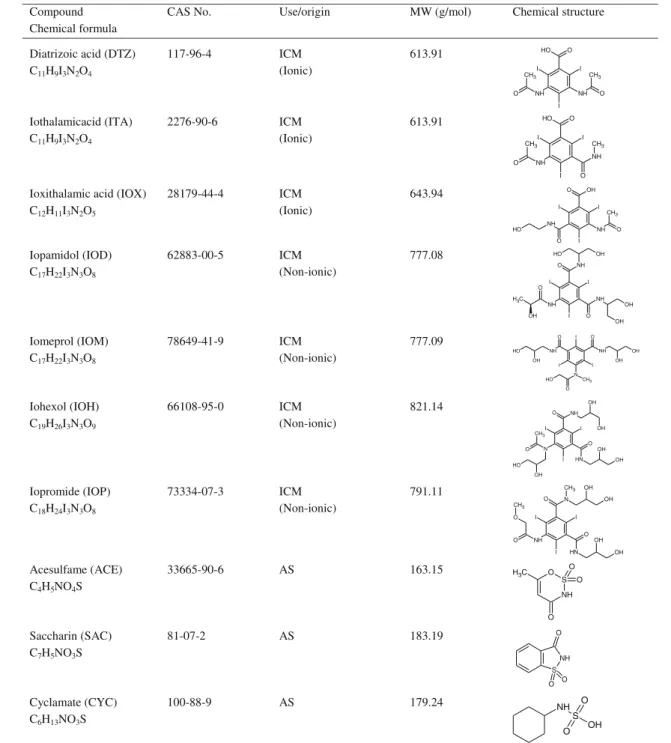
Table 1 Chemical structure, CAS number, and molecular weight of the investigated iodinated X-ray contrast media (ICM) and artificial sweeteners (AS) Compound
Chemical formula
CAS No. Use/origin MW (g/mol) Chemical structure
Diatrizoic acid (DTZ) C11H9I3N2O4 117-96-4 ICM (Ionic) 613.91 NH I I NH CH3 O I O H O CH3 O Iothalamicacid (ITA) C11H9I3N2O4 2276-90-6 ICM (Ionic) 613.91 NH O O I I I O NH O H CH3 CH3
Ioxithalamic acid (IOX) C12H11I3N2O5 28179-44-4 ICM (Ionic) 643.94 NH O O I I I OH O NH O H CH3 Iopamidol (IOD) C17H22I3N3O8 62883-00-5 ICM (Non-ionic) 777.08 NH NH NH O O O I I I OH OH O H OH OH C H3 Iomeprol (IOM) C17H22I3N3O8 78649-41-9 ICM (Non-ionic) 777.09 N I I CH3 O I NH O NH O O H H O H O O OH H Iohexol (IOH) C19H26I3N3O9 66108-95-0 ICM (Non-ionic) 821.14 N N H NH O O O I I I OH OH OH CH3 OH O H OH Iopromide (IOP) C18H24I3N3O8 73334-07-3 ICM (Non-ionic) 791.11 N NH N H O O I I I O OH OH CH3 OH OH O CH3 Acesulfame (ACE) C4H5NO4S 33665-90-6 AS 163.15 S NH O O O O C H3 Saccharin (SAC) C7H5NO3S 81-07-2 AS 183.19 S NH O O O Cyclamate (CYC) C6H13NO3S 100-88-9 AS 179.24 S NH O O OH
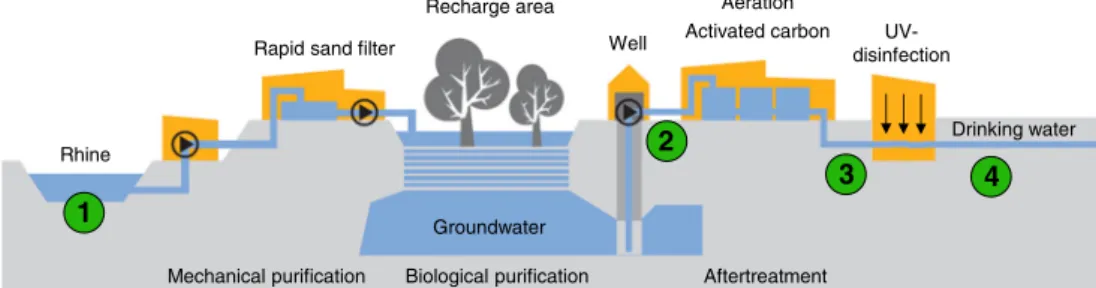
Recently, concentrations of some ICM and the AS acesulfame exceeded the International Association of Water Works in the Rhine Basin (IAWR) target values of 0.1μg/L for ICM and 1μg/L for AS in the Rhine river, particularly in the lower stretch of the Rhine downstream of Mainz [11,12]. Especially non-ionic ICM such as iopamidol, iomeprol, and iopromide were present at concentrations in the higher nano-gram per liter range in the Higher and Upper Rhine, since these non-ionic ICM are used preferentially in Switzerland. Acesulfame was the predominant AS with almost 10 times higher concentrations than the other AS in Rhine samples taken in Basel, Karlsruhe, Mainz, Cologne, and Düsseldorf [11,12]. Due to their persistence, proportions of some of these compounds such as diatrizoic acid, iopamidol, and acesulfame could pass the whole drinking water purification stages and were detected in drinking water. The Industrial Works of Basel (IWB) provide about 50 % of Basel City’s (northwestern part of Switzerland) drinking water for its 200,000 inhabitants. It applies a worldwide unique system for the drinking water production (Fig.1) by artificial groundwater enrichment at the groundwater recharge plant“Lange Erlen”. Here, forested recharge areas are flooded with surface water from the Rhine River. By seeping through the soil, the water is purified mechanically and biologically. To further purify the ground-water, deacidification, activated carbon filtration, and UV disinfection are applied before drinking water is provided to consumers [13].
Solid-phase extraction (SPE) combined with liquid chro-matography (LC)-electrospray ionization (ESI)-tandem mass spectrometry (MS/MS) is the leading analytical methodology for the determination of ICM [9, 14–17] and AS [3, 18], achieving quantification limits in the order of tens of nano-grams per liter. However, SPE methods can suffer from poor recovery [14,19], are time consuming, and expensive, espe-cially when sequential SPE columns are used [16,20].
In their reviews, Perez et al. [2], Lange et al. [6], and Kokotou et al. [7] compare methods for the determination of ICM and AS; however, to date, no LC-MS/MS method has been reported for the simultaneous determination of ICM and
AS. Combined analysis of ICM and AS remains difficult using a single mode of separation and extraction owing to their different physicochemical properties and polarities. Moreover, it requires positive and negative ionization switching modes, since ICM are usually measured in positive and AS in negative mode. Furthermore, to our knowledge, there is no method reported, neither for ICM nor for AS that reaches limits of quantification (LOQs) below 10 ng/L with-out using SPE enrichment.
The aim of this study was to develop a simple, sensitive, and robust method for the quantification of ICM and AS to regularly monitor the presence of these compounds at all stages of the drinking water production process. In this work, we describe a novel, sensitive, robust, and validated LC-MS/ MS method for the simultaneous quantification of seven ICM and three important AS (Table1) by applying a sample en-richment step through centrifugal vacuum evaporation. The method has been extensively validated on surface, ground, and drinking water and was applied to samples from different stages of the drinking water production process of the IWB. The developed method provides a less labor-intensive sample preparation and increased sample throughput while being sensitive and robust.
Materials and methods Chemicals
All reference compounds (10μg/mL, ICM in acetonitrile, AS in water) were purchased from Neochema GmbH & Co. KG (Bodenheim/Mainz, Germany). For additional quality control (QC), diatrizoic acid, iopamidol, iomeprol, iopromid, and iohexol were purchased from Dr. Ehrenstorfer GmbH (Augsburg, Germany); iothalamic acid and ioxithalamic acid from a different batch as the reference compounds from Neochema GmbH & Co. KG (Bodenheim/Mainz, Germany); and acesulfame potassium, saccharin, and sodium cyclamate from Dr. Ehrenstorfer GmbH (Augsburg, Germany). All
Rhine
Mechanical purification Biological purification Aftertreatment
Rapid sand filter
Recharge area Well
Groundwater
Aeration
Activated carbon
UV-disinfection
Drinking water
1
2
3 4
Fig. 1 Simplified scheme of the IWB drinking water production process in Basel (CH). The Rhine water (1) is first roughly purified by quartz sand filters (fast filtration system) before it is distributed over forested recharge areas in the“Langen Erlen”. Several wells pump up groundwater from a depth of about 8–15 m. The collected groundwater (2) is then further
purified by activated carbon filters in five basins (each with an activated carbon layer of about 2.5 m height). The activated carbon filter effluent (3) is then irradiated by UV light for disinfection what yields the ready drinking water (4). 1–4 Main sampling points in this work
QC compounds were of analytical grade (>92 %). Diatrizoic acid-d6, iopamidol-d8, acesulfame-d4, and saccharin-13C6 were purchased from TRC Inc. (Toronto, Canada) and used as internal standards.
Prior to every analysis, standard mixtures of ICM and AS with concentrations of 10 and 100 μg/L were pre-pared in order to build the calibration curve. Additional QC stock solutions with a concentration of 100 mg/L were prepared using methanol for ICM and methanol/ water 50:50 for AS.
An internal standard stock solution was prepared by dis-solving 1 mg of each stable isotope-labeled compound with methanol to a concentration of 10 mg/L. By diluting the stock solutions with nanopure water, an internal standard mixture with a final concentration of 50 μg/L was prepared, from which 10 μL was spiked to every sample prior to the enrichment. Of the aliquots of the IS mix, 800 μL were stored at −20 °C.
LC/MS-grade methanol, water, ammonium formate, am-monium acetate, formic acid, and acetic acid were supplied by Sigma-Aldrich (Steinheim, Germany). Evian water was pur-chased from H. Zysset (Basel, Switzerland). Nanopure water was prepared by a Thermo Scientific Barnstead Nanopure purification system (Thermo Fisher Scientific, New Hampshire, USA).
Sampling and sample preparation
Rhine water, collected groundwater before and after the active carbon filters, as well as drinking water samples were collected at different days over a period of 2 months, to follow concentration fluctuations of ICM and AS and examine the fate of ICM and AS in the drinking water production process.
All samples were collected in 250-mL amber glass bottles and stored in the dark at 4 °C until analysis within 2 weeks. Sample preservation was not necessary.
A 10-fold sample enrichment was performed in order to yield lower limits of quantification (<10 ng/L) than with direct injection. For quantification, all samples including calibration and control solutions were concen-trated on a Genevac EZ-2 Plus vacuum centrifuge from Stepbios GmbH (Muttenz, Switzerland). Ten-milliliters of water samples were filled into 15 mL Pyrex test tubes (VWR, Dietikon, Switzerland) and IS was added. The complete water amount was then evaporated over-night at a maximum temperature of 54 °C. The precip-itate was reconstituted in 1 mL of eluent A. After 10 min sonification and 10 min shaking, the samples were filtered with 0.2 μm nylon syringe filters from Infochroma (Zug, Switzerland) before submitting for LC-MS/MS analysis.
Liquid chromatography–mass spectrometry
All high-performance liquid chromatography (HPLC)-ESI-MS/MS measurements were performed using an Ultimate 3000 rapid separation LC-System from Dionex (Germering, Germany) equipped with a solvent degasser unit, a binary pump, an autosampler with three 40 vial plates and a temperature-controlled autosampler. The injection volume was 80 μL. A Zorbax Eclipse XDB C18 column (50× 4.6 mm, 1.8 μm) coupled to a Zorbax Eclipse XDB-C18 (12.5×4.6 mm, 5μm) guard column from Agilent Technolo-gies AG (Basel, Switzerland) was chosen for separation.
The gradient program was applied as follows: 0–6.4 min, 98–80 % A; 6.4–7 min, 80–5 % A; 7–9 min, 5 % A; 9–10 min, 5–98 % A; and 10–12 min, 98 % A. For elution, a constant flow rate of 0.5 mL/min was applied at a column temperature of 40 °C. To avoid potential carryover, before each injection, the needle of the injector was rinsed in the injection port with 200 μL methanol. To monitor instrumental and laboratory contaminations, regular instrument blanks were measured every five to 10 injections as well as blanks collected from certain sampling points.
The HPLC system was connected to an AB Sciex QTRAP 5500 mass spectrometer (Concord, Canada) fitted with an electrospray interface operated in positive and negative mode. Nitrogen provided by a nitrogen generator (Atlas Copco, Studen, Switzerland) was used as nebulizer, desolvation, as well as collision gas. Instrument control and data acquisition were performed with AB Sciex Analyst 1.6.2 linked to Dionex Chromatography MS Link 2.12.0. The ESI interface was operated for the analysis of ICM in positive mode with an ion spray voltage of +5.5 kV and an entrance potential of +10 V, whereas AS were analyzed in negative mode with an ion spray voltage of 4.5 kV and an entrance potential of−10 V. For both modes, a heater temperature of 600 °C, an ion source gas 1=60 and 2=50 psi, and a curtain gas of 25 psi were used. Both quadrupoles (Q1 and Q3) operated in unit mass resolution. In order to gain highest sensitivity, the analytes were measured in the scheduled MRM (sMRM) mode which allows monitoring each analyte only across its expected elution time.
To optimize MS and MS/MS parameter, single compound standard solutions with a concentration of 10 μg/mL were prepared in a 50/50 (v:v) mixture of eluents A and B and were directly infused into the MS. For each ICM compound, an automated compound optimization was performed in order to figure out the two most sensitive transitions and the optimal parameters for the declustering potential, collision energy, and cell exit potential. For all ICM except for iomeprol and iohexol, ammonium adducts were used as precursor ions. MS parameters for AS were adopted from Scheurer et al. [3]. Table 2 shows MRM transitions with the optimized MS parameters and the corresponding internal standard, used for quantification.
Quantification and identification
Identification was accomplished via the chromatographic re-tention time and the ratio between the two most intense MRM transitions (quantifier and qualifier). For quantification a 7-point calibration including a 0 concentration was measured and a linear calibration curve (Analyte Conc./IS Conc. vs. Analyte Area/IS Area) was created. Due to the relatively large working range, a“1/x weighting” was utilized. The calibration curve was built in Evian water since the matrix of Evian water is more similar to the sample matrices than the matrix of nanopure water in terms of salt and DOC concentrations.
Due to similarity of the chemical structure, diatrizoic acid-d6 was used as internal standard for the quantification of diatrizoic acid, iothalamic acid and ioxithalamic acid, iopamidol-d8for iopamidol, iopromide, iomeprol and iohexol, acesulfame-d4for acesulfame, and saccharin-13C6for saccharin and cyclamate. All samples were spiked with a concentration of 50 ng/L of internal standard prior to the enrichment. Recoveries between 80 and 120 % for all compounds were achieved.
Method validation
For the determination of the linearity, a 10-point calibration curve was set up in Evian water ranging from 2.5 to 500 ng/L for ICM and 2.5 to 1600 ng/L for AS. Each calibration level
was analyzed twice and the peak area ratios of the target analytes and their corresponding internal standard were cal-culated by the quantification function of Analyst 1.6.1, as well as the coefficients of determination (R2
). For the analysis, the working ranges were set at 10–500 ng/L for ICM and 10– 1600 ng/L for AS.
The LOQs were calculated corresponding to the ICH guideline [21] as 10 times the S/N ratio by injecting an enriched 10 ng/L calibration solution. The noise levels of the single transitions of the calibration solution were compared to the ones in Rhine, ground, and drinking water, whereby no significant differences could be observed.
The repeatability was determined by measuring 10 repli-cates of the lower working range limit (10 ng/L) as well as 10 replicates of the upper working range limit (ICM, 500 ng/L; AS, 1,600 ng/L).
For investigation of the intermediate precision, the same Rhine, ground, and drinking water samples were spiked and measured in six series of measurements within 2 weeks. The concentrations were calculated via daily calibration curves.
Matrix effects and sample enrichment recoveries were investigated according to Ordonez et al. [22] by spiking samples either before or after the sample enrichment proce-dure with the same amount of analytes (n=3). All samples were spiked with 250 ng/L ICM and 500 ng/L AS. The response factor of the spiked samples was compared to the Table 2 Retention times, MRM transitions (quantifier and qualifier), and corresponding internal standards used for quantification and optimized MS parameters
Compound Retention
time (min)
MRM transition (m/z)
Internal standard DP (V) CE (eV) CXP (V)
Diatrizoic acid 4.2 632/361 638/367 (DTZ-d6) 50 35 10 632/233 57 18 Iopamidol 3.7 795/778 803/786 (IOD-d8) 56 17 24 778/559 186 31 16 Iomeprol 5.3 778/405 IOD-d8 176 57 12 778/687 31 20 Iopromide 7.2 809/792 IOD-d8 176 35 16 792/573 40 17 26 Iohexol 5.1 822/804 IOD-d8 171 29 24 822/375 61 10 Iothalamic acid 4.5 632/615 DTZ-d6 51 17 18 615/487 23 10 Ioxithalamic acid 3.6 662/645 DTZ-d6 61 17 20 645/302 151 57 8 Acesulfame 3.0 162/82 166/86 (ACE-d4) −35 −20 −11 162/78 −42 −1 Saccharin 5.1 182/42 188/42 (SAC-13C 6) −75 −48 −3 182/106 −26 −5 Cyclamate 6.7 178/80 SAC-13C 6 −35 −38 −1 178/96 −38 −1
Italicized mass transitions were used for quantification
response factor of a calibration curve, not undergoing the sample enrichment procedure. Thus, three response factors were obtained: calibration standard (R1), samples spiked be-fore enrichment (R2), and samples spiked after enrichment (R3). Hence, matrix effects were calculated as 100×R3/R1 and the recovery for the sample enrichment step as 100×R2/ R3.
To determine total recovery, the calibration samples were just as the samples submitted to the enrichment procedure to compensate the loss through sample preparation. In order to compensate matrix effects, the total recovery was calculated by taking internal standards into account and was investigated for all three matrices by five measurement series. Therefore, depending on the amount already present in the samples and the priority of the compounds, approximately the excepted amount already present in a sample was spiked in order to obtain meaningful values. Priority was given to iopamidol and acesulfame. Therefore, surface water was spiked with 250 ng/L ICM and 500 ng/L AS, groundwater with 50 ng/L ICM and 500 ng/L AS, and drinking water with 25 ng/L ICM and 50 ng/L AS. Five measurement series were performed within 5 weeks.
To ensure the quality of the reference compounds, addi-tional quality control samples were measured. Therefore, a concentration of 25 ng/L ICM and 50 ng/L AS was prepared in Evian water and measured with every series of measure-ment in order to monitor the accuracy.
By means of the total recovery and the accuracy from the QC samples, the measurement uncertainty was estimated ac-cording to ISO 17025 by a series of four measurements. Thereby, the random deviation was determined by measuring four times the recovery of identically spiked samples and the systematic deviation by measuring four identically prepared control standards.
Samples of all three matrix types were stored at 4 °C in brown glass bottles and measured regularly over a time period of 2 weeks. This experiment was repeated three times.
Results and discussion
LC-MS/MS method development
To find out HPLC eluent composition that yields the best MS sensitivity, solutions of the two most important ICMs (diatrizoic acid and iopamidol) were prepared. Different addi-tives with various combinations of ammonium acetate (NH4Ac) and ammonium formate (NH4Fo) as buffers and formic acid (FA) and acetic acid (AA) as pH modifiers were tested by direct infusion into the MS. The combination of 5 mmol/L ammonium formate and 0.1 % formic acid yielded the highest intensities and was therefore chosen for the HPLC method.
The requirements for the HPLC column were the ability to manage large sample loadings and provide a satisfying sepa-ration within a reasonable time frame. After screening various C18 and C8 columns, best results were achieved with a Phenomenex Synergi Fusion-RP C18 (3×100 mm, 2.5μm) and an Agilent Zorbax Eclipse-XDB C18 (50 × 4.6 mm, 1.8μm). Baseline separation was achieved with the Synergi column for most compounds except for iohexol and iomeprol. However, lower LOQs due to sharper peaks and shorter run times were achieved with the Agilent Zorbax Eclipse-XDB column. This column benefits from smaller particles and reduced column length compared to the Phenomenex Synergi Fusion. The chromatograms obtained with this column in positive and negative ionization switching modes are shown in Figure 2.
Although no baseline separation could be achieved for some compounds with the Zorbax Eclipse XDB column, all peaks except for diatrizoic acid and iothalamic acid (Fig.2a) could be isolated through their specific MS/MS transitions (see Table2). Diatrizoic acid and iothalamic acid have partial-ly the same transitions, since the molecules are very similar and have the same molecular mass. Nevertheless, the achieved HPLC separation was sufficient for further analysis. All com-pounds were unequivocally confirmed on basis of retention time and a compound specific qualifier ion.
Typically, acidic solutions favor positive ion mode analysis while basic solutions favor negative ion mode analysis. That is also the reason why Scheurer et al. [3] applied a post column addition of a strong base in order to facilitate the ionization of some weekly acidic sweeteners. However, in the case of acesulfame, saccharin, and cyclamate, which all have pKa values around 2, acidic LC conditions (pH=4) were appropri-ate for ESI ionization in negative mode.
Since switching between negative and positive ionization mode could lead to a significant loss of sensitivity, a crucial point for low LOQs was that the two important AS, acesulfame and saccharin, were well separated from the two important ICM, iopamidol and diatrizoic acid (Fig. 2a, b). Where the detection windows of acesulfame and iopamidol overlapped, a noise increase could be observed.
Method validation
Initially, it was intended to develop a direct injection method without sample preconcentration. However, the obtained LOQs were slightly too high for our requirements, but still very impressive for such a straightforward method. Thus, a brief discussion of some results of the direct injection method is given. In order to test whether a direct injection would be possible, it was decided to investigate ICM and AS in two separate methods. For the same reason, instead of 80 μL, 100 μL were injected. By injecting a solution of 10 ng/L and calculating the S/N ratio of 10/1, LOQs ranging between
3 and 20 ng/L (diatrizoic acid, 5 ng/L; iopamidol, 10 ng/L; acesulfame, 3 ng/L) for all 10 compounds were obtained. LOQs for all compounds were not higher than 10 ng/L, except for iohexol with an LOQ of 20 ng/L. In addition, the precision was determined by injecting six times a con-centration of 10 ng/L. The CV for all compounds was ≤12 %. Furthermore, matrix effects were estimated by comparing standard calibration solutions in Evian water with spiked samples of surface, ground, and drinking water. Except for acesulfame (50–60 % recovery), no significant matrix effects were observed for all matrices. Total recoveries were obtained by taking internal stan-dards into account and ranged between 83 and 110 %.
However, since the working range should cover 10 to 500 ng/L for ICM and 10 to 1600 ng/L for AS, respectively, LOQs≤10 ng/L for all compounds are needed. Hence, the direct injection method did not yield sufficient sensitivity. Therefore, a sample enrichment step was incorporated.
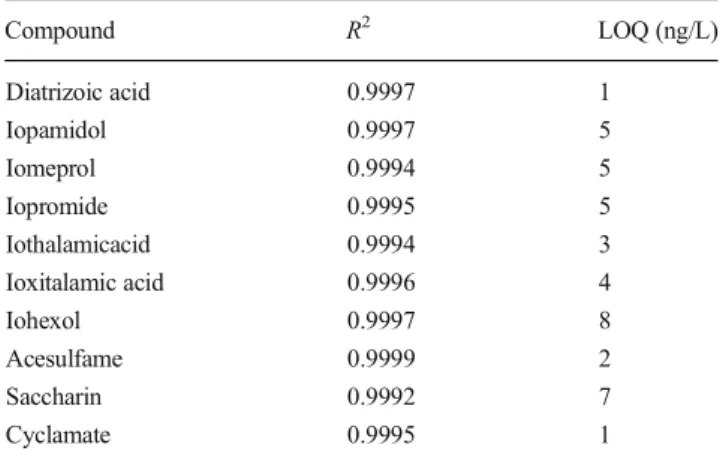
The 10-point calibration curve was found to be linear over a working range of 10–500 ng/L for ICM and 10–1600 ng/L for AS. The coefficients of determination were higher than 0.999 for all compounds (Table3), what points out the high accuracy of the method.
Based on a sample volume of 10 mL, which was 10-fold concentrated by evaporation, LOQs below 10 ng/L could be achieved for all compounds (see Table3).
The precision of the 10 replicates was excellent with rela-tive standard deviation values ranging between 3 and 6 % for
the lower working range limit and 1 and 3 % for the upper working range limit.
The intermediate precision for surface, ground and drink-ing water ranged between 2 and 10 % with an average preci-sion for the 10 compounds of 5 % for surface and drinking water and 4 % for groundwater.
Sample preparation recoveries and matrix effects were investigated for all three matrix types: surface, ground, and drinking water. As shown in Fig. 3a, sample preparation recovery was almost similar for all compounds with an excel-lent average recovery of 90±4 % and an average RSD of 2 % for triplicate injections.
XIC of +MRM (16 pairs): Exp 1, 632.000/361.000 amu Expected RT: 4.2 ID: Diatrizoic acid from Sample 10 (2-50ng ) of Wiederfindung 1.wiff (Turb... Max. 2.9e4 cps.
1.0 2.0 3.0 4.0 5.0 6.0 7.0 8.0 9.0 10.0 11.0 Time, min 0.0 2000.0 4000.0 6000.0 8000.0 1.0e4 1.2e4 1.4e4 1.6e4 1.8e4 2.0e4 2.2e4 2.4e4 2.6e4 2.8e4 Intensity, cps IOD IOT IOH IOP ICM (ESI+)
XIC of -MRM (8 pairs): Exp2, 162.000/82.000 amu Expected RT: 3.0 ID: Acesulfame from Sample 10 (2-50ng ) of Wiederfindung 1.wiff (Turbo Spr... Max. 1.4e4 cps.
1.0 2.0 3.0 4.0 5.0 6.0 7.0 8.0 9.0 10.0 11.0 Time, min 0.0 1000.0 2000.0 3000.0 4000.0 5000.0 6000.0 7000.0 8000.0 9000.0 1.0e4 1.1e4 1.2e4 1.3e4 1.4e4 1.5e4 1.6e4 1.7e4 Intensity , cps CYC AS (ESI-) IOX IOM SAC DTZ ACE
Fig. 2 Extracted ion chromatograms of seven ICM measured in positive ESI mode and three AS measured in negative ESI mode at a concentration of 50 ng/L
Table 3 Linear regression determined by a 10-point calibration curve (n=2) and LOQs calculated with a S/N ratio of 10
Compound R2 LOQ (ng/L) Diatrizoic acid 0.9997 1 Iopamidol 0.9997 5 Iomeprol 0.9994 5 Iopromide 0.9995 5 Iothalamicacid 0.9994 3 Ioxitalamic acid 0.9996 4 Iohexol 0.9997 8 Acesulfame 0.9999 2 Saccharin 0.9992 7 Cyclamate 0.9995 1
As shown in Fig.3b, matrix effects occurred especially in Rhine water. For all ICM, ion enhancement was observed in this matrix type. However, in ground and drinking water, no significant matrix effects could be observed for all compounds except acesulfame. For this, ion suppression led to recoveries of about 60 %.
Most likely, the enhancement effect can be attributed to the high salt concentration in Evian water, which leads to an ion suppression in the calibration solution. On the other hand, ground and drinking water have higher salt concentrations than Rhine water and are hence more similar to Evian water. Thus, it could be expected that relative to the salt rich Evian water, the less salt containing Rhine water exerts less ion suppression. However, the focus of our investigations is on
ground and drinking water. Therefore, Evian water is a good reference to investigate possible matrix effects.
Matrix effects for compounds like the ionic ICM diatrizoic acid, ioxithalamic acid, and iothalamic acid are very similar. Therefore, diatrizoic acid-d6can be used as internal standard for these three compounds. For the same reason, iopamidol-d8 was used for iopamidol, iomeprol, iopromide, and iohexol and saccharin-13C6for saccharin and cyclamate.
To investigate the total recovery, calibration samples were also submitted to sample enrichment. In addition, internal standards were taken into account for the recovery calculation. As presented in Fig.3c, good results were obtained with mean recoveries from five independent measurement series between 78 and 113 %, covering all three matrices. Especially 0% 20% 40% 60% 80% 100% 120%
DTZ IOD IOM IOP IOT IOX IOH ACE SAC CYC
Recov e ry -s ample
preparation Rhine waterGround water
Drinking water
a
0% 20% 40% 60% 80% 100% 120% 140% 160%DTZ IOD IOM IOP IOT IOX IOH ACE SAC CYC
Recov ery -matrix ef fects Rhine water Ground water Drinking water
b
0% 20% 40% 60% 80% 100% 120% 140%DTZ IOD IOM IOP IOT IOX IOH ACE SAC CYC
T o tal recov e ry Rhine water Ground water Drinking water
c
Fig. 3 Recoveries (n=3) for the sample enrichment step (a), matrix effects investigated by spiking 250 ng/L ICM and 500 ng/L AS (b), and total recoveries (c) for Rhine, ground, and drinking water
for the three most important compounds, diatrizoic acid, iopamidol, and acesulfame recoveries were found almost 100 % with relative standard deviations ≤5 % for all three matrices.
The measurement uncertainties were estimated by four measurement series. For the most relevant compounds, mea-surement uncertainties were determined as 18 % for diatrizoic acid, 27 % for iopamidol, and 11 % for acesulfame.
Stabilization is of special importance for nonpersistent AS such as saccharin and cyclamate, especially when dealing with surface or wastewater samples [6]. Van Stempvoord et al. [23] did some stability tests in waste and groundwater and found that the concentration of cyclamate declined within 3 weeks in refrigerated samples, whereas acesulfame and saccharin were stable during this period.
Our investigations showed that for all three matrices, no significant concentration changes (<15 %) occurred during 2 weeks of storage at 4 °C.
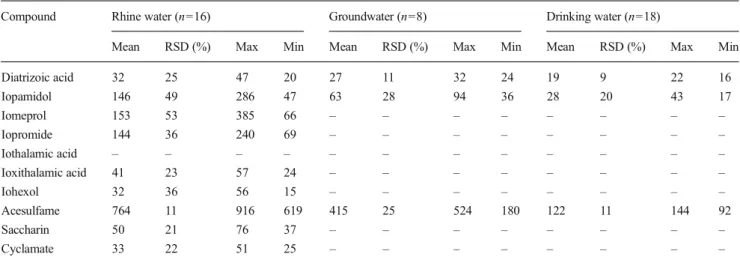
Application to Rhine, ground, and drinking water samples The developed and validated analytical method was applied to the determination of ICM and AS in different water samples including surface, ground, and drinking water from the IWB drinking water production process. Therefore, Rhine water, collected groundwater from 13 wells and drinking water sam-ples were measured. Table 4 shows the calculated mean concentrations, the relative standard deviation, and the measured max and min values for each compound. Except for iothalamic acid, all compounds were detected in Rhine water in Basel. Highest concentrations were found for the non-ionic ICM iopamidol (146 ng/L), iomeprol (153 ng/L), and iopromide (144 ng/L) and for acesulfame (764 ng/L).
Iomeprol, iopromide, ioxithalamic acid, iohexol, saccharin, and cyclamate were neither detected in ground nor in drinking water samples (below LOQ).
The attenuation of the concentrations is a result of different processes during percolation through the soil (e.g., biodegra-dation, dissolution, and sorption) and depends on the resi-dence time in the soil. However, it can be assumed that degradation plays a major role, since the results are in accor-dance with the reported behavior of iomeprol, iopromide, and iohexol during bank filtration [24,20,25]. The removal of saccharin and cyclamate through soil also fits with the find-ings of Scheurer et al. [26]. They confirmed their degrada-tion in several tested waterworks using biologically active treatment units like river bank filtration (RBF) or artificial groundwater recharge.
Diatrizoic acid, iopamidol, and acesulfame, however, were detected in all ground (27, 63, and 415 ng/L) and drinking water (19, 28, and 122 ng/L) samples (Table 4). Figure 4
presents the reduction of concentrations of these compounds during the drinking water production process, created with normalized mean concentrations from Table4.
Table 4 Concentrations (ng/L) of ICM and AS in Rhine, collected ground and drinking water from the drinking water production process measured between March and April 2013
Compound Rhine water (n=16) Groundwater (n=8) Drinking water (n=18)
Mean RSD (%) Max Min Mean RSD (%) Max Min Mean RSD (%) Max Min
Diatrizoic acid 32 25 47 20 27 11 32 24 19 9 22 16 Iopamidol 146 49 286 47 63 28 94 36 28 20 43 17 Iomeprol 153 53 385 66 – – – – – – – – Iopromide 144 36 240 69 – – – – – – – – Iothalamic acid – – – – – – – – – – – – Ioxithalamic acid 41 23 57 24 – – – – – – – – Iohexol 32 36 56 15 – – – – – – – – Acesulfame 764 11 916 619 415 25 524 180 122 11 144 92 Saccharin 50 21 76 37 – – – – – – – – Cyclamate 33 22 51 25 – – – – – – – – 100%87% 60% 100%43% 19% 100%54% 16% 0% 20% 40% 60% 80% 100% 120% 140% DTZ IOD ACE Normalized concentration Rhine water Ground water Drinking water
Fig. 4 Decrease of relative concentrations during soil passage (ground-water) and by activated carbon filtration/UV irradiation (drinking (ground-water)
Diatrizoic acid was found to be the most persistent com-pound. About 60 % of its initial concentration in Rhine water could still be detected in drinking water, whereas about 15– 20 % of iopamidol and acesulfame persisted throughout the purification process (see Fig.4).
In order to estimate the removal by the five activated carbon filters in use (see Fig. 1) and to investigate the influence of UV irradiation on the concentration, indi-vidual measurements were performed with samples of the activated carbon filter influent and effluent (n=3, respectively) as well as samples directly before and after UV irradiation (n=3, respectively). These measurements showed that diatrizoic acid was removed to about 14 ± 8 %, iopamidol to 52 ± 6 %, and acesulfame to 60 ±1 % through activated carbon filtration (average for all five activated carbon basins) whereas samples measured after UV irradiation showed consistently lower concentrations than samples measured prior to it. Thereby, diatrizoic acid concentration decreased by 25 ± 5 %, iopamidol by 19 ± 8 %, and acesulfame by 30 ±5 %.
Measurements of individual effluents of the five activated carbon basins showed that the adsorption through activated carbon filters depends strongly on the quality of the activated carbon material. The five activated carbon filters had an age about 3–15 months during this work. The newest filter (3 months; load, ~20 m3/kg) could adsorb up to 100 % of acesulfame, 20 % of diatrizoic acid, and 65 % of iopamidol of the influent concentration.
Conclusion
A sensitive LC-MS/MS method was developed which allows the simultaneous quantification of seven ICM and three AS in surface, ground, and drinking water. The method combines the analysis of the two compound classes in a single chro-matographic run. Instead of using labor-intensive SPE, an easy sample preparation was performed by applying a sample enrichment step through centrifugal vacuum evaporation in order to achieve LOQs below 10 ng/L. The developed method supports increased sample throughput and is less labor inten-sive and cheaper than comparable methods using SPE enrich-ment. Validation confirmed the high linear working range, high sensitivity, and robustness of the method. The use of four isotope-labeled internal standards enabled compensation of matrix effects and facilitated accurate quantification. The method was successfully applied to Rhine, ground, and drink-ing water samples. Statements about the occurrence and fate of these compounds in the drinking water production process of the IWB could be made.
Acknowledgments This work was mainly performed during the Mas-ter Thesis of Mr. Waldemar Ens at FHNW University of Applied Sciences Northwestern and Arts, School of Life Sciences in the laboratories of IWB Basel [27]. We kindly acknowledge the helpful discussions and the support and of Richard Wülser, IWB Basel.
References
1. Christiansen C (2005) Toxicology 209:185–187
2. Pérez S, Barceló D (2007) Anal Bioanal Chem 387:1235–1246 3. Scheurer M, Brauch H-J, Lange FT (2009) Anal Bioanal Chem 394:
1585–1594
4. Wilson R (2007) Sweeteners, 3rd edn. Wiley, Chichester
5. Busetti F, Linge KL, Blythe JW, Heitz A (2008) J Chromatogr A 1213:200–208
6. Lange FT, Scheurer M, Brauch HJ (2012) Anal Bioanal Chem 403: 2503–2518
7. Kokotou MG, Asimakopoulos AG, Thomaidis NS (2012) Anal Methods 4:3057–3070
8. Wolf L, Zwiener C, Zemann M (2012) Sci Total Environ 430:8–19 9. Hirsch R, Ternes TA, Lindart A, Haberer K, Wilken RD, Fresenius J
(2000) Fresenius J Anal Chem 366:835–841 10. Fono LJ, Sedlak DL (2007) Water Res 41:1580–1586
11. Arbeitsgemeinschaft Wasserwerke Bodensee-Rhein e.V (2011) 42. Jahresbericht 2010. Geschäftsstelle der Arbeitsgemeinschaft Wasserwerke Bodensee-Rhein (AWBR), Freiburg
12. Arbeitsgemeinschaft Rheinwasserwerke e.V (2011) 67. Jahresbericht 2010. Geschäftsstelle der Arbeitsgemeinschaft Rhein Wasserwerke e.V. (ARW), Köln
13. D. Rüetschi (2004) Basler Trinkwassergewinnung in den Langen Erlen, Ph.D. dissertation, University of Basel
14. Sacher F, Lang FT, Brauch HJ, Blankenhorn I (2001) J Chromatogr A 938:199–210
15. Sacher F, Raue B, Brauch HH (2005) J Chromatogr A 1085:117–123 16. Putschew A, Schittko S, Jekel M (2001) J Chromatogr A 930:127–
134
17. Carballa M, Omil F, Lema JM, Llompart M, Garcia-Jares C et al (2004) Water Res 38:2918–2926
18. Buerge IJ, Buser H-R, Kahle M, Müller MD, Poiger T (2009) Environ Sci Technol 43:4381–4385
19. Ternes T, Bonerz M, Herrmann N, Löffler D, Keller E, Bagó B, Alder A (2005) J Chromatogr A 1067:213–223
20. Putschew A, Wischnack S, Jekel M (2000) Sci Total Environ 255: 129–134
21. International Conference on Harmonisation of Technical Requirements for Registration of pharmaceuticals for human use (1996). Validation of analytical procedures: text and methodology Q2(R1)
22. Ordonez EY, Quintana JB, Rodil R, Cela R (2012) J Chromatogr A 1256:197–205
23. Stempvoort DRV, Roy JW, Brown SJ, Bickerton G (2011) J Hydrol 401:126–133
24. Kormos JL, Schulz M, Ternes TA (2011) Environ Sci Technol 45: 8723–8732
25. Seitz W, Jiang J-Q, Weber WH, Lloyd BJ, Maier M, Maier D (2006) Environ Chem 3:35–39
26. Scheurer M, Storck FR, Brauch H-J, Lange FT (2010) Water Res 44: 3573–3584
27. Ens W (2013) FHNW University of Applied Sciences Northwestern and Arts, School of Life Sciences