HAL Id: inserm-00599324
https://www.hal.inserm.fr/inserm-00599324
Submitted on 9 Jun 2011
HAL is a multi-disciplinary open access
archive for the deposit and dissemination of
sci-entific research documents, whether they are
pub-lished or not. The documents may come from
teaching and research institutions in France or
abroad, or from public or private research centers.
L’archive ouverte pluridisciplinaire HAL, est
destinée au dépôt et à la diffusion de documents
scientifiques de niveau recherche, publiés ou non,
émanant des établissements d’enseignement et de
recherche français ou étrangers, des laboratoires
publics ou privés.
Genome-wide profiling of G protein-coupled receptors in
cerebellar granule neurons using high-throughput,
real-time PCR.
Benjamin Maurel, Anne Le Digarcher, Christelle Dantec, Laurent Journot
To cite this version:
Benjamin Maurel, Anne Le Digarcher, Christelle Dantec, Laurent Journot. Genome-wide profiling of G
protein-coupled receptors in cerebellar granule neurons using high-throughput, real-time PCR.. BMC
Genomics, BioMed Central, 2011, 12 (1), pp.241. �10.1186/1471-2164-12-241�. �inserm-00599324�
M E T H O D O L O G Y A R T I C L E
Open Access
Genome-wide profiling of G protein-coupled
receptors in cerebellar granule neurons using
high-throughput, real-time PCR
Benjamin Maurel
1,2,3,4†, Anne Le Digarcher
1,2,3,4†, Christelle Dantec
1,2,3,4,5and Laurent Journot
1,2,3,4,5*Abstract
Background: G protein-coupled receptors (GPCRs) are major players in cell communication, regulate a whole range of physiological functions during development and throughout adult life, are affected in numerous pathological situations, and constitute so far the largest class of drugable targets for human diseases. The corresponding genes are usually expressed at low levels, making accurate, genome-wide quantification of their expression levels a challenging task using microarrays.
Results: We first draw an inventory of all endo-GPCRs encoded in the murine genome. To profile GPCRs genome-wide accurately, sensitively, comprehensively, and cost-effectively, we designed and validated a collection of primers that we used in quantitative RT-PCR experiments. We experimentally validated a statistical approach to analyze genome-wide, real-time PCR data. To illustrate the usefulness of this approach, we determined the repertoire of GPCRs expressed in cerebellar granule neurons and neuroblasts during postnatal development. Conclusions: We identified tens of GPCRs that were not detected previously in this cell type; these GPCRs
represent novel candidate players in the development and survival of cerebellar granule neurons. The sequences of primers used in this study are freely available to those interested in quantifying GPCR expression comprehensively.
Background
GPCRs are seven transmembrane-domain receptors that are selectively activated by a wide array of ligands such as hormones, neurotransmitters, metabolites, odorants, pheromones, gustatory molecules and photons. They constitute as much as 3-6% of the genes encoded in the mammalian genomes [1]. Endo-GPCRs, i.e. those GPCRs that have a demonstrated or putative endogen-ous ligand, represent about one fourth of all GPCRs; the remaining ones are activated by odorants, pheromones, gustatory molecules and light. From a functional point of view, GPCRs have a role in virtually every physiologi-cal function [2]. It is therefore not surprising that approximately 45% of clinically relevant molecules target a GPCR [3]. Furthermore, ~35% of all endo-GPCRs are
orphans, i.e. they have no identified ligand, and consti-tute an attractive reservoir of pharmacological targets.
It is of major interest to many academic and pharma/ biotech scientists to determine the repertoire of GPCRs expressed in a given tissue or cell type, for instance to identify novel pharmacological targets in a murine model of a human disease. Furthermore, the remodeling of the GPCR repertoire during the development of the pathology in such a model may help prioritize which GPCRs should be targeted first.
Most cells express a small number of a given GPCR protein at their surface. Accordingly, these genes are usually expressed at low levels [4], which makes their accurate quantification by microarray-based detection systems challenging. RNA deep sequencing has the power to accurately determine expression levels of weakly expressed genes, at the expense of costs, how-ever. Real-time RT-PCR is reputedly more sensitive than microarrays, but its throughput was limited until recently. Real-time PCR machines in the 384-, 1,536-, 3,200- or 9,216-well format became recently available
* Correspondence: laurent.journot@igf.cnrs.fr
†Contributed equally
1
Institut de Genomique Fonctionnelle, 141 rue de la cardonille, F-34094 Montpellier Cedex 05, France
Full list of author information is available at the end of the article
© 2011 Maurel et al; licensee BioMed Central Ltd. This is an Open Access article distributed under the terms of the Creative Commons Attribution License (http://creativecommons.org/licenses/by/2.0), which permits unrestricted use, distribution, and reproduction in any medium, provided the original work is properly cited.
and affordable. This prompted us to develop a collection of primers that can be used in real time RT-PCR experi-ments to characterize GPCR expression genome-wide. We first draw an inventory of all endo-GPCRs encoded in the murine genome. We then designed and validated a collection of primers for quantitative RT-PCR experi-ments, and selected adequate statistical tests. To illus-trate the usefulness of this approach, we determined the repertoire of GPCRs expressed in cerebellar granule neurons and neuroblasts during postnatal development. We identified tens of GPCRs that were not detected previously in this cell type; these GPCRs represent novel candidate players in the development and survival of cerebellar granule neurons.
Results and discussion
Identification of endo-GPCRs
Our first aim was to identify endo-GPCRs encoded by the murine genome as comprehensively as possible. We ori-ginally started from Unigene clusters annotated as “receptor”, and manually sorted known GPCRs and seven transmembrane- (7TM) proteins. At that step, we excluded 7TM receptors related to odorant and phero-mone receptors. To discover genes encoding novel 7TM receptors, we blasted the murine genome with the trans-membrane domain of the 263 7TM proteins selected from Unigene. The process was reiterated with novel sequences not annotated as GPCR in the original Uni-gene set until no novel sequence could be discovered. The transcription of the sequences identified in this way was confirmed by searching the murine EST database. This strategy allowed us to identify 382 murine endo-GPCRs, which are listed in Additional file 1. The number of GPCR we identified is in line with previous studies that used bioinformatics and/or literature mining [4-8].
A special point should be made regarding the murine Mas-related family of GPCR (Mrgpr). As shown pre-viously [9,10], the murine Mrg family consists of six sin-gle-copy genes (Mrgprd, Mrgpre, Mrgprf, Mrgprg, Mrgprh/Gpr90, and Mas1), as well as three large subfa-milies (Mrgpra, Mrgprb, and Mrgprc) that together com-prise about 50 distinct sequences. Members of the
Mrgprasubfamily are poorly characterized, and many of
them are predicted sequences or gene models that have no or very few experimental supporting data. The
Mrgprc family members are all pseudo-genes that do
not encode GPCRs [9]. As far as expression patterns are concerned, Mrgprd and the members of the Mrgpra family are expressed exclusively in the sensory neurons and in the trigeminal ganglia [9]. In contrast, Mrgprb1-5, Mas1, Mrgpre, Mrgprf, Mrgprg, and Mrgprh/Gpr90 are not expressed in dorsal root ganglia [9]. We there-fore decided to focus on members of the Mrgpra sub-family that have been sufficiently characterized
(Mgrpra1-4, Mrgpra6), members of the Mrgprb subfam-ily (Mrgprb1-5, Mrgprb10), and the six single-copy Mrgpr. Because ambiguity could not be resolved, we did not include in the GPCR collection 9 sequences with homologies to the Mrgpra family and 4 sequences with homologies to the Mrgprb family. It is therefore likely that additional members of the Mas-related family of GPCR do exist.
In addition to GPCRs, we also included in our analysis 7 genes encoding proteins that are not GPCR but rather alter GPCR pharmacology and/or coupling specificity. The Ramp1-3 (Receptor activity modifying protein) genes encode single transmembrane proteins that physi-cally interact with receptors for calcitonin (Calcr) and calcitonin gene-related peptide (Calcrl). These 2 GPCRs are activated by a range of peptides, namely calcitonin, amylin, calcitonin gene-related peptide, adrenomedullin and intermedin/adrenomedullin 2, depending on the Ramp with which they interact [11]. In addition, effi-cient signal transduction by Calcr and Calcrl requires interaction with Crcp [12]. Knowledge about Ramp1-3 and Crcp expression is mandatory to interpret data about Calcr and Calcrl expression. These 4 genes were then included in the primer collection and annotated as ‘GPCR-modifiers’. For similar reasons, we designed pri-mers aimed at quantifying transcripts encoding the 3 secreted frizzled proteins, i.e. Sfrp1, Sfrp2 and Sfrp3/Frzb [13]. These genes are also included in Additional file 1.
Design and validation of a primer collection for real-time PCR
Primers aimed at quantifying GPCR transcripts are available. One collection is far from comprehensive however, as it targets 274 GPCRs only [14]. The other commercially available collections are not comprehen-sive and not experimentally validated [8,15].
Further-more, the commercial collections rely on Taqman®
probes, which ensure high specificity, but display lower
sensitivity than SybrGreen®-based detection systems
(see Additional file 2 for a comparison of 8 randomly selected Taqman assays to the corresponding primers used in this study). To be as comprehensive, sensitive, and reliable as possible, we designed and validated pri-mer pairs suitable for quantification of every GPCR we
identified using SybrGreen®-based detection systems.
We focused exclusively on coding sequences, as the identification of the open reading frame (ORF) of a pre-viously uncharacterized GPCR transcript is greatly facili-tated by the characteristic 7TM topology. We therefore felt more confident in targeting the ORF region rather than the untranslated regions, specially for gene models and transcripts reconstructed from genomic sequences.
The validation of a primer pair requires the assessment of the specificity and efficiency of the amplification
Maurel et al. BMC Genomics 2011, 12:241 http://www.biomedcentral.com/1471-2164/12/241
process, which in turn is possible only if the correspond-ing matrix is available. Because a number of the target GPCRs has never been studied previously, no corre-sponding sequence cloned in a plasmid is available; nor is available information about the pattern of the GPCR expression, which precluded the use of cDNAs. Hence we favored primers located in the same exon to allow the validation of the primer pairs using genomic DNA rather than cDNA or plasmids. This strategy is possible only if the cDNA mix that is to be used in real experiments is completely devoid of genomic DNA, which was routinely achieved by treatment of the RNA samples with RNase-free Dnase (data not shown). To validate each primer pair we performed real-time PCR with 6 different amounts of genomic DNA from100 pg (~50 copies of an autosomal gene) to 20 ng (~10,000 copies). We plotted the threshold cycle (Ct) vs. the log of the amount of input genomic DNA, and measured the slope and the
correlation coefficient (r2) of the resulting linear
regres-sion straight line, and the Ct for 1 ng of input genomic DNA. We considered that a primer pair is acceptable if, in 2 independent tests, the slope was above -3.6 (>90% amplification efficiency), the correlation coefficient was above 0.95 and the Ct(1 ng) was below 30.
The specificity of the amplification product was veri-fied in each experiment by inspection of the amplicon melting curve, which is expected to display a single peak at a temperature close to the theoretical amplicon melt-ing temperature. Approximately 10% of the amplicons were loaded on an agarose gel to verify their size, and were sequenced on both strands. The sequences of the primers used in this study are available in the Additional file 3.
Statistical analysis and normalization of PCR data
The next step was the selection of statistical tests suita-ble for testing differences in the expression levels of genes across the samples to be analyzed. The large scale, real-time PCR studies reported above either did not perform statistics or used parametric tests to test for differences in transcript abundance among samples. None of these studies corrected for multiple testing, which is obviously required given the large number of statistical tests to be performed in a single experiment. Parametric tests are more efficient than non-parametric tests in detecting differences between groups of values, but the distribution of the random variable should be known a priori. Student’s t-test for instance assumes a Gaussian distribution. Similarly, although ANOVA does not call for normality, it is sensitive to heteroscedasti-city. It was therefore important to determine if the PCR data can be assumed to be normally distributed, and whether the variance is dependent on initial target abundance or not. We randomly selected 9 primer pairs
with GC-content ranging from 46 to 60% (Additional file 4) from the GPCR collection, and performed 64 replicate PCR on 50 pg, 500 pg, and 5 ng of genomic DNA. We plotted the distribution of the Ct values (Additional files 5, 6, 7, 8, 9, 10, 11, 12 and 13), and tested the normality of the distribution using a whole range of statistical tests (Additional file 4). Surprisingly, out of 9 primer pairs tested with 3 amounts of input genomic DNA, 55% produced a bimodal or a non-Gaus-sian distribution in at least one condition. Furthermore, 2/3 of the primers tested displayed a standard deviation that increased with decreased amount of input genomic DNA (Additional file 4), indicating heteroscedasticity. We concluded that we cannot assume the distribution of PCR data to be normal and homoscedastic, and we cannot routinely use parametric tests with high through-put PCR data. Similar experiments performed on 1 and 4 ng of cerebellar cDNAs led to the same conclusion (data not shown). Accordingly, we analyzed the PCR data using the Wilcoxon signed-rank and Kruskal-Wallis tests with Benjamini-Hochberg correction for multiple testing [16] as implemented in the non parametric mod-ule of the MeV 4.2 package [17]. For Kruskal-Wallis test, post-hoc tests were performed with the XLStat software (AddinSoft).
For real experiments, 2 rounds of normalization were routinely performed. To eliminate the plate-to-plate PCR variability, the data were normalized using the geo-metric average of ‘house keeping’ genes expression levels in a way similar to the one proposed by Vandesompele and co-workers [18]. However, in contrast to the setting by Vandesompele and co-workers, each PCR plate com-prised a single cDNA sample and primer pairs for multi-ple genes, including the selected reference genes. The level of expression of each GPCR “X” was normalized to the geometric mean of the expression levels of the selected reference genes, R1 to R3, in the same PCR plate according to the formula:
X 3 √R 1xR2R3 = 2 Ct(X)− Ct(R1) + Ct(R2) + Ct(R3) 3 .
The MeV 4.2 package [17] was used for further pro-cessing and analysis of the data. To reduce the variabil-ity introduced by reverse transcription (RT), the normalized, log2-transformed PCR data obtained from individual RT were mean-centered and scaled in SD units.
GPCR regulation during apoptosis of cerebellar granule cells
In the nervous system, GPCRs are critically involved during the embryonic development. For instance, Sonic Hedgehog (Shh) and Frizzled (Fz) are critical players in
brain patterning by controlling the activity of several GPCRs, i.e. Smoothened (Smo) and Wnt family mem-bers, respectively. In the adult brain, GPCRs are key modulators of synaptic activity. Accordingly, they are targeted by most psycho-active molecules.
To illustrate the usefulness of the high throughput PCR approach, we and others performed tissue profiling, which gives a static view of the GPCR repertoire in a mixture of cell types [8,19]. In the present work, we focused on a more dynamic setting, and monitored the remodeling of the GPCR repertoire in a single neuronal subtype. We used a cellular model of neuronal develop-ment that was previously studied in the laboratory [20,21], and which is highly appropriate for population-based studies using techniques such as microarrays and PCR. Cerebellar granule neurons (CGNs) constitute the most abundant neuronal population in the mammalian central nervous system, and can be cultured in vitro up to 98% homogeneity. Cerebella were collected at P7, which corresponds to the very ending of the granule neuroblast expansion period in vivo. The neuroblasts complete their last division approximately 1 day after plating, and exit the cell cycle to enter differentiation in a synchronous process. After 7 days in culture, the CGNs are fully differentiated and functional. The whole culture process takes place in the presence of depolariz-ing concentrations of potassium chloride ([KCl] = 25 mM; K25) that induce a phasic electrical activity. Depo-larization is presumed to mimic the endogenous excita-tory activity that is required for CGN survival during cerebellar development in vivo (Ikonomidou et al., 1999). Lowering [KCl] to 5 mM (K5) in the absence of serum triggers apoptosis [22]. This mimics the naturally occurring death that takes place in the external granular layer of newborn rodent cerebellum [23]. This apoptosis process is fully dependent on new RNA and proteins synthesis [22], and we previously identified genes regu-lated early after CGN apoptosis induction using micro-arrays [20]. Although a role for GPCR activation in preventing potassium withdrawal-induced apoptosis of CGNs is abundantly documented, we observed the regu-lation of a very limited number of genes encoding GPCRs in our previous microarray-based study. One reason might be that the regulation of GPCR activity during the apoptotic process does not involve gene reg-ulation. An alternative explanation is the reputed lack of sensitivity of microarrays, which prompted us to use the very same samples as those used in our previous study [20] to monitor GPCR expression in K25- vs. K5-treated CGN cultures.
We first draw the distribution of GPCR expression levels in K25 culture (Figure 1). We observed 3 popu-lations of GPCRs. The vast majority of GPCRs (298) were expressed at very low levels (< median + 3.5
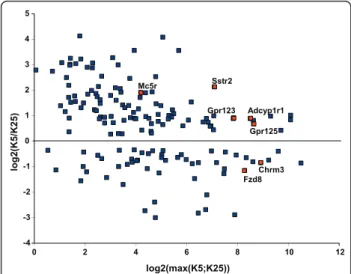
interquartile (IQR) range). In contrast, 38 GPCRs were abundantly expressed, i.e. >median + 10.5 IQR. A third population of GPCRs (46) displayed intermediate expression levels. With the notable exception of Mc5r that belongs to this intermediate population, those GPCRs that were shown to be differentially expressed (DE) using microarrays [20], i.e. Sstr2, Chrm3, Gpr125, Gpr123, Fzd8 and Adcyp1r1, were all among the most abundantly expressed GPCRs. These genes were also found as DE genes using the Wilcoxon signed-rank test with Benjamini-Hochberg correction on our qPCR data (Figure 2). In addition, we identified tens of DE GPCRs that were not identified using microarrays (Additional file 14). As shown on the MA plot dis-played on Figure 2, most of the DE GPCRs with large fold-changes correspond to weakly expressed GPCRs. In contrast those DE GPCRs that were abundantly expressed displayed lower fold-changes. This confirms that the qPCR approach is more sensitive and has a larger dynamic range in fold-change than the microar-ray-based approach. ! "! #!! #"! $!! $"! %&'()*+,-./-01'-22+& /*-3-* !"#$%&'(')*+,-#'$&."/01%/.$-"'/%&2"3 4!5" !5" #5" $5" 65" 75" "5" 85" 95" :5" ;5" #!5"
4
Figure 1Distribution of the abundance of transcripts encoding
G protein-coupled receptors in differentiated cerebellar granule neurons. Transcripts encoding 382 GPCRs were quantified in cerebellar granule neurons grown in vitro for 7 days (DIV 7) using real-time PCR. The distribution of transcript abundance was plotted with intervals equal to the interquartile range (IQR; the difference between the first and third quartile). The majority (298) of GPCRs are expressed at very low levels, i.e. between median - 0.5 IQR and median + 3.5 IQR. A population of 46 GPCRs displays intermediate expression levels (median + 4.5 IQR to median + 9.5 IQR), and 38 GPCRs are expressed above median + 10 IQR. The medium to high population of GPCRs likely corresponds to the physiologically most relevant GPCRs.
Maurel et al. BMC Genomics 2011, 12:241 http://www.biomedcentral.com/1471-2164/12/241
Interestingly, numerous GPCRs whose activation were previously shown to result in anti-apoptotic activity in this model, e.g. Adcyap1r1 [24], Gabbr2 [25]..., were found DE using the qPCR approach. As the CGNs were collected as early as 4 hours after potassium withdrawal, i.e. far before the first biochemical and morphological stigmata of apoptosis were discernible, it is likely that CGNs attempt to counteract the pro-apoptotic insult in part by up-regulating GPCRs whose activity is poten-tially beneficial, provided the cognate ligand is present in the extracellular milieu.
GPCR regulation during post-natal development of cerebellar granule cells
Because of its stereotyped organization, the development of the cerebellum has been extensively studied [26]. The migration, proliferation, survival and differentiation of mouse cerebellar granule cells is controlled by a com-plex array of transcription factors and signaling path-ways [27]. Direct GPCR ligands and modulators of GPCR activity, e.g. Shh, the Wnt proteins and Cxcl12/ Sdf1, were shown to control different aspects of cerebel-lar granule differentiation, survival and positioning.
However, the role of the majority of GPCRs expressed by cerebellar granule neuroblasts and neurons remains largely undefined.
We used the same in vitro culture model to monitor the repertoire of GPCRs expressed by cerebellar neuro-blasts and during the postnatal differentiation and maturation of CGNs. Additional file 15 shows those GPCRs that were detectable in at least one condition, i. e. displayed Ct below 30 in at least 3 out of 15 PCR reactions. Not surprisingly, we found a number of GPCRs that were previously shown to influence various aspects of the CGN developmental process such as pro-liferation, migration, cell adhesion, survival and matura-tion. Smoothened (Smo) encodes a GPCR that interacts with the Shh receptor Ptch1, and mediates the prolifera-tive action of Shh on neuroblasts [28]. Smo was highly expressed at day 0 when the proliferating neuroblasts were collected, and its expression decreased when the neuroblasts exited the cell cycle from day 1 on. Simi-larly, the most abundantly expressed GPCR at culture inception was Gpr56, that encodes an orphan GPCR controlling neuroblast adhesion [29]. Cxcr4 encodes the receptor for Cxcl12/Sdf1 (Stromal cell derived factor 1), and was shown to be essential for neuronal cell migra-tion and patterning in the cerebellum [30]. We also found high expression of those GPCRs that are markers of mature CGNs because they are involved in the con-trol of the electrical activity of these neurons, i.e. meta-botropic GABA and Glutamate receptors. In addition, we identified tens of GPCRs that were not previously shown to be expressed in CGNs (Additional file 15) and are candidate players in the development and survival of CGNs.
Among expressed GPCRs, we sought to identify those that were regulated during the developmental time course as this may be an indication of a specific role for these GPCRs during CGN differentiation A Kruskal-Wallis test with Benjamini-Hochberg correction identi-fied those GPCRs differentially expressed in at least one condition. DE GPCRs classification using a hierarchical clustering algorithm [17] revealed that a large number of GPCRs are very dynamically regulated during CGN development (Figure 3), suggesting that CG neuroblasts and mature neurons are sensitive to, at least in part, dif-ferent sets of extracellular cues.
We then sought to determine if the remodeling of the GPCR repertoire is continuous throughout the develop-mental process or whether there is a specific period at which remodeling is more active, and the GPCR reper-toire becomes fixed. We first ranked the GPCRs accord-ing to their expression levels at each time point. We then calculated for each GPCR the absolute rank differ-ence between 2 consecutive time points. The more remodeling of the GPCR repertoire, the higher the
! " # $ % %! &" &' &! &% % ! ' " ( )*+!,-./,0(10!(22 )* +! ,0 (3 0! (2 4567! 897%!' 897%!( :;<=9%7% >?;$@A7-' B<(7
Figure 2MA plot of the expression levels of G protein-coupled
receptors differentially expressed between healthy and early apoptotic cerebellar granule neurons. Mouse cerebellar granule neurons grown in vitro for 7 days (DIV 7) were incubated for 4 hours in culture medium containing 25 mM (K25) or 5 mM (K5) KCl without serum. GPCR expression levels were determined using real-time PCR, and differentially expressed GPCRs were identified using the Wilcoxon signed-rank test with Benjamini-Hochberg correction. M is the log2-transformed ratio of the normalized expression levels of each GPCR in K5 and K25. A is the log2-transformed maximum of the normalized expression levels of each GPCR in K5 and K25. Red dots indicate those GPCRs that were also identified as differentially expressed in our previous microarray study [20] using the very same RNA samples. The real-time PCR approach identified more DE GPCRs than microarrays, especially among GPCRs expressed at low to medium levels.
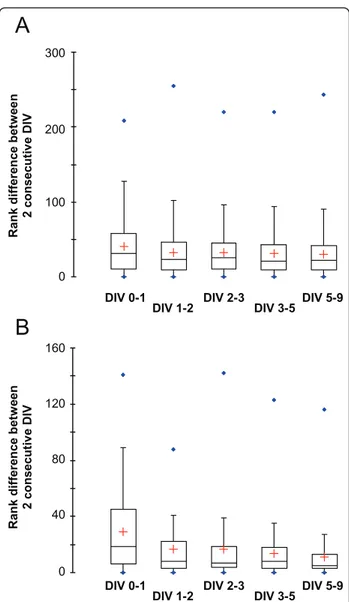
average rank difference between 2 consecutive time points. We then compared the distribution of the rank difference for the whole GPCR set (Figure 4A) and for the 50 most abundantly expressed GPCRs at DIV 9 (Fig-ure 4B). For the whole GPCR set, the average rank var-iation is similar at each time point (Figure 4A). This is due to the fact that the ranks of the majority of weakly expressed GPCRs vary more or less randomly as their expression is biologically not significant. In contrast, when only the 50 most abundantly expressed GPCRs are considered, the distributions display a decrease in the average difference between 2 consecutive time points, before and after DIV 3 (Figure 4B). This indi-cates that the repertoire of GPCRs expressed by mature, DIV9 CGNs is largely determinate at DIV3. Interest-ingly, DIV3 CGNs do not display morphological and functional features of mature CGNs such as extended neurites, synaptic connections and electrical activity. Hence, the remodeling of the GPCR repertoire precedes neurite outgrowth, establishment of synaptic connec-tions or electrical activity. Similarly, it does not depend on environmental and positional cues, which are obviously disrupted or abolished in the in vitro culture system. We concluded that the remodeling of the GPCR repertoire that occurs during postnatal CGN develop-ment is a robust, inbuilt process characteristic of CG neuroblasts exiting the cell cycle.
Conclusions
This work identified the complete repertoire of GPCR encoded by the murine genome. Based on this informa-tion, we designed and validated a collection of primer pairs that allows the specific and sensitive quantification of GPCR transcripts using real-time PCR. We showed that non parametric statistical tests should be used rou-tinely to identify variations of GPCR transcript abun-dance. Finally, we used this tool to characterize the repertoire of GPCRs expressed in cerebellar granule neurons, the most abundant central nervous system neuronal population. We showed that remodeling of the GPCR repertoire is an early event following cell cycle withdrawal of cerebellar neuroblasts, which is indepen-dent of environmental cues, neurite outgrowth and synaptic connections. This work paves the way towards the systematic identification of GPCRs expressed and regulated in murine models of human pathologies, offer-ing the potential to identify novel, drugable pharmacolo-gical targets for these pathologies.
Methods
in vitro culture of mouse cerebellar granule neuroblasts
Design of the animal research was approved by the Institut de Génomique Fonctionnelle’s ethics committee. CGN cultures were prepared from 7-day-old murine
Figure 3Hierarchical clustering of G protein-coupled receptors
differentially expressed during the development of cerebellar granule neuroblasts in vitro. Transcripts encoding 382 GPCRs were quantified using real-time PCR throughout the developmental process that leads from cerebellar granule neuroblasts to mature neurons in vitro. Data represent the average of 3 independent reverse transcription and PCR experiments. To take into account technical variations, the level of expression of each GPCR was normalized to the geometric mean of the expression levels of 3 selected reference genes, i.e. B2m, Gapdh, and Gusb. A Kruskal-Wallis test with Benjamini-Hochberg correction identified those GPCRs differentially expressed (DE) at one time point at least. Each GPCR was then expressed as the percentage of the maximal expression levels of that GPCR during the time course. DE GPCRs were classified according to their expression pattern using a hierarchical clustering algorithm as implemented in MeV 4.2.
Maurel et al. BMC Genomics 2011, 12:241 http://www.biomedcentral.com/1471-2164/12/241
pups (C57BL/6J mice, Charles River Laboratories) as described by Miller and Johnson [31] with slight modifi-cations. Briefly, freshly dissected cerebella were incu-bated for 10 min at 37°C with 0.25 mg/ml trypsin and cells were dissociated in HBSS -Ca2+ -Mg2+ in the
presence of 0.5 mg/ml trypsin inhibitor and 0.1 mg/ml DNaseI by several steps of mechanical disruption. The resulting cell suspension was centrifuged and resus-pended in K25+S medium (Basal Medium Eagle [BME] supplemented with 10% fetal bovine serum, 2 mM L-glutamine, 10 mM HEPES, penicillin-streptomycin 100 IU/ml-100 μg/ml and 20 mM KCl to achieve a final concentration of 25 mM). The cell suspension was fil-tered through a 40 μm cell strainer (Falcon) and plated in a coated dish for 25 min to allow attachment of non-neuronal cells. Neurons were then resuspended, counted
and seeded at a density of 25.104 cells/cm2 in culture
dishes coated with poly-D-lysine (Becton Dickinson Biosciences). The granule neurons were cultured at 37°C
in a humidified incubator with 6% CO2 /94% air for 7
days. To prevent proliferation of remaining non-neuro-nal cells, 10 μM cytosine b-D-arabinofuranoside (Ara-C) was added to the culture medium 24 h after plating. At 7 days in vitro, granule neurons represented more than 98% of cultured cells (data not shown).
CGN were washed and incubated for the indicated times in serum-free BME supplemented with L-Gln, HEPES, antibiotics and 1 μM of the NMDA antagonist (+)-MK-801, and containing either 25 mM KCl (K25 medium) or 5 mM KCl (K5 medium). We chose to use K25 medium as a control instead of initial culture med-ium to exclude gene expression differences resulting from serum deprivation, which has been shown to induce the death of a small proportion of cultured CGN [31]. Moreover, we added 1 μM of MK-801 in both K25 and K5 media to avoid any change in gene expression due to non-controlled NMDA receptor stimulation by endogenously released glutamate.
RNA preparation, reverse transcription and real-time PCR
Total RNA was prepared using Trizol (Invitrogen) according to the manufacturer’s instruction. Purified RNA was treated with the DNase I from the DNA-free™ kit (Ambion) according to manufacturer’s instructions. For reverse transcription, 2 μg of total RNA were reverse transcribed using 200 U M-MLV reverse transcriptase (Invitrogen) in the presence of 2.5 μM random hexamers and 0.5 mM dNTP. Three inde-pendent RT reactions were performed from each RNA preparation. Four ng of the resulting cDNAs were used as template for real time PCR using ABI Prism 7000
with the SybrGreen®
PCR Master Mix (Applied Biosys-tems). Primers were designed with Primer Express™ software (Applied Biosystems). The sequences of all the primers used were deposited in the Gene Expression Omnibus (GEO) repository under the accession number GPL7701. The PCR reaction was performed in 10 μl in the presence of 300 nM specific primers. Thermal cycling parameters were 2 min at 50 °C, 10 min at 95°C, !! "!! ! #!! "$! %! ! &! "#! !"#$%& !"#&%' !"#'%( !"#(%) !"#)%*
'
(
+ , -. #/ 01 12 32 -4 2 #5 2 67 2 2 -' #4 8 -9 2 4 : 60 ; 2 # !" + , -. #/ 01 12 32 -4 2 #5 2 67 2 2 -' #4 8 -9 2 4 : 60 ; 2 # !" !"#$%& !"#&%' !"#'%( !"#(%) !"#)%*Figure 4 The repertoire of GPCRs expressed by mature
cerebellar granule neurons is mostly determinate after 3 days in vitro (DIV 3). To monitor global changes in GPCR expression, GPCRs were ranked by their expression levels, and the absolute difference in the ranks of each GPCR between 2 consecutive time points, i.e. DIV 0-1, DIV 1-2, DIV 2-3 and so on, were recorded. Box plots were drawn to visualize the distributions of the differences in GPCR expression levels between 2 consecutive DIV. Box plots are shown for both the whole GPCR set (Figure 4A) and for the 50 most abundantly expressed GPCRs at DIV 9 (Figure 4B). Whereas the distributions are comparable for the whole GPCR set, the box plots for the 50 most expressed GPCRs display a decrease in the average difference between 2 consecutive DIV before and after DIV 3, indicating that the repertoire of GPCRs expressed by mature cerebellar granule neurons is mostly determinate at DIV 3, when neurons are not morphologically mature yet.
followed by 40 cycles of 95°C for 15 s and 60°C for 1 min. Data were analyzed with ABI prism 7000 SDS soft-ware. The level of expression of each GPCR “X” was normalized to the geometric mean of the expression levels of the selected reference genes, R1 to R3, in the same PCR plate according to the formula:
X 3 √R 1xR2R3 = 2 Ct(X)− Ct(R1) + Ct(R2) + Ct(R3) 3 .
Reference genes were selected according to the GeN-orm procedure [18]. Reference genes used in this study were B2m (beta-2 microglobulin), Gapdh (glyceralde-hyde-3-phosphate dehydrogenase), and Gusb (glucuroni-dase, beta).
Statistical analysis of PCR data
To reduce the variability introduced by reverse tran-scription (RT), the normalized, log2-transformed PCR data obtained from individual RT were mean-centered and scaled in SD units. Statistical tests were performed with the statistical module of MeV 4.2 [17]. For Krus-kal-Wallis test, post-hoc tests were performed with XLStat (Addinsoft). All p-value were corrected for mul-tiple testing according to the method proposed by Hochberg and Benjamini [16].
Additional material
Additional file 1: List of the GPCRs studied in this manuscript. An Excel file listing the names of the GPCRs, as well as aliases, Unigene, Entrez and Ensembl gene ID.
Additional file 2: Comparison of Taqman®
®- and SybrGreen®
®-based detection assays. An Excel file that lists the results of the assays
performed to compare commercial Taqman®
® probes to the
SybrGreen®
®-based detection system used in this study.
Additional file 3: Sequences of the primers used in this manuscript. An Excel file that gives the sequences of the primers used for each GPCR in this study.
Additional file 4: Results of the replicated PCR experiments to test for normality of Ct distribution. An Excel file that lists the 9 GPCRs that were used for replicated PCR experiments on genomic DNA as well as the results of the statistical analysis conducted to determine if Ct distributions displayed on Additional files 5, 6, 7, 8, 9, 10, 11, 12 and 13 are Gaussian
Additional file 5: Distribution of the Ct values of replicated PCR experiment using Avpr2 primers. A pdf file showing the distribution of the Ct values obtained in 64-replicate RT-PCR experiments with Avpr2 primers.
Additional file 6: Distribution of the Ct values of replicated PCR experiment using Adrb2 primers. A pdf file showing the distribution of the Ct values obtained in 64-replicate RT-PCR experiments with Adrb2 primers.
Additional file 7: Distribution of the Ct values of replicated PCR experiment using Npy2r primers. A pdf file showing the distribution of the Ct values obtained in 64-replicate RT-PCR experiments with Npy2r primers.
Additional file 8: Distribution of the Ct values of replicated PCR experiment using Chrm1 primers. A pdf file showing the distribution
of the Ct values obtained in 64-replicate RT-PCR experiments with Chrm1 primers.
Additional file 9: Distribution of the Ct values of replicated PCR experiment using Htr2c primers. A pdf file showing the distribution of the Ct values obtained in 64-replicate RT-PCR experiments with Htr2c primers.
Additional file 10: Distribution of the Ct values of replicated PCR experiment using Gcgr primers. A pdf file showing the distribution of the Ct values obtained in 64-replicate RT-PCR experiments with Gcgr primers.
Additional file 11: Distribution of the Ct values of replicated PCR experiment using Adcyap1r1 primers. A pdf file showing the distribution of the Ct values obtained in 64-replicate RT-PCR experiments with Adcyap1r1 primers.
Additional file 12: Distribution of the Ct values of replicated PCR experiment using Casr primers. A pdf file showing the distribution of the Ct values obtained in 64-replicate RT-PCR experiments with Casr primers.
Additional file 13: Distribution of the Ct values of replicated PCR experiment using Fzd4 primers. A pdf file showing the distribution of the Ct values obtained in 64-replicate RT-PCR experiments with Fzd4 primers.
Additional file 14: List of the GPCRs differentially expressed in CGNs incubated in 5 (K5) or 25 (K25) mM KCl for 4 hours. An Excel file that lists the names of those GPCRs differentially expressed, expression values and fold-change.
Additional file 15: List of GPCRs differentially expressed during the differentiation of CGNs in vitro. An Excel file that lists the names of those GPCRs differentially expressed in at least one condition during the developmental time course, normalized expression values, average and standard deviation
List of abbreviations used
GPCR: G protein-coupled receptor; CGN: cerebellar granule neuron; DIV: day (s) in vitro; DE: differentially expressed; ORF: open reading frame; 7TM: seven transmembrane.
Acknowledgements
This work was supported by grants from CNRS, Inserm, Montpellier University, the Languedoc-Roussillon district, and the European Community’s Sixth Framework Programme (grant LSHB-CT-2003-503337). BM was supported by the Ministry for Education and Research. We thank Drs. Annie Varrault and Tristan Bouschet for helpful suggestions and critical reading of the manuscript.
Author details
1Institut de Genomique Fonctionnelle, 141 rue de la cardonille, F-34094
Montpellier Cedex 05, France.2CNRS, UMR5203, Montpellier, France.3Inserm,
U661, Montpellier, France.4Univ Montpellier, Montpellier, France.
5
Montpellier GenomiX, Montpellier, France. Authors’ contributions
BM carried out the cerebellar granule neuron cultures, performed the real-time PCR experiments for selecting statistical tests, and helped to draft the manuscript. ALD validated the primer collection, and performed the real-time PCR experiments on cerebellar granule neurons. CD helped with the management of real-time PCR data and statistics. LJ designed the study, identified the endo-GPCR repertoire, processed real-time PCR data, performed statistical analysis, and drafted the manuscript. All authors read and approved the final manuscript.
Competing interests
The authors declare that they have no competing interests. Received: 17 November 2010 Accepted: 16 May 2011 Published: 16 May 2011
Maurel et al. BMC Genomics 2011, 12:241 http://www.biomedcentral.com/1471-2164/12/241
References
1. Schiöth HB, Nordström KJV, Fredriksson R: Mining the gene repertoire and
ESTs for G protein-coupled receptors with evolutionary perspective. Acta Physiol (Oxf) 2007, 190:21-31.
2. Kroeze WK, Sheffler DJ, Roth BL: G-protein-coupled receptors at a glance.
J Cell Sci 2003, 116:4867-4869.
3. Lagerström MC, Schiöth HB: Structural diversity of G protein-coupled
receptors and significance for drug discovery. Nat Rev Drug Discov 2008, 7:339-357.
4. Fredriksson R, Schiöth HB: The repertoire of G-protein-coupled receptors
in fully sequenced genomes. Mol Pharmacol 2005, 67:1414-25.
5. Vassilatis DK, Hohmann JG, Zeng H, Li F, Ranchalis JE, Mortrud MT, Brown A,
Rodriguez SS, Weller JR, Wright AC, Bergmann JE, Gaitanaris GA: The G protein-coupled receptor repertoires of human and mouse. Proc Natl Acad Sci USA 2003, 100:4903-8.
6. Foord SM, Bonner TI, Neubig RR, Rosser EM, Pin J-P, Davenport AP,
Spedding M, Harmar AJ: International Union of Pharmacology. XLVI. G protein-coupled receptor list. Pharmacol Rev 2005, 57:279-88.
7. Bjarnadóttir TK, Gloriam DE, Hellstrand SH, Kristiansson H, Fredriksson R,
Schiöth HB: Comprehensive repertoire and phylogenetic analysis of the G protein-coupled receptors in human and mouse. Genomics 2006, 88:263-73.
8. Regard JB, Sato IT, Coughlin SR: Anatomical profiling of G protein-coupled
receptor expression. Cell 2008, 135:561-571.
9. Dong X, Han S, Zylka MJ, Simon MI, Anderson DJ: A diverse family of
GPCRs expressed in specific subsets of nociceptive sensory neurons. Cell 2001, 106:619-32.
10. Zylka MJ, Dong X, Southwell AL, Anderson DJ: Atypical expansion in mice of the sensory neuron-specific Mrg G protein-coupled receptor family. Proc Natl Acad Sci USA 2003, 100:10043-8.
11. Sexton PM, Poyner DR, Simms J, Christopoulos A, Hay DL: Modulating receptor function through RAMPs: can they represent drug targets in themselves? Drug Discov Today 2009, 14:413-419.
12. Evans BN, Rosenblatt MI, Mnayer LO, Oliver KR, Dickerson IM: CGRP-RCP, a novel protein required for signal transduction at calcitonin gene-related peptide and adrenomedullin receptors. J Biol Chem 2000,
275:31438-31443.
13. Bovolenta P, Esteve P, Ruiz JM, Cisneros E, Lopez-Rios J: Beyond Wnt inhibition: new functions of secreted Frizzled-related proteins in development and disease. J Cell Sci 2008, 121:737-746.
14. Gamo K, Kiryu-Seo S, Konishi H, Aoki S, Matsushima K, Wada K, Kiyama H: G-protein-coupled receptor screen reveals a role for chemokine receptor CCR5 in suppressing microglial neurotoxicity. J Neurosci 2008,
28:11980-11988.
15. Layden BT, Newman M, Chen F, Fisher A, Lowe WL: G protein coupled receptors in embryonic stem cells: a role for Gs-alpha signaling. PLoS ONE 2010, 5:e9105.
16. Hochberg Y, Benjamini Y: More powerful procedures for multiple significance testing. Stat Med 1990, 9:811-818.
17. Saeed AI, Sharov V, White J, Li J, Liang W, Bhagabati N, Braisted J, Klapa M, Currier T, Thiagarajan M, Sturn A, Snuffin M, Rezantsev A, Popov D, Ryltsov A, Kostukovich E, Borisovsky I, Liu Z, Vinsavich A, Trush V, Quackenbush J: TM4: a free, open-source system for microarray data management and analysis. Biotechniques 2003, 34:374-8.
18. Vandesompele J, De Preter K, Pattyn F, Poppe B, Van Roy N, De Paepe A, Speleman F: Accurate normalization of real-time quantitative RT-PCR data by geometric averaging of multiple internal control genes. Genome Biol 2002, 3:RESEARCH0034.
19. Moore-Morris T, Varrault A, Mangoni ME, Le Digarcher A, Negre V, Dantec C, Journot L, Nargeot J, Couette B: Identification of potential
pharmacological targets by analysis of the comprehensive G protein-coupled receptor repertoire in the four cardiac chambers. Mol Pharmacol 2009, 75:1108-1116.
20. Desagher S, Severac D, Lipkin A, Bernis C, Ritchie W, Le Digarcher A, Journot L: Genes regulated in neurons undergoing transcription-dependent apoptosis belong to signaling pathways rather than the apoptotic machinery. J Biol Chem 2005, 280:5693-702.
21. Villalba M, Bockaert J, Journot L: Pituitary adenylate cyclase-activating polypeptide (PACAP-38) protects cerebellar granule neurons from apoptosis by activating the mitogen-activated protein kinase (MAP kinase) pathway. J Neurosci 1997, 17:83-90.
22. D’Mello SR, Galli C, Ciotti T, Calissano P: Induction of apoptosis in cerebellar granule neurons by low potassium: inhibition of death by insulin-like growth factor I and cAMP. Proc Natl Acad Sci USA 1993, 90:10989-93.
23. Wood KA, Dipasquale B, Youle RJ: In situ labeling of granule cells for apoptosis-associated DNA fragmentation reveals different mechanisms of cell loss in developing cerebellum. Neuron 1993, 11:621-32. 24. Cavallaro S, Copani A, D’Agata V, Musco S, Petralia S, Ventra C, Stivala F,
Travali S, Canonico PL: Pituitary adenylate cyclase activating polypeptide prevents apoptosis in cultured cerebellar granule neurons. Mol Pharmacol 1996, 50:60-66.
25. Tu H, Xu C, Zhang W, Liu Q, Rondard P, Pin J-P, Liu J: GABAB receptor activation protects neurons from apoptosis via IGF-1 receptor transactivation. J Neurosci 2010, 30:749-759.
26. Sotelo C: Cellular and genetic regulation of the development of the cerebellar system. Prog Neurobiol 2004, 72:295-339.
27. Chédotal A: Should I stay or should I go? Becoming a granule cell. Trends Neurosci 2010, 33:163-172.
28. Wechsler-Reya RJ, Scott MP: Control of neuronal precursor proliferation in the cerebellum by Sonic Hedgehog. Neuron 1999, 22:103-114.
29. Koirala S, Jin Z, Piao X, Corfas G: GPR56-regulated granule cell adhesion is essential for rostral cerebellar development. J Neurosci 2009,
29:7439-7449.
30. Zou YR, Kottmann AH, Kuroda M, Taniuchi I, Littman DR: Function of the chemokine receptor CXCR4 in haematopoiesis and in cerebellar development. Nature 1998, 393:595-599.
31. Miller TM, Johnson EM: Metabolic and genetic analyses of apoptosis in potassium/serum-deprived rat cerebellar granule cells. J Neurosci 1996, 16:7487-7495.
doi:10.1186/1471-2164-12-241
Cite this article as: Maurel et al.: Genome-wide profiling of G protein-coupled receptors in cerebellar granule neurons using high-throughput, real-time PCR. BMC Genomics 2011 12:241.
Submit your next manuscript to BioMed Central and take full advantage of:
• Convenient online submission
• Thorough peer review
• No space constraints or color figure charges
• Immediate publication on acceptance
• Inclusion in PubMed, CAS, Scopus and Google Scholar
• Research which is freely available for redistribution
Submit your manuscript at www.biomedcentral.com/submit