HAL Id: hal-01206376
https://hal.archives-ouvertes.fr/hal-01206376
Submitted on 24 Nov 2017
HAL is a multi-disciplinary open access
archive for the deposit and dissemination of
sci-entific research documents, whether they are
pub-lished or not. The documents may come from
teaching and research institutions in France or
abroad, or from public or private research centers.
L’archive ouverte pluridisciplinaire HAL, est
destinée au dépôt et à la diffusion de documents
scientifiques de niveau recherche, publiés ou non,
émanant des établissements d’enseignement et de
recherche français ou étrangers, des laboratoires
publics ou privés.
Stability and Efficiency of RPL under Realistic
Conditions in Wireless Sensor Networks
Oana Iova, Fabrice Theoleyre, Thomas Noel
To cite this version:
Oana Iova, Fabrice Theoleyre, Thomas Noel. Stability and Efficiency of RPL under Realistic
Condi-tions in Wireless Sensor Networks. IEEE International Symposium on Personal Indoor and Mobile
Ra-dio Communications (PIMRC), Sep 2013, London, United Kingdom. �10.1109/PIMRC.2013.6666490�.
�hal-01206376�
Stability and Efficiency of RPL under Realistic
Conditions in Wireless Sensor Networks
Oana Iova, Fabrice Theoleyre, Thomas Noel
CNRS, ICube, University of Strasbourg, FranceEmail: {otiova, theoleyre, noel}@unistra.fr
Abstract—The IPv6 Routing Protocol for Low-Power and Lossy Networks (RPL) is one of the emerging routing standards for multihop Wireless Sensor Networks (WSN). RPL is based on the construction of a Destination-Oriented Directed Acyclic Graph (DODAG), which offers a loop-free topology to route data packets. While several routing metrics have been proposed in the literature, it is unclear how they perform with RPL. In this paper, we analyze the impact of different PHY and MAC metrics on the stability and efficiency of RPL. We highlight the fact that realistic conditions lead to instabilities and oscillations in the routing structure. While minimizing the hop length leads to a stable but poor routing structure, more sophisticated link metrics such as ETX reflect more clearly the radio link quality but increase the number of DODAG reconfigurations. We also provided a detailed methodology to measure the DODAG stability and to implement efficiently each routing metric with RPL.
Index Terms—RPL, metrics, stability, oscillations, dynamic properties, WSN, ETX, minhop, LQI
I. INTRODUCTION
The Internet Engineering Task Force (IETF) has recently standardised RPL [1], which became the emerging protocol for low-power and lossy networks, including Wireless Sensor Networks (WSN).
RPL is a distance vector protocol designed for networks containing up to thousands of constrained devices. By us-ing different routus-ing metrics, RPL constructs a Destination-Oriented Directed Acyclic Graph (DODAG) rooted at the border router, gateway to the Internet.
When constructing a DODAG, a node must accurately choose its parents. In RPL, each node selects its parents according to a set of routing metrics transformed into a Rank by an Objective Function. This Rank reflects the relative distance of the nodes to the border router.
A good metric must consequently reflect the radio link quality of the whole path towards the border router. It should also take into account the energy efficiency of the path to reduce the energy consumption. While the metric must react quickly to changes, it must also be sufficiently stable to avoid useless RPL reconfigurations.
In this paper, we underline the importance of choosing the right metric in order to estimate the quality of a link. This is important not only to guarantee reliable end-to-end transmissions, but also for having a stable routing topology.
We analyze here the behavior of RPL through simulations with realistic conditions. If RPL does not work in these
This work was partially supported by the French National Research Agency (ANR) project IRIS under contract ANR-11-INFR-016.
scenarios, it will a fortiori behave poorly experimentally, facing at least the same problems.
The contribution of this paper is threefold:
1) we thoroughly evaluate by simulations the stability of the DODAG structure in RPL with a realistic PHY layer; 2) we present tools and metrics to study the stability of any routing protocol for WSN, investigating in particular the routing dynamics of RPL;
3) we demonstrate that no existing routing metric succeeds to guarantee the RPL efficiency. Thus, efficient routing metrics still have to be proposed for RPL.
II. RELATEDWORK
RPL was designed to optimize multi-point to point traffic, as this is the most common type of flow in WSN. In consequence, it creates a DODAG topology rooted at the border router (i.e., the sink collecting the data, interconnected to the Internet).
The DODAG construction is based on the Rank of a node, which depicts its relative distance to the DODAG root. An
Objective Function defines how one or more metrics should
be used in order to compute this Rank.
The DODAG bootstraps when the border router broadcasts a DODAG Information Object (DIO) (Fig. 1a). This packet contains information about the DODAG, such as the DODAG identifier, the Objective Function, the Rank of the node etc. In the example below, we use MinHop (the number of hops on the path) as a metric.
Once a node receives a DIO, it will insert the transmitter in the list of possible successors. Then, it chooses as its preferred parent the node that has the smallest Rank in its list. All the packets that need to be sent to the root of the DODAG will be forwarded to the preferred parent. Finally, it computes its own Rank with the Objective Function and starts broadcasting its own DIOs. In Fig. 1b, the neighbors of the root choose the border router as their preferred parent (since it is the closest in number of hops) and then start broadcasting their own DIOs. Even after RPL has converged, the protocol keeps on transmitting DIOs in order to maintain the DODAG up-to-date. The rate at which the DIOs are being sent is dynamically tuned, by using the trickle algorithm [2]: the more stable the topology becomes, the less control messages are being sent, in order to save energy. When an inconsistency is detected, trickle resets its timer and the nodes send DIOs more frequently in order to quickly propagate the updated DODAG.
Border Router DIO broadcast 1 ∞ ∞ ∞ ∞ ∞ ∞ ∞ (a) Step 1 1 ∞ 2 2 2 ∞ ∞ ∞ (b) Step 2 1 3 2 2 2 3 ∞ 3 (c) Setp 3 1 3 2 2 2 3 4 3 (d) resulting DODAG
k node with rank k DIO
(e) Legend Fig. 1: DODAG construction
A. Existing Link Quality Metrics
Estimating the link quality in a reliable manner is still an open problem. We will hereafter detail the most important metrics in the literature.
1) MinHop: Widely used in wired networks, this metric
optimizes the hop length of the path. However, this approach has been proved to privilege paths with bad radio links since it chooses long radio links to reduce the hop length [3].
2) Delay estimation: RTT (Per-hop Round Trip Time)
[4] estimates how much time is required before a packet is correctly received by the destination. This metric takes into account the load of a node and the number of retransmissions due to a bad radio link or interfering nodes.
Since the packet length practically impacts the RTT, Per-hop Packet Pair Delay (PktPair) [5] estimates the delay by sending periodically probes of different lengths. However, this technique greatly increases the energy consumption due to the induced control traffic.
3) ETX: De Cuoto et al. [6] proposed the Expected
Trans-mission count (ETX) to find high throughput paths. ETX estimates the number of transmissions required before the packet is correctly received by the destination. It is computed
as 1/(P DRs→d×P DRd→s), where PDRs→dis the estimated
packet delivery ratio of the link from s to d. The PDR is often estimated actively by sending probes.
Since ETX is always searching for the best instantaneous link quality, it may induce instability in the network: the PDR is a stochastic variable.
4) Physical layer metrics: RSSI (Received Signal Strength
Indicator) and LQI (Link Quality Indicator) are two popular estimators of the radio link quality provided by the radio chipset. However, the RSSI permits only to isolate very good radio links: the gray zone is not differentiable [7].
5) Cross layer metrics: The Four-bit (4B) metric [8]
adopted a cross-layer approach, mixing metrics from differ-ent layers. Unfortunately, 4B does not react well to dense networks. Besides, the variations of the different metrics are amplified by their combination.
B. Routing Efficiency
RPL has already been thoroughly evaluated. Tripathi et al. [9] highlighted that the trickle algorithm creates waves in the number of control packets generated in the network: it never self-stabilizes. On the contrary, [10] proposes to trigger a route update only if the difference with the optimal metrics exceeds
30%. However, the metric being cumulative, routes become quickly sub-optimal.
Recently, Gaddour et al. demonstrated that the reliability quickly degrades for nodes farther away from the border router [11] when using ETX. Liu et al. [12] have studied the impact of various metrics on a different routing protocol, based on a convergecast tree (Collection Tree Protocol). They highlighted that ETX creates more next hop changes.
In this paper, we aim at studying in depth the stability of RPL and the impact of the chosen metrics on its performance.
III. IMPLEMENTING A LINK QUALITY METRIC INRPL
While several routing metrics exist in the literature, they have not been systematically evaluated with RPL.
To study the behavior of RPL under these metrics, we chose to implement one of each category. First, we selected the two most widely used: MinHop and ETX. Second, we chose LQI since it depicts well the radio link quality measured by the radio chipset (RSSI would have lead to the same final results). Because cross-layer metrics highly rely on different metrics, their behavior is more complicated to interpret. Thus, we focus rather on individual routing metrics.
1) Delay based metrics: We decided to not implement RTT
since it is closely related to the ETX metric.
If we take N (average number of retransmissions for a
packet), Tx(time needed to send a data packet or an ack) and
Tcontention(k) (contention time for the kth retransmission),
then RTT may be estimated as: RTT =
N
X
k∈1
(Tcontention(k)+Tdata)+(N −1)×Ttimeout+Tack
Since N = ET X, ETX and RTT metrics are consequently very close and would exhibit the same behavior in single rate networks. Besides, the MAC layer must report to the network layer Tcontention(k), which is practically complicated.
2) ETX: In order to save energy, we adopt a passive
mea-surement technique: we estimate the PDR using the existing data traffic, without sending probes.
We only consider acknowledged packets to estimate the
bidirectional packet delivery ratio. Every time an ack is
received, a node updates the ETX of that link with the corresponding new PDR. The PDR for a link is computed as the ratio between the number of acks received and the number of data packets sent on that link, including retransmissions. Since counting the acknowledged packets implicitly combines
the PDR in both directions, we have just one PDR measure to compute the ETX value.
In order to evaluate also the links that are not used by the data traffic, we implemented a rough estimation of the ETX by monitoring the received DIOs. We modified the DIO packet in order to contain a SequenceNumber, so that the receiver is able to estimate the DIO loss ratio.
Every time a DIO message is received, the node computes the difference between the last received SequenceNumber and the new one. Then, it updates the ETX accordingly.
In other words, a radio link dropping most DIOs will probably never be chosen: we do not waste energy to estimate more accurately its quality. On the contrary, a node may select as parent a node from which it receives most DIOs. Then, the child will use the data traffic to refine the link quality metric (i.e., an asymmetrical link will surely be removed later).
3) LQI: LQI is measured by the radio chipset for every
received packet, be it a data or a control one. We implicitly consider that the radio link quality is symmetrical.
4) Statistical Estimator: All these metrics denote
instan-taneous values. Since they are stochastic by nature, we must smooth their values in order to limit their variation. We decided to use an exponential weighted moving average:
M etric(t + 1) = λM etric(t) + (1 − λ)measure (1)
With metric(t) the estimated metric at time t and measure the new measure of this metric. A new radio link has initially a metric equal to 1.0.
We also used a blacklisting policy in order to take into consideration only links above a certain threshold (cf. Table I). The nodes that are blacklisted are removed from the list of possible successors.
IV. SIMULATION SETUP
We adapted the RPL implementation of Contiki [13] to the WSNet simulator, an efficient event-driven simulator dedicated to Wireless Sensor Networks, which has been extensively evaluated [14]. By means of simulations, we can analyze more easily the measures, because of reproducibility, isolation and control on the parameters. The results are averaged over 20 simulations with different random topologies. We consider CBR convergecast flows because this is the most frequent scenario for data collection applications.
In order to focus on the properties of the routing protocol, we decided to use the IEEE 802.15.4 in the beacon-less mode. In this way, the behavior of the routing protocol will not be influenced by the duty-cycle. A preamble technique may be used together to implement a low-duty cycle MAC.
At the PHY layer, we used the path-loss shadowing model, calibrated with the scenario FB6 (indoor real de-ployment) presented in [15]: shadowing, path loss = 1.97, standard deviation = 2.0, P r(2m) = −61.4dBm.
We configured RPL as illustrated in Table I. Both local and global repair are activated. We chose λ = 0.9 because it limits the impact on the network dynamics.
The Objective Function is based on the minimum rank with hysteresis using the following metrics: MinHop, ETX, and LQI.
parameter value Simulation duration 3600 s
Number of nodes 100
Traffic type, rate CBR, 5 pkt/min
Data packet size 130 bytes (incl. MAC headers) RPL MinHopRankIncrease = 256 Trickle Imin = 27ms, Imax = 16, k = 10
Statistical estimator λ = 0.9 , blacklist-threshold: link quality >= 10%
TABLE I: Simulation parameters
V. RPL EFFICIENCYEVALUATION
A. Reliability
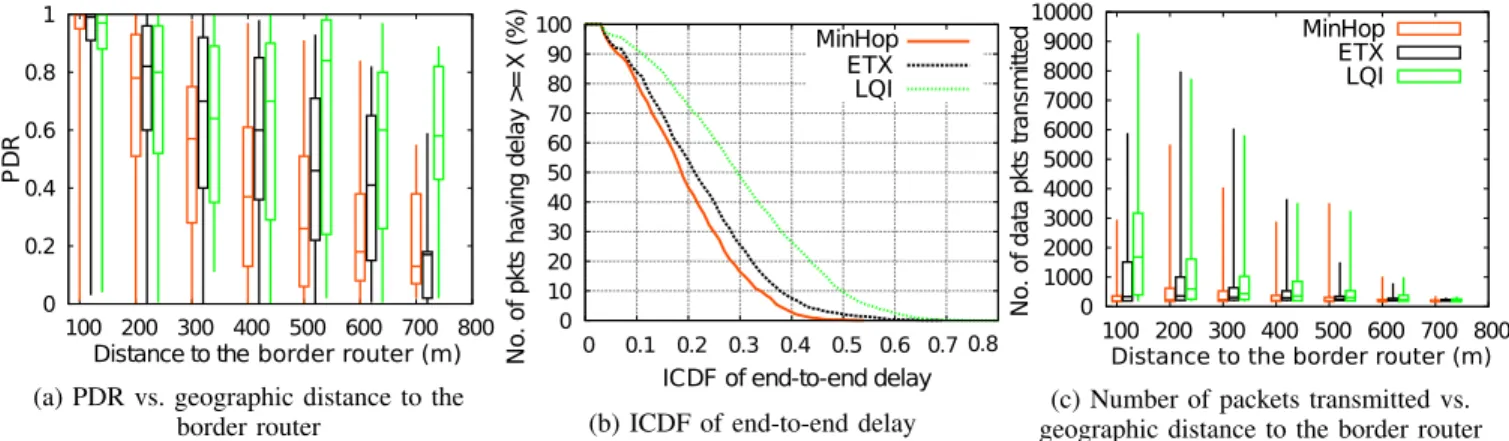
We first evaluated the RPL reliability, which we measured through the end-to-end Packet Delivery Ratio (ratio of the number of packets received by the border router and trans-mitted by each node).
With boxplots, we illustrated in Fig. 2a this PDR, grouping the source nodes according to their geographic distance to the border router. We can extract a strong correlation between the distance and the PDR: the farther a node is, the lower its PDR is: more nodes have to forward the packets, creating more packet losses. LQI has the largest median PDR, even for nodes very far from the border router: the signal strength is a good indicator to avoid bad radio links, having the most severe impact on packet losses.
However, such end-to-end PDR is still not acceptable. Solutions to improve the reliability have still to be proposed. B. End-to-end delay
Secondly, we evaluated the end-to-end delay, i.e., the time between the packet generation by the source and its reception by the border router (Fig. 2b).
MinHop presents the best delays because most of the pack-ets are dropped, particularly from nodes far from the border router. Since the delay is only computed for received packets, nodes close to the border router (with shorter paths) are over-represented in the end-to-end delay result. ETX presents a better delay than LQI, surely for the same reason.
C. Energy efficiency
We also estimated the energy consumption with the number of transmitted packets. If we implement a preamble sampling approach, most energy consumption is drained by packet transmissions. Fig. 2c presents the boxplot for the packets transmitted by a node in function of its distance to the border router.
Nodes closer to the border router have more packets to forward, and consequently consume more energy. For Min-Hop, nodes that are at 200 and 300 meters away from the border router consume more energy than the nodes closer (at 100m). These nodes are still at one hop distance to the root, so it is likely for them to be chosen as preferred parent in order to minimize the number of hops. On the contrary, with LQI, a non negligible portion of the nodes consume most of the resources. This could be problematic for the network lifetime. While the MAC layer can minimize the energy
0 0.2 0.4 0.6 0.8 1 100 200 300 400 500 600 700 800 P D R
Distance to the border router (m)
(a) PDR vs. geographic distance to the border router 0 10 20 30 40 50 60 70 80 90 100 0 0.1 0.2 0.3 0.4 0.5 0.6 0.7 0.8 N o . o f p k ts h a v in g d e la y > = X (% )
ICDF of end-to-end delay MinHop
ETX LQI
(b) ICDF of end-to-end delay
0 1000 2000 3000 4000 5000 6000 7000 8000 9000 10000 100 200 300 400 500 600 700 800 N o . o f d a ta p k ts tr a n s m it te d MinHop ETX LQI
Distance to the border router (m)
(c) Number of packets transmitted vs. geographic distance to the border router Fig. 2: RPL evaluation (Fig. (a) and (c) have the same legend)
consumption by using a low duty cycle, the network layer does it through mechanisms ensuring efficient route selection that avoids bottlenecks, congestion, etc. RPL should provide such a mechanism to avoid this unfair energy consumption.
VI. DODAG STABILITYEVALUATION
After evaluating the efficiency of RPL under different met-rics, we focused on investigating the routing dynamics of the DODAG. Even if the topology is stable, the radio conditions are stochastic and may impact the behavior of RPL.
A. Route Prevalence
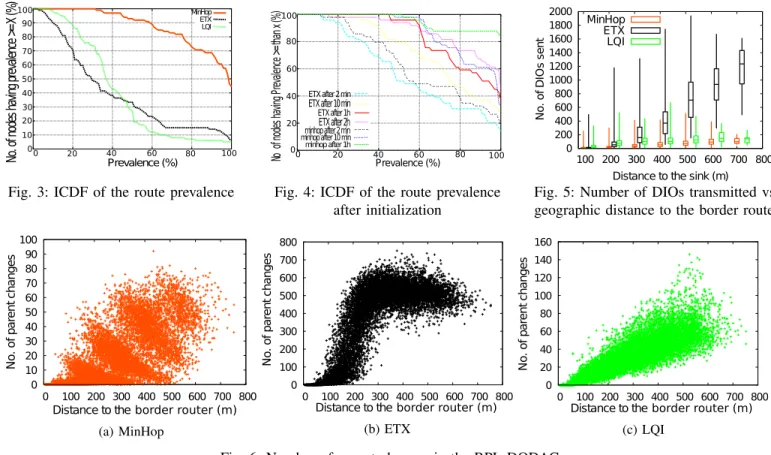
We first investigated the routing stability, by measuring the route prevalence: the average ratio of time during which we observe the same route (i.e. the principal route) [16]. The prevalence is computed as the ratio between the number of times the principal route was used and the number of times all routes have been used.
As we can see in Fig. 3, the DODAG is very stable when we use MinHop, although it performs poorly, as highlighted previously (45% of the sensors use only a single route to send the packets to the border router).
On the contrary, ETX and LQI exhibit many changes. For instance, in more than one third of the cases, the principal route exists only 20% of the network lifetime with ETX. Since a parent change generates a large overhead in RPL, these metrics waste resource energy.
We suspected that this instability problem comes from the initialization phase. Thus, we measured the route prevalence over a period of 5 hours, while removing the first hours (Fig. 4). When using ETX, even if we remove the first 2 hours, still only 50% of the nodes direct their traffic on the principal route. In other words, RPL seems to not converge to a stable list of routes, even when nodes are static, the traffic is CBR and the radio conditions remain unchanged. In order for RPL to converge, it needs an ideal estimator of the link quality, which is very hard to compute. However, in the absence of such an estimator, RPL’s mechanisms should be able to handle a biased estimator, and this is not the case.
C B root = 1 hop root = 2 hops root A F
D node D with its
max "radio range" DODAG parent E
D
root = 2 hops
Fig. 7: Preferred Parent choice (redundancy) for nodes at a different distance from the border router
B. Stability of the preferred parent
Finally, we measured in a microscopic manner the stability of the DODAG by calculating the number of times each node changes its preferred parent. Fig. 6 illustrates the number of parent changes for each node against the distance of the node to the border router. Results presented here concern a network of 500 nodes, to highlight more clearly the effects of each routing metric. However, we verified that we obtain similar results with lower densities.
The reader may remark that the y-scale is different for each graph. While a node changes at most 800 times its parent with ETX (Fig. 6b), the number of parent changes is more reduced with MinHop (Fig. 6a) and LQI (Fig. 6c). As we can see in Fig. 5, ETX will consume more energy since the trickle timer will be re-initiated more often, sending DIOs more frequently and creating a larger overhead
LQI has a different behavior (Fig. 6c): the number of parent changes increases linearly with the distance. Thus, LQI is quite scalable concerning the border router distance. However, it keeps on generating useless control packets even if the radio topology and conditions do not change during the simulations. When MinHop is used as a metric (Fig. 6a), we denote the appearance of a step pattern. Each step represents the hop distance to the border router.
Lets consider Fig. 7 to explain this pattern. A, B, D and E are sufficiently close (signal distance) to the root and choose it as preferred parent. Node C may choose either A or B as parent. On the contrary, F is farther away, and only the node D is a radio neighbor: the overlap between the 1-hop region and the radio range is much smaller than for the node C. F
No .o fn od es ha vin g pr ev al en ce >= X (% ) Prevalence (%) MinHop ETX LQI 10 20 30 40 50 60 70 80 90 100 00 20 40 60 80 100
Fig. 3: ICDF of the route prevalence
No of no de sh av ing Pr ev ale nc e >= th an x( % ) Prevalence (%)
ETX after 2min
ETXafter10min ETX after1h ETXafter2h minhopafter2min minhopafter10min minhopafter 1h 0 20 40 60 80 100 0 20 60 40 80 100
Fig. 4: ICDF of the route prevalence after initialization 0 200 400 600 800 1000 1200 1400 1600 1800 2000 100 200 300 400 500 600 700 800 N o . o f D IO s s e n t
Distance to the sink (m) MinHop
ETX LQI
Fig. 5: Number of DIOs transmitted vs. geographic distance to the border router
0 10 20 30 40 50 60 70 80 90 100 0 100 200 300 400 500 600 700 800 N o . o f p a re n t c h a n g e s
Distance to the border router (m)
(a) MinHop 0 100 200 300 400 500 600 700 800 0 100 200 300 400 500 600 700 800 N o . o f p a re n t c h a n g e s
Distance to the border router (m)
(b) ETX 0 20 40 60 80 100 120 140 160 0 100 200 300 400 500 600 700 800 N o . o f p a re n t c h a n g e s
Distance to the border router (m)
(c) LQI Fig. 6: Number of parent changes in the RPL DODAG
will consequently not change its preferred parent: its choice is limited. This phenomenon explains the step pattern.
VII. DISCUSSION ANDPERSPECTIVES
We thoroughly evaluated the impact of different link quality metrics on RPL. Firstly, we isolated an instability problem: whatever the routing metric is, a node changes its preferred parent. These oscillations generate a large overhead because of the trickle algorithm: the trickle timer is reset, triggering a more frequent DIO transmission. These control packets waste energy.
We highlighted the existence of a tradeoff between stability and efficiency for the existing metrics. For instance, the MinHop metric exhibits the lowest instability, but performs very poorly because it tends to use bad radio links. LQI limits also the instability but offers larger end-to-end delays. Oppositely, ETX balances more efficiently the load among the different nodes but maximizes the number of DODAG reconfigurations.
While this instability was highlighted by simulations, this problem will surely remain unsolved also in experimental/real conditions. A fortiori, the presence of asymmetrical links and a more fast varying radio channel will amplify the problem rather than solving it.
We plan to propose a metric which exhibits both a very stable behavior while reflecting well the radio link quality. Such metric must take into account various criteria such as the reliability and the energy efficiency. We will also analyze experimentally the behavior of these metrics with RPL.
REFERENCES
[1] T. Winter et al. RPL: IPv6 routing protocol for low-power and lossy networks. RFC 6550, Internet Engineering Task Force, March 2012. [2] P. Levis, T. Clausen, J. Hui, O. Gnawali and J. Ko. The trickle algorithm.
RFC 6206, Internet Engineering Task Force, March 2011.
[3] N. Ahmed, S. Kanhere, and S. Jha. Experimental evaluation of multi-hop routing protocols for wireless sensor networks. In IPSN, 2010. [4] A. Adya et al. A multi-radio unification protocol for IEEE 802.11
wireless networks. In BROADNETS, 2004.
[5] Srinivasan Keshav. A control-theoretic approach to flow control. In SIGCOMM, pages 3–15, Zurich, Switzerland, 1991. ACM.
[6] D. De Couto et al. A high-throughput path metric for multi-hop wireless routing. In MobiCom. ACM, 2003.
[7] K. Srinivasan and P. Levis. RSSI is under appreciated. In In Proceedings of the Third Workshop on Embedded Networked Sensors (EmNets), 2006. [8] K. Jamieson R. Fonseca, O. Gnawali and P. Levis. Four-bit wireless
link estimation. In ACM HotNets-VI, Atlanta, GA, 2007.
[9] J. Tripathi et al. A performance evaluation study of RPL: Routing protocol for low power and lossy networks. In CISS, 2010.
[10] J. Tripathi et al. Performance evaluation of the routing protocol for low-power and lossy networks (RPL). RFC 6687, Internet Engineering Task Force, 2012.
[11] Olfa Gaddour and Anis Koubˆaa. RPL in a nutshell: A survey. Comput. Netw., 56(14):3163–3178, September 2012.
[12] Tao Liu et al. Performance evaluation of link quality estimation metrics for static multihop wireless sensor networks. In SECON. IEEE, 2009. [13] A. Dunkels et al. Contiki - a lightweight and flexible operating system
for tiny networked sensors. In LCN. IEEE Computer Society, 2004. [14] E. Ben Hamida et al. On the Complexity of an Accurate and Precise
Performance Evaluation of Wireless Networks using Simulations. In MSWiM. ACM, 2008.
[15] Y. Chen and A. Terzis. On the implications of the log-normal path loss model: an efficient method to deploy and move sensor motes. In SenSys, Seattle, Washington, 2011. ACM.
[16] Vern Paxson. End-to-end routing behavior in the internet. In ACM Sigcomm, May 1996.