COUPLED DIFFERENTIAL AND INTEGRAL DATA ANALYSIS FOR IMPROVED UNCERTAINTY QUANTIFICATION OF THE
63'65
CU CROSS-SECTION EVALUATIONS
By Vladimir Sobes
B.S., Nuclear Science and Engineering (2011) Massachusetts Institute of Technology
ARCHN.3_
MASSACHUSETTS INSTEUrE, OF TECHNOLOGY
APR 0
8
2014
LIBRARIES
SUBMITTED TO THE DEPARTMENT OF NUCLEAR SCIENCE AND ENGINEERING
IN PARTIAL FULFILLMENT OF THE REQUIREMENTS FOR THE DEGREE OF
DOCTOR OF PHILOSOPHY IN NUCLEAR SCIENCE AND ENGINEERING AT THE
MASSACHUSETTS INSTITUTE OF TECHNOLOGY FEBRUARY 2014
@2014
Massachusetts Institute of Technology All rights reservedSignature of Author: ... ...
Vladimir Sobes Department of Nuclear Science and Engineering September 9, 2013
C ertified by ... ...
Benoit Forget Assqoate Professor of Nuclear Science and Engineering Thesis Supervisor
Certified by... ...
Luiz Leal Distinguished Scientist, Oak Ridge National Laboratory Thaeis Reader
A ccepted by: ... ...
Mujid Kazimi
TEPCO Profes of clear Engineering Chair, Department Committee on Graduate Students
Coupled Differential and Integral Data Analysis for
Improved Uncertainty
Quantification
of the
63,6Cu Cross
Section Evaluations
by
Vladimir Sobes
Submitted to the Department of Nuclear Science and Engineering on September 9, 2013, in partial fulfillment of the
requirements for the degree of
Doctor of Philosophy in Nuclear Science and Engineering
Abstract
A new methodology has been developed that couples differential cross section data evaluation with integral benchmark analysis for improved uncertainty quantification. The new methodology was applied to the two new copper evaluations and resulted in an improved evaluation with smaller covariance data. Copper is a structural material in many nuclear applications, particularly those dealing with criticality safety. The current standard for the resonance evaluation of the two copper isotopes, 6 3,6 5Cu, has been determined to result in poor modeling performance. Therefore a new resonance evaluation of the two copper isotopes is vital to nuclear criticality safety applications. Performing a new resolved resonance region evaluation for copper has served as a backdrop to this work on developing new techniques for resolved resonance region evaluation. For the new evaluations, experimental cross section measurements have been carried out in the thermal energy region where no experimental data had pre-viously been measured. Along the way, an automated routine was developed to aid with the determination of the quantum angular momentum of newly identified reso-nances. The impact of differential scattering cross sections with respect to angle was determined in the benchmarking process. The implications of the study of the impact of differential cross sections on criticality suggest a necessity for detailed treatment of the angular distributions during the evaluation process, as well as temperature broadening of the angular distributions for simulation applications. The formalism for temperature broadening of angular distributions has been derived and tested. The new evaluations were compared against the current ENDF/B-VII.1 standard on a set of 23 criticality safety benchmark models and displayed improved performance. In the new methodology developed for coupling of the differential and integral data evaluation, resonance parameters are directly and systematically adjusted based on feedback from integral benchmark experiments. Coupling this feedback directly to the resonance parameters gives the new method the advantage of implicitly adjust-ing all of the cross sections simultaneously, includadjust-ing the double differential cross
sections. Based on integral feedback, the new methodology provides a way of updat-ing the reported covariance of the resolved resonance region to reflect true state of knowledge.
Thesis Supervisor: Benoit Forget
Acknowledgments
First and foremost, the author would like to thank his Ph.D thesis committee mem-bers: Prof. Benoit Forget, Dr. Luiz Leal, Prof. Kord Smith and Dr. Gordon Kohse. The committee has been vital to the successful completion of this research.
This research was funded by the Nuclear Criticality Safety Program. For this, the author is sincerely grateful. A debt of gratitude is owned to Jerry McKamy, Program manager of the Nuclear Criticality Safety Program (NCSP) for the National Nuclear Security Agency (NNSA) and Jim.Felty, from SAIC at the time of the research.
The author would like to acknowledge the work done by K. Guber from ORNL, and S. Kopecky, P. Schillebeeckx, and P. Siegler from the Nuclear Physics Unit, EC-JRC-IRMM, Geel, Belgium on the capture cross section measurements carried out at GELINA. Also, the author would like to thank Ruaridh Macdonald for his help with the MCNP modelling of the time-of-flight experiment at the MITR and Ekaterina Paramonova for her help setting up the thermal capture cross section experiment at the MITR. Both Ruaridh and Ekaterina were part of the MIT Undergraduate Re-search Opportunities Program (UROP) when working on this project. Great thanks are also owed to Yakov Ostrovsky, and David Carpenter from the MITR In-core Experiments team for their tireless help with the experimental measurements.
Extended thanks go out to Mike Dunn from ORNL for his support of the en-tire research project, as well as Dorothea (Doro) Wiarda, Don Mueller, Marco Pigni, Mark Williams, Chris Perfetti and Goran Arbanas for their technical assistance of this research. Pavel Pereslavtsev of Karlsruhe Institute of Technology (KIT) is also acknowledged for his collaboration on the copper research as well as Richard McK-night of Argonne National Laboratory, A. C. (Skip) Kahler and Russ Mosteller from Los Alamos National Laboratory and Dennis Mennerdahl of E Mennerdahl Systems for sharing their wisdom from the world of nuclear data and criticality safety.
Contents
1 Introduction 25
1.1 Experimental Data . . . . 29
1.2 Resolved Resonance Region Evaluation . . . . 30
1.3 Benchm arking . . . . 34
1.4 Coupled Differential and Integral Data A nalysis . . . . 34
2 Background 39 2.1 Introduction to Nuclear Data . . . . 39
2.2 Resolved Resonance Region Evaluation . . . . 44
2.2.1 Experimental Measurements . . . . 44
2.2.2 Overview of R-Matrix Theory of Nuclear Reactions . . . . 48
2.2.3 SAMMY Code System for Resolved Resonance Region Evalu-ations . . . . 53
2.2.4 Definition and Differential Cross Section with Respect to Angle 58 2.3 Processing Codes NJOY and AMPX . . . . 61
2.4 Sensitivity and Uncertainty Analysis O verview . . . . 62
3 Methods 65 3.1 Experim ental . . . . 65
3.2 Resolved Resonance Region Evaluation . . . . 68
3.2.2 Treatment of the High Energy External Levels . . . . 74
3.2.3 Treatment of the Negative-Energy External Levels . . . . 76
3.2.4 Treatment of Angular Distributions . . . . 76
3.3 Benchmarking Procedure . . . . 80
3.4 Coupling the SAMMY and TSURFER codes: Coupled Differential and Integral Data Analysis . . . . 82
4 Results 89 4.1 Total Thermal Cross Section Measurements . . . . 89
4.2 New Resolved Resonance Region Evaluation . . . . 91
4.2.1 Self-Shielding . . . . 98
4.2.2 Differential Cross Section with Respect to Angle . . . . 100
4.2.3 Temperature Broadening of Angular Distribution of Scattering 110 4.3 Integral Benchmark Results . . . . 110
4.4 Results of Coupling Differential and Integral Data Analysis . . . . 117
4.4.1 Initial Covariance Data . . . . 118
4.4.2 Results of Resonance Parameter Adjustments Based on Anal-ysis of Intermediate-Spectrum Zeus Integral Experiments . . . 124
4.4.3 Results of Resonance Parameter Adjustments Based on Anal-ysis of LCTO42 Integral Experiments . . . . 140
4.4.4 Discussion of Covariance Updating . . . . 147
4.4.5 Updated Covariance Data Based on Analysis of Intermediate-Spectrum Zeus Integral Experiments . . . . 147
4.4.6 Updated Covariance Data Based on Analysis of LCT042 Integral Experiments . . . . 148
4.4.7 Impact of New Coupling Methodology . . . . 155
5 Conclusions 157
B Radiate Capture Cross Section Measurements in the Thermal En-ergy Region at the neutron-TOF Experiment at the MITR 169
B.1 Introduction . .. .. ... . . . .. . . . . 169
B.2 Background ... ... 170
B.3 Methods ... ... 171
B.3.1 Experimental Set-up ... ... 171
B.3.2 Experimental Procedures ... . 172
B.4 Prelim inary Results ... 174
B.5 D iscussion . . . . 174
B.6 Conclusions . . . . 176
C Selected Integral Benchmark Experiments 177 C.1 H M F072 . . . . 177 C.2 H M I006 . . . . 178 C .3 LCToo9 . . . . 181 C.4 LCT012 . . . . 182 C .5 LCT013 . . . 185 C.6 LCT016 ... ... ... .. ... ... ... 186 C.7 LCT042 ... .. . ... . . . .. .. . . . .. .. . .. . .. . . . 188
List of Figures
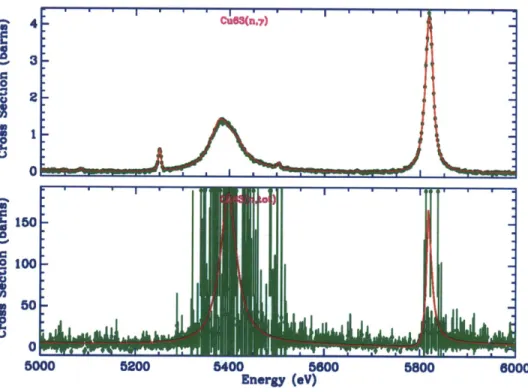
2-1 A diagram showing the different regions of microscopic cross sections. The fictitious line in the graph gives an illustration of the behavior of the cross section in each energy region. . . . . 42 2-2 A flow chart showing the life cycle of nuclear data. . . . . 45 2-3 An example of a black resonance in the total cross section (bottom) for
63Cu and the complimentary capture data (top). The evaluated cross
section (red) is plotted on top of experimental data (green) shown with one standard deviation uncertainty. . . . . 49 2-4 An example of a black resonance in the total cross section (bottom) for
6 3Cu and the complimentary capture data (top). The evaluated cross
section (red) is plotted on top of experimental data (green) shown with one standard deviation uncertainty. Unlike Figure 2-3, the black
resonance in the total cross section is hiding two resonances that would
not have been identified were it not for the capture data. . . . . 50 2-5 Plots of the experimental capture data of 63Cu (top) and 6 5Cu
(bot-tom). The evaluated cross section (red) is plotted on top of experi-mental data (green) shown with one standard deviation uncertainty. Even though the 65Cu sample is more than 99% pure, the resonance from the 63Cu impurity can be seen . . . . . 55
3-1 A schematic view of the MITR. . . . . 66
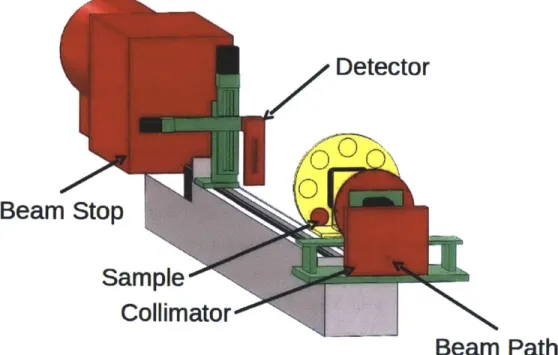
3-2 A schematic view of the neutron TOF experiment at MITR. . . . . . 67 3-3 Calculated multiple scattering correction for the 63Cu (n,-y) reaction. 73
3-4 Plot of the capture cross section (top) and the total cross section (bot-tom) as reconstructed from a preliminary evaluation for 3Cu with only
the transmission data evaluated up to 300 keV. The evaluated cross section (red) is plotted on top of experimental data (green). To reduce clutter, the uncertainty on the experimental cross section is not plotted. 75 3-5 Coefficient of Legendre polynomial of the first order for the elastic
scattering angular distribution of 15Cu as a function of energy plotted at different temperatures. . . . . 78 3-6 A flow chart showing the life cycle of nuclear data with the newly
developed feedback loop shown with the red arrow on the left side of the diagram . . . . 83 3-7 238 group structure superimposed on the new resonance evaluation of
63Cu... ...
85
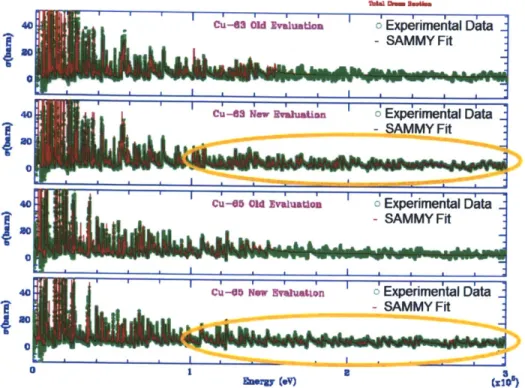
4-1 Plot of the thermal cross section data measured at MITR with one standard deviation uncertainty (green) versus the cross section recon-structed from the new evaluations (red). The total thermal cross sec-tion of 63Cu is given in the top plot and 15Cu in the bottom. . . . . . 90 4-2 New RRR evaluation versus ENDF/B-VII.1 evaluation. All four plots
show the evaluated total cross section (red) plotted on top of the exper-imental data with one standard deviation uncertainty (green). The top two plots compare the ENDF/B-VII.1 evaluation (first plot) versus the new evaluation (second plot) for 63Cu. The bottom two plots compare the ENDF/B-VII.1 evaluation (third plot) versus the new evaluation (fourth plot) for 65Cu. . . . . 92
4-3 New RRR evaluation (blue) versus ENDF/B-VII.1 evaluation (red), (n,-y) reaction. . . . . 93 4-4 6 3
Cu (n,tot) ENDF/B-VII.1 (top) vs new evaluation (bottom). The evaluated cross section (red) is plotted on top of experimental data (green) shown with one standard deviation uncertainty. . . . . 94
4-5 "Cu (n,-y) ENDF/B-VII.1 (top) vs new evaluation (bottom). The evaluated cross section (red) is plotted on top of experimental data
(green) shown with one standard deviation uncertainty. . . . . 95
4-6 "5Cu (n,tot) ENDF/B-VII.1 (top) vs new evaluation (bottom). The evaluated cross section (red) is plotted on top of experimental data
(green) shown with one standard deviation uncertainty. . . . . 96
4-7 65Cu (n,y) ENDF/B-VII.1 (top) vs new evaluation (bottom). The
evaluated cross section (red) is plotted on top of experimental data (green) shown with one standard deviation uncertainty. . . . . 97
4-8 The self-shielding factor for capture for "Cu for the new evaluation (red) and for ENDF/B-VII.1 for six energy groups (blue). Note that the limits of the vertical axis, Self-Shielding Factor, change between different energy groups. . . . . 101
4-9 The self-shielding factor for capture for 6 5Cu for the new evaluation (red) and for ENDF/B-VII.1 (blue) for six energy groups. Note that the limits of the vertical axis, Self-Shielding Factor, chnge between different energy groups. . . . . 102
4-10 6 3Cu (n, -y) cross section from the ENDF/B-VII.1 evaluation. . . . . . 103
4-11 Differential scattering cross section with respect to angle plotted at incident neutron energy of 30 keV for 63Cu. . . . . 105 4-12 Elastic scattering angular distribution for carbon from ENDF/B-V. . 106
4-13 First coefficient of expansion for the angular distribution of scattering for 6 C U. . . . .
107
4-14 Second coefficient of expansion for the angular distribution of scatter-ing for 63Cu. . . . . 108 4-15 Third coefficient of expansion for the angular distribution of scattering
4-16 Comparison of the newly developed direct temperature broadening technique for angular distributions versus computation of angular dis-tributions from temperature broadened differential cross sections gen-erated by SAMMY. The first Legendre coefficient, a, (E), of the elastic scattering distribution for 65Cu is plotted. . . . .111
4-17 Plot of the capture to scattering ratio in copper for LCT012 case 9 as a function of energy. . . . . 114
4-18 Computed values divided by experimental values (C/E) for the four intermediate-spectrum Zeus cases. For data with solid connecting lines, the angle integrated cross sections were reconstructed from the new resolved resonance region evaluation and the angular distribution of elastic scattering was used as noted in the figure legend. The data points connected with the dashed line and labeled as "ENDF/B-VII.1 Evaluation" are given as a reference and come from the calculation using the entire ENDF/B-VII.1 evaluation for copper. The thin black lines represent the model benchmark 1- uncertainty bands. . . . . 116
4-19 63Cu (n,-y) relative standard deviation; the diagonal of the covariance matrix. Only groups 11 through 44 are plotted because there is no high energy covariance data for 63Cu. . . . . 120
4-20 6
1Cu (n,-y) relative standard deviation; the diagonal of the covariance
matrix. Only groups 11 through 44 are plotted because there is no high energy covariance data for 5Cu. . . . . 121
4-21 6 3Cu (n,-y) correlation matrix. Only groups 11 through 44 are plotted because there is no high energy covariance data for 6 3Cu. . . . . 122
4-22 65Cu (n,-y) correlation matrix. Only groups 11 through 44 are plotted because there is no high energy covariance data for 6 5
4-23 Suggested relative changes for 63Cu (ny) cross section (red) based on feedback from the Zeus integral experiments and computed relative standard deviation (plotted as negative) on the 6 3Cu (n,y) cross section (green) from Figure 4-19. The relative standard deviation is plotted as negative to allow for a visual boundary for the suggested cross section changes from TSURFER. The vertical axis is dimension-less; the values represent the percent of the quantity in question. For example, a 4 value represents 4% of the capture cross section. . . . . 127
4-24 Suggested relative changes for 65Cu (ny) cross section (red) based on feedback from the Zeus integral experiments and computed relative standard deviation (plotted as negative) on the 6 5Cu (n,i) cross section (green) from Figure 4-20. The relative standard deviation is plotted as negative to allow for a visual boundary for the suggested cross section changes from TSURFER. The vertical axis is dimension-less; the values represent the percent of the quantity in question. For example, a 4 value represents 4% of the capture cross section. . . . . 128
4-25 Suggested relative changes for 63Cu (n,els) cross section (red) based on feedback from the Zeus integral experiments and computed rela-tive standard deviation (plotted as negarela-tive) on the 63Cu (n,els) cross section (green). The vertical axis is dimension-less; the values repre-sent the percent of the quantity in question. For example, a 4 value represents 4% of the elastic scattering cross section. . . . . 129
4-26 Suggested relative changes for 6 5Cu (n,els) cross section (red) based on feedback from the Zeus integral experiments and computed relative standard deviation (plotted as negative) on the 65Cu (n,y) cross section (green). The vertical axis is dimension-less; the values represent the percent of the quantity in question. For example, a 4 value represents 4% of the elastic scattering cross section. . . . . 130
4-27 Relative changes for 63Cu (n,y) cross section made based on feedback from the Zeus integral experiments directly through adjustment of res-onance parameters. . . . 133 4-28 Relative changes for 65
Cu (n,-y) cross section made based on feedback from the Zeus integral experiments directly through adjustment of res-onance parameters. . . . 134 4-29 Relative changes for 13Cu (n,els) cross section made based on
feed-back from the Zeus integral experiments directly through adjustment of resonance parameters. . . . 135 4-30 Relative changes for 6 5Cu (n,els) cross section made based on
feed-back from the Zeus integral experiments directly through adjustment of resonance parameters. . . . 136 4-31 Difference between the adjusted and unadjusted 63Cu (n,y) cross
sec-tion. This figure presents the results shown in Figure 4-27 around 100 keV. Here, the results are plotted as the difference rather than the relative difference, as in Figure 4-27. It is evident that the abrupt jump seen in Figure 4-27 is a numerical artifact. . . . 137 4-32 Changes in the first Legendre coefficient for the angular distribution of
elastic scattering in 63Cu made based on feedback from the Zeus inte-gral experiments directly through adjustment of resonance parameters. The vertical axis is dimension-less. . . . . 138 4-33 Changes in the first Legendre coefficient for the angular distribution of
elastic scattering in 6
1Cu made based on feedback from the Zeus inte-gral experiments directly through adjustment of resonance parameters. The vertical axis is dimension-less. . . . . 139 4-34 Computed values divided by experimental values (C/E) for the four
intermediate-spectrum Zeus cases. The thin black lines represent the model benchmark la- uncertainty bands. The "Updated Evaluation" was updated based on the integral data feedback from the four intermediate-spectrum Zeus cases, HMI006 . . . . 141
4-35 Suggested relative changes for 6 3Cu (n,-y) cross section based on feed-back from the LCT042 integral experiments. The vertical axis is dimension-less; the values represent the percent of the quantity in ques-tion. For example, a 0.001 value represents 0.001% of the capture cross section. In comparison to Figures 4-23 through 4-26 note the changed scale of the vertical axis. . . . . 144 4-36 Relative changes for 6 3Cu (n,-y) cross section made based on feedback
from the LCT042 integral experiments directly through adjustment of resonance parameters. . . . . 145 4-37 6 3Cu (n,-y) relative standard deviation; the diagonal of the covariance
matrix. This covariance data has been updated based on the integral data feedback from the four Zeus experiments. Only groups 11 through 44 are plotted because there is no high energy covariance data for 6Cu. 149 4-38 6 5Cu (n,-y) relative standard deviation; the diagonal of the covariance
matrix. This covariance data has been updated based on the integral data feedback from the four Zeus experiments. Only groups 11 through 44 are plotted because there is no high energy covariance data for 65Cu. 150
4-39 6 3Cu (ny) correlation matrix. This covariance data has been updated based on the integral data feedback from the four Zeus experiments. Only groups 11 through 44 are plotted because there is no high energy covariance data for 6 3
Cu. . . . . 151 4-40 6 5Cu (n,-y) correlation matrix. This covariance data has been updated
based on the integral data feedback from the four Zeus experiments. Only groups 11 through 44 are plotted because there is no high energy covariance data for 65Cu. . . . . 152
4-41 63Cu (n,y) relative standard deviation; the diagonal of the covariance matrix. This covariance data has been updated based on the integral data feedback from the two LCT042 experiments. Only groups 11 through 44 are plotted because there is no high energy covariance data for 6 C U. . . . .
153
4-42 13Cu (n,-y) correlation matrix. This covariance data has been updated
based on the integral data feedback from the two LCTO42 experiments. Only groups 11 through 44 are plotted because there is no high energy covariance data for 6 3Cu. . . . .
154
A-1 A photograph of the MITR neutron-TOF experimental set up. . . . . 166 A-2 A photograph of the MITR neutron-TOF BF3 neutron detector. The
detector is behind the white polyethylene neutron collimator. . . . . . 167 A-3 A photograph of the MITR neutron-TOF cadmium neutron chopper. 168
B-1 Modification of the transmission experimental set up (inside the dotted lines) for the radiative capture measurements. . . . . 173 B-2 Output of the HPGe gamma ray detector for the background test run.
The bottom plot shows the entire energy domain of the detector with the number of counts on the vertical axis and the top plot is the zoomed
in look at the energy region selected within the box. . . . . 175 B-3 Gamma ray spectra plotted for the 6 3Cu, "Cu and background. . . . 175
C-1 The Zeus assembly mounted on the Comet machine . . . . 179 C-2 Vertical slice through the Zeus assembly . . . . 180 C-3 Neutron spectra for the four cases of HMI006 . . . . 182 C-4 Experiment tank, lattice plates for 3 clusters, and control/safety blades. 183 C-5 Typical critical configuration for LCT009. For the cases selected for
this work, the borated steel plates were replaced by copper plates. . . 183
C-6 Typical critical configuration for LCT012. For the cases selected for this work, the steel plates were replaced by copper plates. . . . . 185 C-7 Typical critical configuration for LCT013. For the cases selected for
this work, the steel plates were replaced by copper plates. . . . . 187 C-8 Typical critical configuration for LCT016. For the cases selected for
C-9 Neutron spectra for two cases of LCT016. The case 32 spectrum is not relevant for this work, only the case 20 spectrum is relevant. . . . . . 189 C-10 Typical critical configuration for LCT042. For the cases selected for
List of Tables
1.1 Average level spacing for different angular momenta for 63Cu and 65Cu. 32 1.2 List of ICSBEP benchmarks used in benchmarking the new copper
evaluation . . . . 35 1.3 List of new ICSBEP benchmarks containing copper from the Five-Year
P lan . . . . 35
2.1 Experimental data . . . . 48
4.1 Number of Resonances in 6 3,6 5Cu Evaluations. . . . . 92 4.2 Average level spacing for different angular momenta for 63Cu and 65Cu. 93 4.3 Resonance integral for several energy groups for ENDF/B-VII.1
evalu-ation and the new evaluevalu-ation for 63Cu and 65Cu. One standard devia-tion uncertainty is reported on the resonance integral calculated form the new evaluation based on the new covariance data. There is no covariance data for 13,65Cu in the ENDF/B-VII.1 library. . . . . 99 4.4 Comparison of the newly developed direct temperature broadening
technique for angular distributions versus computation of angular dis-tributions from temperature broadened differential cross sections gen-erated by SAMMY. The first Legendre coefficient, a,(E), of the elastic scattering distribution for 65Cu reported. . . . .111 4.5 Computed values divided by experimental values (C/E) for 23 critical
experiments containing copper. One standard deviation stochastic un-certainty is given. The last column shows the improvement (movement towards unity) in units of pcm. . . . . 113
4.6 Computed values divided by experimental values (C/E) for the four intermediate-spectrum Zeus cases. One standard deviation stochastic uncertainty was approximately 35 pcm for all cases. . . . 115 4.7 6 3Cu (n,y) relative standard deviation; the diagonal of the covariance
m atrix. . . . 119 4.8 65Cu (n,-y) relative standard deviation; the diagonal of the covariance
m atrix. . . . 120 4.9 63Cu (n,els) relative standard deviation; the diagonal of the covariance
m atrix. . . . . 124 4.10 65Cu (n,els) relative standard deviation; the diagonal of the covariance
m atrix. . . . . 125 4.11 Examples of suggested cross section changes from the Zeus integral
benchmark feedback. A sampling of reactions, energy groups and iso-topes is presented. The full TSURFER output consists of suggested changes for all reactions, all energy groups and all isotopes. . . . . 125 4.12 Computed values divided by experimental values (C/E) for 23 critical
experiments containing copper. One standard deviation stochastic un-certainty is given. The "Updated Evaluation" was updated based on the integral data feedback from the four intermediate-spectrum Zeus cases, HMI006. The last two columns show the improvement (move-ment towards unity) in units of pcm. "New" refers to the new evalua-tion based only on differential experimental data. . . . . 142 4.13 Computed values divided by experimental values (C/E) for 23 critical
experiments containing copper. One standard deviation stochastic un-certainty is given. The "Updated Evaluation" was updated based on the integral data feedback from the two LCT042 cases. The last two columns show the improvement (movement towards unity) in units of pcm. "New" refers to the new evaluation based only on differential experimental data. . . . . 146
4.14 6 3Cu (n,-y) relative standard deviation; the diagonal of the covariance matrix. This covariance data has been updated based on the integral data feedback from the four Zeus experiments. . . . . 148 4.15 65Cu (n,-y) relative standard deviation; the diagonal of the covariance
matrix. This covariance data has been updated based on the integral data feedback from the four Zeus experiments. . . . . 149 4.16 63Cu (n,els) relative standard deviation; the diagonal of the covariance
matrix. This covariance data has been updated based on the integral data feedback from the four Zeus experiments. . . . . 150 4.17 6 5Cu (n,els) relative standard deviation; the diagonal of the covariance
matrix. This covariance data has been updated based on the integral data feedback from the four Zeus experiments. . . . . 151 4.18 63Cu (n,i) relative standard deviation; the diagonal of the covariance
matrix. This covariance data has been updated based on the integral data feedback from the two LCT042 experiments. . . . . 152
B.1 Characteristic y rays of the 63Cu(ny)6 4Cu and 61Cu(n, y)66Cu reactions 170 B.2 Results of Set-up Diagnostics Experiments . . . . 174
C.1 U(4.31)0 2 Fuel-Rod Cluster Critical Configures with Copper Plates . 184
C.2 U(2.35)0 2 Fuel-Rod Cluster Critical Configures with Copper Plates . 184
C.3 U(4.31)0 2 Fuel-Rod Cluster Critical Configures with Copper Plates . 186 C.4 U(2.35)0 2 Fuel-Rod Cluster Critical Configures with Copper Plates . 188
Chapter 1
Introduction
Over the past decade, large discrepancies between the computed and the experimen-tally recorded keff of criticality safety benchmark experiments containing copper were noticed by the nuclear data and criticality safety community [23]. The most notable of these benchmarks is the set of Highly Enriched Uranium METal fuels with cop-per reflectors from the Zeus excop-periment, that is, HEU-MET, from the International Criticality Safety Benchmark Evaluation Project (ICSBEP) [5].
In the world of nuclear fission, copper is used as a minor structural material in many nuclear facilities. In fact, a quick search through the ICSBEP handbook reveals that copper is significant in 32 of the 586 evaluated criticality safety benchmarks and found in 1084 cases out of 4708 documented cases in ICSBEP. Copper is also an important structural component in Scandinavian spent fuel casks [22].
Copper is an important heat sink material for fusion power reactors and is also used for diagnostics, microwave wave guides and mirrors in the International Ther-monuclear Experimental Reactor (ITER). The available nuclear data evaluations for stable 6 ,'5Cu isotopes are not as consistent as required for accurate activation and particle transport calculations in fusion systems. Consistent and correct data eval-uations are of high priority for applications to the International Fusion Materials Irradiation Facility (IFMIF) where the equipment must resist high energy particle irradiation. As a prerequisite the general purpose neutron data files must include all information required for a wide spectrum of nuclear analyses including simulations
of neutrons and the assessment of the nuclear heating, damage and gas production. The more accurate nuclear data is an important element of quality assured analyses for the design and optimization of all fusion related facilities including ITER and its planned successor reactor, DEMOnstration Power Plant (DEMO), as well as the IFMIF neutron source.
The neutron cross section of the copper isotopes is also important to the astro-physics community. The two stable isotopes of copper lie along the beta-decay valley of stable isobars involved in the s-process or slow-neutron-capture-process. In the s-process, a nucleus captures a neutron and then beta-decays to produce heavier isotopes. The s-process occurs in stars and is responsible for the creation of approxi-mately half of the stable isotopes heavier than iron and therefore plays an important role in the galactic chemical evolution. Improving the evaluation copper evaluations will aid astrophysicists in reduce the uncertainty in current models of the universe.
In order to improve the systematic procedure for requesting nuclear data for crit-icality safety applications, the Department of Energy (DOE) has developed a mech-anism by which criticality safety practitioners are able to identify their data needs. To undertake this responsibility, the DOE has established the Nuclear Data Advisory Group (NDAG). NDAG maintains and constantly updates lists of materials that are considered important for applications in nuclear criticality safety. Surveys of the sta-tus of existing nuclear data included in the listing are made. The results from this investigation are reported, and ranks of the most-needed evaluated nuclear data are issued. In particular, the two copper isotopes (6 3
,65Cu) were identified on this list as "Important for measurement and evaluation in the next five years." [26]
In general, the new copper evaluation will contribute to the overall improvement of nuclear data. Due to the interdependent nature of nuclear data, mathematically described by the covariance, the reduction of the uncertainty in the evaluation of one isotope will allow for the reduction in the uncertainties of other isotopes. Currently, in the computational modeling of criticality safety systems the uncertainty on keff is inferred by the propagation of nuclear data uncertainties rather than the uncertainty of the numerical solvers (i.e. stochastic uncertainty on kejj of MCNP simulations).
Therefore, reducing the uncertainty on the nuclear data is the primary mechanism for reducing the uncertainty on the computed keji.
In the safety-oriented nuclear engineering world, managing uncertainties on fun-damental parameters is crucial. With so much concern placed on not ever having a criticality accident in fuel storage, processing and transportation, the designers of these systems must be absolutely certain that such an event can never occur. However, large uncertainties in the neutron cross sections of materials used in these systems, such a copper, propagate through the modeling process and result in large uncertainties in the predicted behavior of the system. When it comes to the ques-tion of the probability of nuclear criticality accidents, large uncertainties are simply unacceptable. Without reducing the uncertainties on the input neutron cross section for the structural materials by evaluating new experimental data, the only solution to the safety concern is to severely over design these systems. The practice of over
designing these systems involves either putting less fuel in the storage containers than
the calculated minimum or putting more neutron absorbing materials around the fuel in order to compensate for the fact that the behavior of these systems cannot be calculated from fundamental parameters to within a reasonable uncertainty. This practice is economically wasteful is two regards. First, there is obviously additional money spent on the materials and construction of a container or facility for a nominal amount of fuel material that has been designed larger than it needs to be. Second, in such a practice, the extra money spent does not go at all to mitigating the problem in the future. On the other hand, investing the funds in better the nuclear data; the fundamental input for the calculations and the source of most of the final uncer-tainty, does result in less uncertainty on the predicted behavior of these systems in the future. With new cross section evaluations and reduced uncertainties on the cross section, the uncertainty on the modeling of nuclear systems will continue to decrease until the nuclear data is no longer the major source of uncertainty is the predicted behavior.
The interconnectedness of nuclear data, described above, reveals another hidden economic benefit from a new neutron cross section evaluation of copper. Many of
the ICSBEP criticality safety benchmark experiments were proposed, designed and built with the primary goal of benchmarking neutron cross sections for a specific set of isotopes of interest. There are many other uses for those experiments as well, but their primary purpose was to allow the evaluations of important isotopes to be validated in an integral manner. For example, the Zeus, intermediate-spectrum experiments were designed to test the neutron cross section of "5
U in the intermediate energy range as well as the cross sections of copper and graphite. However, at the current state of the evaluated data libraries, the Zeus critical benchmarks are of not much use in benchmarking the 25U intermediate energy neutron evaluation because of the large uncertainty in the final integral parameters that propagates from the uncertainty in the copper evaluation. A new resolved resonance region (RRR) evaluation for copper with reduced uncertainties will revive the Zeus criticality benchmark experiment to its original intent and purpose. This is an example of how, due to the interconnectedness of nuclear data, new copper cross section evaluations can influence the improvement of the 2 31U cross section.
The goal of this Ph.D. work was to produce new, more accurate resolved resonance region evaluations for the two isotopes of copper, 6 3,'6Cu, by developing a systematic feedback loop between integral and differential experiments. Such a feedback loop has been applied to the preliminary evaluations to produce new 13,1Cu resonance evaluations superior in quality to those possible based on differential experimental data alone. Several new approaches to evaluating the differential experimental data were also implemented for the preliminary resonance evaluation. Experimental cross section measurements versus energy in the thermal energy region were conducted for the first time for the isotopes of copper. New experimental data in this energy region allowed for a unique and more accurate treatment of the negative energy external levels in the resonance evaluations. Furthermore, the capture cross section has been experimentally measured and evaluated for copper for the first time. The resolved resonance region of the two copper isotopes was extended three-fold, from 99.5 keV to 300 keV. Hundreds of new resonances have been identified for each isotope and an automated program has been developed to identify the quantum angular
momentum of each resonance. The state of the art Reduced R-matrix approximation of the Reich-Moore formalism has been used for the new evaluations. Along the way, studies of the statistical distributions laws of quantum physics were carried out in the context of the resonance region of copper. Differential scattering cross sections were generated and utilized for improving the performance of neutronics codes. A study of the impact of high fidelity angular distributions was made and the results point to a non-trivial effect on criticality as well as more self-consistent nuclear data. The mathematical formulation for the temperature broadening of angular distributions was also developed. Realistic uncertainty and covariance data was generated. All of the new methodology developed in this research, has been developed for general resolved resonance region evaluations and can be fully applied to elements other than copper. The new methods can be applied to new and existing evaluations to extend and improve the resolved resonance region evaluations, and consequently cross section data libraries, beyond the limitations of only evaluating differential experimental data.
1.1
Experimental Data
Experimental cross section data versus incident neutron energy, the basis for resolved resonance region evaluations, was quite limited for 6 3,61Cu before this work. Only two sets of transmission data were previously measured for each isotope of copper. As will be discussed in Section 2.2 it is near impossible to produce a resolved resonance region evaluation for general use on such a limited amount of experimental data. The only other experimental data supporting a resonance evaluation of copper came from integral cross section measurement techniques, described in Section 2.2.1. Integral cross section measurements result in a single cross section value representing the reaction cross section over a set energy range, such as the thermal energy region. This data, while useful, is not an ideal experimental method for resolved resonance region analysis.
The two sets of transmission data that had been measured before the beginning of this work come from measurements made by Pandey, et al. at ORELA [28] in 1977.
The first of these data sets is from 32 eV to 185 keV and the second data set is from 1 keV to 1.4 MeV. The first data set has better energy resolution than the second set in the energy region below 10 keV. The second data set has significantly better energy resolution at energies above approximately 60 keV.
To address this deficiency in the experimental cross section data, three new exper-imental measurements have been made during the course of this research. The total thermal cross section versus energy was measured for the two isotopes of copper for the first time at the MIT Nuclear Reactor (MITR-II) using the time-of-flight (TOF) technique. See Section 3.1 for a detailed description of the experiment and Section 4.1 for the results. This experimental data was important in the evaluation work since it adds vital information for deriving good resonance parameters and uncertainties in the thermal energy region which integral cross section measurements in the thermal energy region cannot do alone. In addition, the measured total cross section data in the thermal range is also useful since it adds in the determination of energy bound levels for the compound nucleus (negative energies), see Section 3.2.3. Also for the first time, the capture cross section has been measured for the two isotopes of copper
(see Section 2.2.1). Experimental capture data is vital to completing a new resolved resonance region evaluation as will be fully discussed with examples in several of the subsections of Section 2.2.
1.2
Resolved Resonance Region Evaluation
The copper RRR evaluations in the ENDF/B-VII. 1 library are based on the resonance parameters from Neutron Cross Sections, Vol I by Mughabghab [25]. The authors of the copper evaluations contained in the ENDF/B-VII.1 library used these resonance parameters to fit the transmission data of Pandey et al. [28]. The upper bound on the energy of the resolved resonance region evaluation in ENDF/B-VII.1 was chosen simply where the resonance parameters of Mughabghab [25] stopped fitting the experimental data. No effort was made to identify new resonances at higher energies, even though there was experimental data available. The authors of the
ENDF/B-VII.1 6 3'6 5Cu evaluations noted that the fit to the experimental data was improved when an additional constant background was added. However, this yielded a total average cross section that was too large. In addition, the original authors indicated the need to include a capture background from 60 keV to 99.5 keV. It is noted here that the original evaluation for both isotopes did not include experimental capture data.
There are several statistical laws that any resolved resonance region evaluation can be tested against. The following three are the best known: 1) Wigner's law for the average level spacing of resonances, 2) Porter-Thomas resonance width distribution law 3) the Dyson and Mehta Long-Range Correlation of A3 Statistics Test for the number of levels versus energy. The exact physics of all three of these laws are laid out in the SAMDIST: A Compture Code for Calculating Statistical Distributions for R-matrix Resonance Parameters manual [20] and summarized in the following.
1. Wigner's law for the average level spacing of resonances: the difference in en-ergy between two consecutive resonance energies, Di, for the same total quan-tum angular momenquan-tum and parity exhibits random behavior. The statistical
distribution that best describes this behavior is called Wigner's law.
p(x)dx = -exp(- )d (1.1)
2 4
where x = Di/ < D > with < D > being the average of Di.
2. Porter-Thomas resonance width distribution law: the resonance widths, IF, for resonances of the same total quantum angular momentum and parity has ex-perimentally been shown to follow a X2 distribution. For one degree of freedom,
this distribution is known as the Porter-Thomas resonance width distribution law.
1 x
p(x)dx = exp(--)dx (1.2)
w /2h/ w 2
3. Dyson and Mehta Long-Range Correlation of As Statistics Test for the number of levels versus energy: the Dyson and Mehta Long-Range Correlation states that the number of observed energy levels should fit a straight line with respect to energy within a certain mean-square value and associated uncertainty. The definition is,
1 fEf
A3 =
min
-(N(E)
-aE
- b)2
dE
(1.3)
(a,b) nfE1
where n is the number of resonances between energies Ej and Ef and N(E) is the cumulative number of energy levels. The test predicts that the average theoretical value of A3 with associated standard deviation is,
= (1n(n) - 0.06871) T 19 (1.4)
It was found that the ENDF/B-VII.1 evaluation did not agree well with any of these statistical laws. For example, the average level spacing for different quantum angular momenta governed by Wigner's law is given in Table 1.1
In the ENDF/B-VII.1 evaluation, the angular distribution of secondary neutrons for elastic scattering was originally generated with the GENOA code. The angular distributions are represented as coefficients of Legendre polynomials. The ENDF for-malism for angular distributions will be shown in Seciton 2.2. There are only 4 energy points across the ENDF/B-VII.1 resolved resonance region for the representation of the angular distribution. They are le-5 eV, 0.0253 eV, 10 keV and 100 keV. With the new resolved resonance region extended to up to 300 keV, the fifth energy point at 300 keV is picked up. Obviously, this cannot be considered a high fidelity model
Table 1.1: Average level spacing for different angular momenta for 6 3Cu and "Cu.
63
Cu 65Cu
Angular Momentum s-wave p-wave s-wave p-wave
Mughabghab [24] 722±47 eV 404±22 eV 1520±100 eV 628±39 eV ENDF/B-VII.1 523±53 eV 2268±775 eV 771±83 eV 3132±360 eV
of angular distribution. It is noted in the ENDF file that angular distributions can be calculated by the user on a finer energy grid from the resonance parameters. This however, is not the option that is used.
Angular distributions of elastic scattering in the resolved resonance region on a sparse energy grid results in inconsistent nuclear data. Physically, the angular distri-bution of elastic scattering can be reconstructed from the resonance parameters and will have physical resonances at the resonance energies. Treating angular tions on a sparse energy grid ignores the resonance behavior of the angular distribu-tions and only gives an average behavior. Furthermore, not including resonances in the angular distribution, directly contradicts the instructions laid out in the ENDF manual, "Care must be exercised in selecting an incident energy mesh for certain light-to-medium mass materials. Here it is important to relate any known structure (resonances) in the elastic scattering cross section to the energy dependent variations in the angular distributions. These two features of the cross sections cannot be ana-lyzed independently of one another. Remember, processing codes operate on MT=2 (elastic scattering) data that are given in Files 3 (cross sections) and 4 (angular dis-tributions). (Structure of the total cross section is not considered when generating energy transfer arrays). It is better to maintain consistency in any structure effects between File 3 (cross sections) and File 4 (angular distributions) data than to intro-duce structure in one File and ignore it in the other.". Also, temperature broadening of the angular distribution is not possible with an average treatment. The mathemat-ical formulation of the temperature broadening of angular distributions is derived in Section 3.2.4.
In this work, a new resolved resonance region evaluation has been completed. A new routine has been developed for identifying the quantum angular momentum of resonances, external levels have been evaluated and special treatment, allowed by the newly measured experimental data, has been given to negative external levels. All of the methodology used in the new resolved resonance region evaluation is documented in Section 3.2. The quantum angular momentum distributions for the new evaluations have been generated, along with the angular distributions for the elastic scattering
cross section and the self-shielded cross section. All of these results are presented in Section 4.2.
1.3
Benchmarking
A survey of the possible benchmark experiments has revealed that there are many critical experiments documented in the ICSBEP containing copper. However, for many of these experiments, there are only trace amounts of copper in the materials or the copper is not in a neutronically-important location. Table 1.2 contains the list of criticality safety benchmarks where copper was identified to be important in criticality safety of the system. Appendix C contains more detailed information on each of the benchmarks selected. These are often scenarios where copper is considered the primary or secondary1 reflector material, neutron absorbing material or separation
material. Other benchmark experiments were also considered if the isotopes of copper accounted for a large percentage of neutrons captured in the system.
In addition to benchmark experiments currently documented in the ICSBEP, there are three more groups of criticality safety benchmarks identified in the NCSP Five Year Plan [26] to be completed that contain significant amounts of copper. They are
listed in Table 1.3 with a brief description of the set up.
The entire procedure used to benchmark the new resolved resonance region evalu-ations is outline in Section 3.3. The results of applying the benchmarking procedure are presented in Section 4.3.
1.4
Coupled Differential and Integral Data
Analysis
Accurate evaluated nuclear cross section data are needed for transport calculations for nuclear applications. In the cross section evaluation procedure, data evaluators
'As in the in the examples of alloyed materials such as Duralumin (Al, Fe, Cu) or Ni-Cu-Zn Alloys
Table 1.2: List of ICSBEP benchmarks used in benchmarking the new copper evalu-ation
ICSBEP Name Description
HMF072-01 Zeus: Fast-Spectrum Critical Assemblies with an Iron-HEU Core Surrounded by a Copper Reflector
HMI006-01 The Initial Set of Zeus Experiments: Intermediate-Spectrum HMI006-02 Critical Assemblies With a Graphite-HEU Core Surrounded by a HMI006-03 Copper Reflector
HMI006-04
LCT009-10 Water-Moderated Rectangular Clusters of U(4.31)0 2 Fuel
LCT009-11 Rods (2.54-cm Pitch) Separated by Steel, Boral, Copper, LCT009-12 Cadmium, Aluminum, or Zircaloy-4 Plates
LCT009-13 LCT009-14 LCT009-15
LCT012-09 Water-Moderated Rectangular Clusters of U(2.35)02 Fuel LCT012-10 Roads (1.684-cm Pitch) Separated by Steel, Boral, Boroflex,
Cadmium, or Copper Plates (Gadolinium Water Impurity)
LCT013-06 Water-Moderated Rectangular Clusters of U(2.35)0 2 Fuel LCT013-07 Roads (1.684-cm Pitch) Separated by Steel, Boral, Boroflex,
Cadmium, or Copper Plates with Steel Reflective Walls LCT016-15 Water-Moderated Rectangular Clusters of U(4.31)02 Fuel LCT016-16 Roads (1.892-cm Pitch) Separated by Steel, Boral, Boroflex, LCT016-17 Cadmium, or Copper Plates with Steel Reflective Walls LCT016-18
LCT016-19 LCT016-20
LCT042-06 Water-Moderated Rectangular Clusters of U(2.35)0 2 Fuel
LCT042-07 Rods (2.032-cm Pitch) Separated by Steel, Boral, Copper, Cadmium, Aluminum, or Zircaloy-4 Plates
Table 1.3: List of new ICSBEP benchmarks containing copper from the Five-Year Plan
ICSBEP Name Description
LEU-COMP-THERM-TBD Two LEU fuel rod arrays separated by large absorbing screens (Fe, Ni, Zr, Al, Pb, Cu) LEU-COMP-THERM-TBD Four LEU fuel rod arrays separated by large
absorbing screens (Fe, Ni, Zr, Al, Pb, Cu) IEU-MET-FAST-022 (SWEDEN) Diluted 20%-enriched "cylindrical"
include measured differential data from facilities such as ORELA with nuclear physics models in order to obtain the best representation of the measured data with covari-ance data. The evaluated differential data are tested and validated using radiation transport codes to compute measured integral parameters (i.e., neutron multiplica-tion factor) in well-characterized benchmark experiments. Typically, the benchmark testing results are communicated to the nuclear data evaluator with limited or qual-itative information that can be difficult to utilize in order to improve the differential evaluation.
The process of differential evaluation of the resolved resonance region is a mathe-matically over determined problem with no exact solution. Therefore, there is much choice left to the evaluator in seeking parameters that minimize a certain metric. Even once an evaluation is considered complete based on differential experimental data it is not unique and other possibilities exist that may satisfy the metrics used to determine the accuracy of the evaluation. A complete evaluation is not unique, simply because of the fact that the experimental data being analyzed has an associated uncertainty. Simply put, the experimentally measured cross section value at every energy point is only reported as a mean value and a standard deviation. Therefore, it is statistically equivalent for the reconstructed cross section (from the resonance parameters) to pass above or below the mean experimental value by the same amount. This ambiguous choice has been previously left simply to the expertise of the evaluator.
Much of the systematic uncertainty on differential cross section data comes from the normalization of capture and inelastic cross section measurements. These mea-surements rely on the experimenter having a high degree of knowledge of the experi-mental flux. Unfortunately, this is not always the case. In the best case, this results in larger uncertainties over certain energy regions of the experimental data. In the worst case, the experimental cross section data is miss-reported whether it is in the way of systematically larger or smaller mean values for the measured cross section or small uncertainty that does not reflect the actual state of knowledge. Unlike, the case of statistical uncertainty, systematic uncertainty can result in resolved resonance evaluations that produce a cross section that is too high over a large energy region.
It is, therefore, the uncertainty on the normalization of experimental data, which is of biggest concern in completing a new resolved resonance region evaluation based on differential experimental data.
Providing additional information that may dissolve ambiguity between equivalent choices can help this problem. In the case of differential cross section evaluation, the additional helpful information comes from integral experiments. Valuable informa-tion can be extracted from well-known integral experiments and used as a guide in
the differential analysis. If the choice of having the cross section pass above rather than below an experimental point by the same amount (or visa-versa) results in an overall better performance in integral benchmark calculations, it must be the correct choice in the previously ambiguous decision. The TSURFER module of the Stan-dardized Computer Analyses for Licensing Applications (SCALE) [4] code package is a tool capable of suggesting multi-group data adjustments based on nuclear data performance in integral benchmark calculations. The methodology of the TSURFER code is briefly described is Section 2.4 and fully in the SCALE6 manual [4].
However, the TSURFER code only provides multi-group cross section adjustments which does not adjust the neutron cross sections in a self-consistent method nor take into account any information from experimental cross section measurements. The current implementation of TSURFER cannot provide suggested changes for differ-ential cross section with respect to angle (sometimes referred to as, 2-Dimensional cross section data) nor double differential cross sections with respect to angle and outgoing energy (sometimes referred to as 3-Dimensional cross section data). Adjust-ing the integrated cross section, without adjustAdjust-ing the underlyAdjust-ing differential cross section results in self-inconsistent nuclear data. Furthermore, multi-group cross sec-tion adjustments done with the TSUREFER code do not take into account either the experimentally measured cross sections nor the reported uncertainty of those experi-mental measurements. Therefore, it is possible for TSURFER to suggest cross section changes that will be inconsistent with experimental cross section measurements.2
2
Much care must be given to generate proper covariance matrices for the resonance parameters and the individual reaction cross sections in order to prevent this from happening. High fidelity covariance analysis is rare in nuclear data.
In the methodology developed as part of this research, the multi-group cross sec-tion adjustments suggested by TSURFER are coupled directly to changes in the resonance parameters of the resolved resonance region. Cross section values, recon-structed from resonance parameters, are only changed within the uncertainty of the experimental data. By coupling the suggested data changes from integral experi-ments directly to the resonance parameters, the double differential cross sections are adjusted simultaneously and consistently with the angle-integrated cross sections. Furthermore, the covariance data of the resolved resonance region evaluation is up-dated to reflect the true state of knowledge. Previous to this work, no methodology existed for using information from integral benchmarks to update the evaluation of the covariance data.
The overall objective of this project was to couple, for the first time, the modern R-matrix resonance analysis tool SAMMY [17] with modern radiation transport sensi-tivity/uncertainty (S/U) analysis tools to enable differential cross section evaluations to be developed with the pertinent integral data. Such a tool ties together the basic science research tool with the nuclear application analysis tool thereby enabling the streamlined analysis of measured cross section data to produce cross section evalua-tions with covariance data for use in radiation transport analyses of nuclear systems. In this work, the analysis tool has been developed and used to analyze recently ob-tained data for both copper isotopes to produce new cross section data libraries that have been demonstrated in criticality safety application analysis.
Chapter 2
Background
2.1
Introduction to Nuclear Data
Nuclear data is used in almost all aspects of the nuclear science and engineering industry. Microscopic cross sections, which can be simply defined as a measure of the probability of interaction between neutrons of different energies and the nucleus, make up a vast portion of the nuclear data field. The microscopic cross section of all isotopes have several distinct regions that appear with increasing energy of the incident neutrons. Figure 2-1 gives the names and order of the different neutron energy regimes that appear in all microscopic cross sections. The microscopic cross sections behave differently in different energy regimes.
* Thermal Energy Region: This energy region is defined up to the energy of the first nuclear resonance that appears in a given isotope. The energy of the first resonance for a given isotope is determined by the nuclear structure of that isotope, but typically occurs somewhere between 1 eV and 1 keV. In the thermal energy region, the behavior of the cross section is smooth, with the capture reaction cross section roughly behaving' as 1/VE and the scattering cross section being roughly constant and governed by potential scattering.
'Section 2.2 discusses the fact that the 1/V' behavior is an approximation rather than an exact phenomenon
* Resolved Resonance Region: Nuclear resonances at neutron energies determined by the structure of the nucleus introduce extreme fluctuations in the neutron cross section. The neutron is much more likely to interact with the target nucleus when the energy of the incident neutron falls at one of the excited states of the compound nucleus. The compound nucleus is the name of the short lived state that the target nucleus and the incident neutron form immediately after contact. The resolution of experimental machines is smaller than the width of the resonances in this energy region. Therefore, resonances can be distinguished or seen individually rather than just the lump behavior being measured. Cross section representation of the thermal and the resolved resonance region can be made by resonance parameters. The details of the quantum mechanical models describing these regions are given in Section 2.2
* Unresolved Resonance Region: Even though, the physics of the nuclear inter-action does not change in the transition from the resolved resonance region to the unresolved resonance region, the capability of the experimental machines changes. The experimental resolution goes from being smaller than the width of the resonances to being larger than the width of the resonances. Individual resonances can no longer be recognized. In practice, another consideration can come into play in determining where the resolved resonance region stop and the unresolved begins. Often the unresolved resonance region begin where the reso-nance self-shielding of the isotope's cross section no longer matter even though the resolution of the differential experimental measurements can stretch far be-yond this energy. The amount of effort involved in doing a resolved resonance region evaluation outweighs the benefits to reactor physics of the improved state of knowledge of the cross sections. The cross sections in the unresolved resonance region are represented in the form of probability tables. For most isotopes the unresolved resonance region lies somewhere between 1 keV and 1 MeV. However, unresolved resonance region evaluations do not exist for all isotopes that have resolved resonance region evaluations.