HAL Id: inserm-00439670
https://www.hal.inserm.fr/inserm-00439670
Submitted on 8 Dec 2009HAL is a multi-disciplinary open access archive for the deposit and dissemination of sci-entific research documents, whether they are pub-lished or not. The documents may come from teaching and research institutions in France or abroad, or from public or private research centers.
L’archive ouverte pluridisciplinaire HAL, est destinée au dépôt et à la diffusion de documents scientifiques de niveau recherche, publiés ou non, émanant des établissements d’enseignement et de recherche français ou étrangers, des laboratoires publics ou privés.
RNA profiles of rat olfactory epithelia: individual and
age related variations.
Maud Rimbault, Stéphanie Robin, Amaury Vaysse, Francis Galibert
To cite this version:
Maud Rimbault, Stéphanie Robin, Amaury Vaysse, Francis Galibert. RNA profiles of rat olfactory epithelia: individual and age related variations.. BMC Genomics, BioMed Central, 2009, 10 (1), pp.572. �10.1186/1471-2164-10-572�. �inserm-00439670�
This Provisional PDF corresponds to the article as it appeared upon acceptance. Fully formatted PDF and full text (HTML) versions will be made available soon.
RNA profiles of rat olfactory epithelia : individual and age related variations
BMC Genomics 2009, 10:572 doi:10.1186/1471-2164-10-572
Maud Rimbault ([email protected]) Stephanie Robin ([email protected])
Amaury Vaysse ([email protected]) Francis Galibert ([email protected])
ISSN 1471-2164
Article type Research article
Submission date 21 August 2009
Acceptance date 2 December 2009
Publication date 2 December 2009
Article URL http://www.biomedcentral.com/1471-2164/10/572
Like all articles in BMC journals, this peer-reviewed article was published immediately upon acceptance. It can be downloaded, printed and distributed freely for any purposes (see copyright
notice below).
Articles in BMC journals are listed in PubMed and archived at PubMed Central.
For information about publishing your research in BMC journals or any BioMed Central journal, go to
http://www.biomedcentral.com/info/authors/
BMC Genomics
RNA profiles of rat olfactory epithelia : individual and
age related variations
Maud Rimbault1,2, Stéphanie Robin1,2, Amaury Vaysse1,2, Francis Galibert1,2,§
1 - Université de Rennes 1, Institut de Génétique et Développement de Rennes, UEB,
Faculté de Médecine, Rennes, France
2 - UMR 6061 Institut de Génétique et Développement de Rennes, CNRS - Université
Rennes 1, Rennes § Corresponding author E-mail addresses: MR:[email protected] SR:[email protected] AV:[email protected] FG:[email protected]
Abstract
Background
Mammalian genomes contain a large number (~1000) of olfactory receptor (OR)
genes, many of which (20 to 50 %) are pseudogenes. OR gene transcription is not
restricted to the olfactory epithelium, but is found in numerous tissues. Using
microarray hybridization and RTqPCR, we analyzed the mRNA profiles of the
olfactory epithelium of male and female Brown Norway rats of different origins and
ages (newborn, adult and old).
Results
(1) We observed very little difference between males and females and between rats
from two different suppliers. (2) Different OR genes were expressed at varying levels,
rather than uniformly across the four endoturbinates. (3) A large proportion of the
gene transcripts (2/3 of all probes) were detected in all three age groups. Adult and
older rats expressed similar numbers of OR genes, both expressing more OR genes
than newborns. (4) Comparisons of whole transcriptomes or transcription profiles of
expressed OR genes only showed a clear clustering of the samples as a function of
age. (5) Most OR genes were expressed at lower levels at birth than in older animals,
but a small number of OR genes were expressed specifically or were overexpressed in
newborns.
Conclusions
Not all OR genes are expressed at a detectable level. Pups expressed fewer OR genes
than adult rats, and generally at a lower level; however, a small subset of OR genes
are not understood. However, the specific expression of some OR genes in newborn
olfactory epithelia may be related to the blindness and deafness of pups at birth, when
these pups are heavily reliant on olfaction and their mother.
Background
Olfactory receptor (OR) genes were first identified in the rat nasal epithelium by Buck
and Axel in 1991 [1]. The receptors they encode play an essential role in olfaction,
constituting a key initial element in a cascade of biochemical reactions that lead to
odorant perception and recognition. Gene cloning and in silico mining of a number of
mammalian genome sequences have identified about 800 OR intact genes and
pseudogenes in the human genome [2, 3] and up to 1500 OR genes (including
pseudogenes) in the rat genome [4]. Indeed, these genes constitute by far the largest
gene family in mammalian genomes.
A substantial percentage of OR genes — 50% in humans [5], 24% in mouse [6],
20.3% in dog and 19.5% in rat [4] — are pseudogenes. However, the distinction
between pseudogenes and potentially active genes is not strictly defined: for example,
a particular gene may exist as either a pseudogene or a potentially active gene,
depending upon the population or the individual, as shown for dogs [7] and for
humans [8].
Only a small number of OR proteins have been deorphanized, i.e. the ligand that they
bind to has been identified, and the role of the vast majority of these proteins in
olfaction remains undefined. Cloning experiments and microarray analyses have
added an additional layer of complexity by showing that at least some pseudogenes
restricted to the nasal mucosa, but is also detected in several other tissues, including
testis [11] and kidney [12].
ORs are expressed on the surface of the cilia of olfactory sensory neurons (OSNs)
lining the neuroepithelium in the nasal cavity, the site of odorant inhalation [13]. Each
OSN expresses one OR from a single allele [14-18]; their axons extend to the
olfactory bulb, where the axons of all OSN expressing the same OR converge on a
single glomerulus [19-21]. The mechanism by which axons of OSNs expressing the
same OR, but dispersed along the olfactory epithelium, converge on the same
glomerulus is not totally understood. However, ORs that are not restricted to OSN
cilia, but which are also present at the tip of the axons [22, 23] contribute, together
with other proteins, to the coalescence of the axons [21, 24-26].
Studies based on cDNA library analysis and microarray hybridization have shown
that only a subset of the mouse OR gene repertoire is expressed at detectable levels in
the olfactory epithelium [9, 27]. In humans, the pattern of transcription differs slightly
between individuals [10]. The importance of such differences is not known. In
particular, it is unclear whether these differences reflect individual differences in
sensory function, possibly related to some form of anosmia or hyperosmia, or whether
they reflect environmental differences. In this study, we carried out hybridization on
whole rat genome microarrays, to analyze the transcriptome of the olfactory
epithelium of adult Brown Norway rats of different origins and sex. The
transcriptomes of these rats were then compared with those of newborn and aged rats,
Results and Discussion
I - The olfactory epithelium transcriptome of adult Brown Norway rats
We determined the gene expression profiles of olfactory epithelia from six-week-old
rats not exposed to a particular odorant (naive animals). We purchased four Brown
Norway rats (two males and two females) from Elevage Janvier and four rats of the
same strain (two males and two females) from Charles River Laboratories. After their
arrival, the animals were kept in the animal house for one week and were then killed.
Total RNA was extracted from left and right olfactory epithelia, labeled and used for
hybridization on Agilent Whole Rat Genome 44K microarrays, as described in the
Methods section. Microarrays were scanned and probes were assigned to three
groups: “expressed”, “weakly expressed” and “not expressed” (Figure 1).
Of all the probes spotted on the array, 26,701 (65%) gave a signal above background
for at least 11 of the 15 samples (≥73%) (Figure 2). These probes were considered to
correspond to the set of genes expressed to detectable levels. They included 732 of the
1136 OR genes spotted on the array (from a total of 1201 rat OR genes with an intact
open reading frame [4]; see additional file 1 for the OR gene list).
For probes that did not give either a positive or negative signal (above or below
background levels, respectively) for all samples, we compared the signal status of
each probe (positive or negative) in the right and left samples from each rat. We
observed two different scenarios for the 14 samples (corresponding to seven rats from
which we obtained the right and left samples): identical responses in the left and right
samples, and different responses for the left and right samples. For 668 probes, we
observed a 12+/2- distribution (12 samples showing positive signal and two showing
negative results); for 83 of these 668 probes, the two negative results were obtained
negative and positive signal was observed for 383 probes; 105 of these probes yielded
two positive results for the left and right samples from a single rat. Statistical analysis
(binomial test, p value < 10-4) of the data clearly demonstrated that both negative and
positive results were more frequently paired (right and left samples from the same
animal giving identical results) than would be expected if the distribution were
random. Probes giving different results for different samples presumably
corresponded to two groups of transcripts: one corresponding to a group of genes
poorly expressed at levels close to the detection limit of the method used, generating a
random distribution of negative and positive results; and a second group
corresponding to genes giving the same results for the right and left samples of an
individual (either both positive or both negative), and thus clearly expressed by some
animals and not expressed by others.
As discussed in more detail below, the set of probes corresponding to weakly
expressed or not expressed genes in these experiments depends on the sensitivity of
the detection method used. Nevertheless, the proportion of OR genes considered to be
expressed at detectable levels in this study is consistent with previous suggestions that
up to 76% of OR genes are expressed at a detectable level in the human olfactory
epithelium [10].
· Statistical analysis (t-test)
We performed a statistical analysis (t-test, p value < 0.01) to identify genes that were
differentially expressed between animals from two different suppliers and between
males and females.
Only 10 genes, none of which encoded an OR gene, were differentially expressed
different autosomal chromosomes plus the “Unknown” chromosome [28] (Table 1).
Six of these 10 genes were more strongly expressed, with levels twice as high, in the
Charles River rats than the Elevage Janvier rats. The other four of these genes were
expressed more strongly in rats from Elevage Janvier. One gene, Per3, was identified
twice by two independent probes, validating this finding. Per3 and Dbp, also
identified among these ten genes, are both involved in circadian rhythm [29-32].
We then compared gene expression in the olfactory epithelium between males and
females. Four genes, none of which encode an OR gene, were found to be expressed
more strongly in female olfactory epithelium (expression levels 1.7 times higher;
Table 2). Three of these genes are located on the RNOX (Rattus Norvegicus X)
chromosome, consistent with their stronger expression in females; the fourth gene is
located on RNO2. The Eif2s3x gene (on RNOX) was detected twice, by two
independent probes spotted onto the microarrays, again validating the differential
expression of this gene. Moreover, two of these four genes, Eif2s3x and Utx, have
previously been reported to be overexpressed in female mouse brain [33-35]. In line
with these results, studies on adult Sprague-Dawley rats [36] with Affymetrix
pangenomic arrays, or on mice [27] with arrays dedicated to OR and vomeronasal
(V1R only) genes have shown no detectable difference in OR gene expression
between sexes.
We performed hierarchical clustering and principal component analysis for the whole
set of expressed gene transcripts and with OR genes only (data not shown). The
absence of clear clustering using either of these two approaches, together with only a
very small number of genes identified in the t-test analysis, clearly demonstrates that
all animals expressed essentially the same genes to similar levels, regardless of their
· Real-time reverse-transcription PCR analysis (RTqPCR)
Microarray hybridization represents an efficient method of comparing RNA
expression levels between samples. However, as the hybridization efficiency and
kinetics differ between pairs of targets and probes, it does not provide a good estimate
of the relative abundance of mRNA within a sample. To overcome this limitation, we
performed RTqPCR with three RNA samples to evaluate the expression level of 77
OR genes selected to represent the entire OR gene repertoire. We also included G
α
olf,the G
α
subunit of OSN [37]. A mean difference of 6.5 Ct was observed between themost and least strongly expressed OR genes, corresponding to a 100-fold difference in
transcript levels (Figure 3). A gradual change in mRNA concentration was observed
between the highest and lowest amounts of transcript (Figure 3). In a previous study, a
difference of up to 300-fold between the least and most strongly expressed mouse OR
genes was calculated from the frequency at which OR mRNA clones were obtained
[9]. We found a mean difference of 6.2 Ct between G
α
olf and the most stronglyexpressed OR genes (i.e. G
α
olf mRNA levels 80 times higher; Figure 3). Gα
olf isexpressed by all neurons, whereas a particular OR gene is expressed by only a small
subset of neurons, estimated to constitute 0.1% of total OSNs [27]. Therefore, an
individual neuron, particularly in the case of OSNs bearing the most strongly
expressed OR, may contain more OR than G
α
olf mRNA. However, more copies ofOR than G
α
olf mRNA per OSN would not be beneficial in terms of efficient signaltransduction; rather, the number of G
α
olf mRNA copies may differ between OSNs,with more G
α
olf present in OSNs expressing larger amounts of receptor. Wecompared these Ct values with the microarray results. Most of the OR genes (64 out
experiments. Three OR genes (marked in red) were identified as not expressed and 10
(marked in yellow) were found to be weakly expressed. A small number of the
oligonucleotide pairs designed for RTqPCR experiments, corresponding to 15
additional OR genes, failed to amplify their cognate mRNA (data not shown). Eight
of them were later shown to be not expressed by the microarray analyses. Altogether,
these findings confirm that a majority of OR genes are indeed expressed in the
olfactory epithelium, displaying considerable variation in the range of expression
levels detected.
The four endoturbinates making up the olfactory epithelium were dissected
individually in one adult rat and the corresponding RNA samples used for RTqPCR
analysis with the same set of primers. We found that these 77 OR genes were
expressed differently between these four endoturbinates, whereas Gapdh and G
α
olfgenes were expressed at similar levels (Figure 4). Up to 26 OR genes were more
strongly expressed in endoturbinate II (Figure 4B), whereas the other ORs were more
abundant in one of the other three endoturbinates (Figure 4D to 4F). We did not find a
correlation between OR families and expression levels in any one endoturbinate.
Previous in situ hybridizations with 35S-labeled antisense OR RNA probes have
shown that neurons expressing individual receptors are topographically localized in
different radial zones [19-21]. The preferential expression of a number of OR genes in
a particular endoturbinate, as shown here, demonstrates another level of complexity in
the olfactory epithelium structure and extends our understanding based on previous
studies using electro-olfactograms [38].
We investigated olfactory epithelium mRNA profiles at various ages, from birth to
old age. Four female rats and their newborn pups (n=19; 3 to 5 days old) were
purchased. Newborn rats were too small for independent dissection of the right and
left sides of the nasal epithelium. Therefore, RNA was extracted from one side only
for each pup. RNA was also extracted from the left and right olfactory epithelium of
four 22 month-old male rats kept in the animal house from the age of three weeks, and
from four nine-week-old male rats. RNA samples were labeled, hybridized and the
obtained data were analyzed as described above. The numbers of all transcripts and of
OR genes expressed by animals of the three age groups are given in Figure 5. The
distribution of expressed, weakly expressed and not expressed transcripts, when all
transcripts were taken into account, did not significantly differ between rats of
different ages (expressed / not expressed ratios = 2.04 to 2.45 for newborn, 2.55 for
adult (or 2.74, as indicated in Figure 2) and 2.28 for old rats). However, OR gene
expression profiles in newborn rats differed from the other two age groups, with
“expressed OR” / “not expressed OR” ratios of 0.85 to 1.34 for the four different
litters of pups, whereas it was 2.68 for adult (or 3.36 as indicated in Figure 2) and
2.59 for old rats (Mann-Whitney, p value = 0.057).
Comparison of the lists of gene transcripts and OR gene transcripts only showed that a
vast majority of them are common to all three age groups. However, there are some
notable differences between newborn and the two other groups: 332 OR genes were
expressed by adults and older animals but not by newborn rats and nine OR genes
were expressed by all newborn rats only (see Venn diagrams in additional file 2).
Considering each litter separately, between 15 and 23 OR genes (depending upon the
We performed RTqPCR for OR genes for which expression was detected only at birth
and for which we could design suitable pairs of primers (Figure 6). The results
obtained from the four adult rats, four old rats and the 19 newborns displayed large
standard deviations, in part due to individual variation but also due to the low level of
expression typical of OR genes. Nevertheless, some of these genes tended to be more
strongly expressed in pups than in adults or old rats. This effect was particularly
marked for Olr500, Olr156 and Olr448. We then selected nine of the 28 OR genes
identified as not expressed or very weakly expressed in pups (≤1 probe only - out of
19 - with hybridization levels above background) but as being expressed in adults and
older rats. RTqPCR data confirmed that they all had a much lower level of expression
in pups than in adults or older rats (additional file 4).
The 23,780 transcripts and 393 OR genes expressed by the three age groups were
subjected to hierarchical clustering (additional files 5 and 6 and figure 7). Well
defined clusters were obtained for the three age groups, with high bootstrap values.
Principal component analysis (PCA) analysis performed with the same data gave the
same result (not shown). This complete separation of the clusters corresponding to the
three age groups demonstrated clear differences in the expression levels of the genes
expressed by all animals between these groups. We also observed a tendency for pups
of the same litter to form clusters when all transcripts were taken into account.
However, this clustering effect was far from robust (low bootstrap values) when only
OR genes were considered.
We then carried out a statistical analysis of these data (t-test, p value < 0.01). This
showed that 2.0 % of the gene transcripts were differentially expressed, with at least a
five-fold difference in mRNA levels between newborns and the two other groups
expression between adult and old rats. Gene ontology (GO) classification analysis of
the genes that were up-regulated in newborn rats showed that most of these genes
were related to the “Cell Cycle” and “Neurogenesis”, whereas the genes up-regulated
in adults and old rats were related to the sensory perception of smell. Genes that were
less strongly expressed in old rats than in adult rats were classified into GO categories
associated with “Developmental processes”, “Organ division” and “Ossification” (see
also additional file 7 for a complete list of GO terms). Similarly, many OR genes
(Figure 8) were identified as less strongly expressed in newborns than in animals of
the two other groups, but eight OR genes were found to be overexpressed at birth.
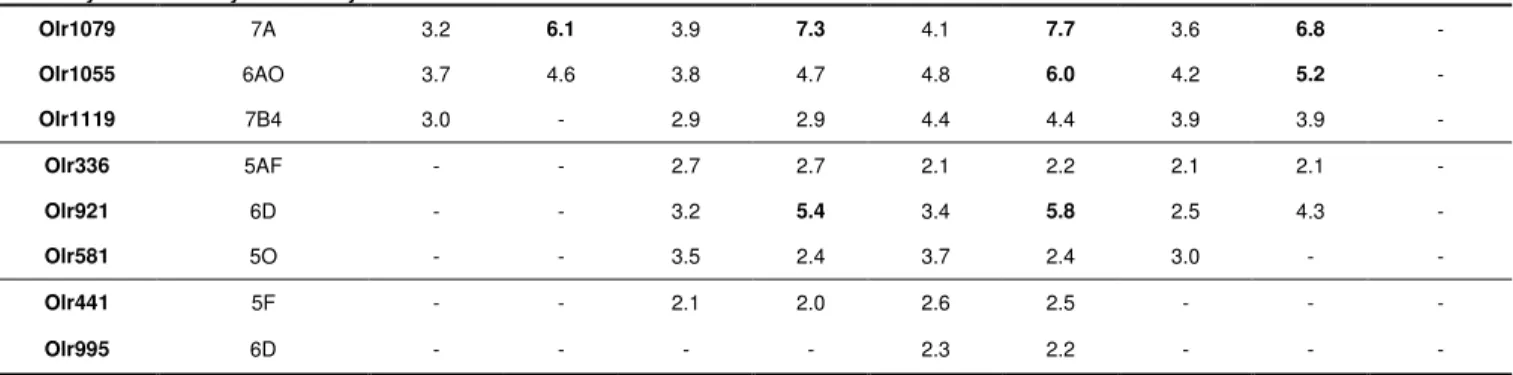
Olr1079 and Olr1055 were particularly strongly expressed in all newborns, with
transcript levels between 4.6 and 7.7 times higher than in old rats and between 3.2 and
4.8 times higher than in adult rats (Table 3). The expression levels of another OR
gene, Olr1119, were found to be higher in all newborns than in adults and, for three of
the four litters, than in old rats (Table 3). Three OR genes (Olr336, Olr921 and
Olr581) were overexpressed in pups from litters L2 to L4; one OR gene, Olr441, was
overexpressed in litters L2 and L3; and another OR gene, Olr995, was overexpressed
in litter L3 only.
Next, we performed RTqPCR for the set of the 77 OR genes described above, to
compare their expression levels at birth, adulthood and in old age in the olfactory
epithelium RNA samples prepared from nine newborn rats from three different litters,
three adult rats and three old rats. Box plots (Figure 9) showed that these 77 OR genes
have a range of expression levels much greater in newborns than in older animals, and
an expression level generally lower in newborns than in adult and old rats. This may
be due to the immaturity of the olfactory system in young animals, consistent with the
Of these 77 OR genes, 43 (56%) were underexpressed at birth (Figure 10C), 29 (38%)
were expressed at similar levels at all ages (Figure 10D) and five (Olr156, Olr382,
Olr1163, Olr1219 and Olr1234) were overexpressed at birth (Figure 10B). As these
five OR genes were not expressed in all three age groups, they were not included in
the t-test analysis. These genes should be added to the list of OR genes that are more
strongly expressed at birth.
These findings — the results of the statistical analysis (t-test; Table 3) identifying
eight OR genes more strongly expressed in newborn rats than in adults, the results of
RTqPCR, showing five genes overexpressed in newborn rats (Figure 10) and those
presented in Figure 6 (n=3) — suggest that a small set of OR genes are more strongly
expressed in newborn animals, with the vast majority expressed at a lower level in
these animals.
Conclusions
We report patterns of gene expression in the olfactory epithelium of adult Brown
Norway rats. We found that 2/3 of the probes (i.e. 26,701 probes spotted on the
arrays) gave a hybridization signal identifying genes expressed at a detectable level.
The corresponding genes included 732 OR genes (65% of the total OR repertoire).
We also showed by clustering analysis of the transcripts expressed in common that
the pattern of expression depended on the age of the animal rather than on individual
characteristics. The number of genes expressed in the olfactory epithelium, whatever
their coding function, was found not to differ significantly from those reported for
other tissues [39] or from the number of OR genes expressed in the mouse or human
olfactory epithelium [9, 10, 27]. However, the classification of a gene as expressed or
used. Different arrays made with different probes may give slightly different results,
as some genes not detected with one brand of microarrays may be detected by another
brand due to different hybridization conditions or probe characteristics. Furthermore
high-throughput sequencing, depending upon the sequencing depth, can be expected
to extend the list of expressed genes [40]. Extending the list of weakly expressed OR
genes is also likely to increase the ratio between the most and least strongly expressed
genes.
Extending the list of poorly expressed OR genes will raise many questions. What is
the minimum level at which an OR gene must be expressed to induce a signal
recognized and processed by the brain? Why are some OR genes strongly expressed,
whereas others are expressed only very weakly, if at all? Is this a consequence of the
environment or does the panel of expressed OR genes represent the minimum
required for the recognition of all relevant odorants, including those not yet
encountered? In this case, under what circumstances may the transcription of weakly
or not expressed OR genes be up-regulated? Answers to these questions might be
obtained by subjecting rats to different olfactory environments.
Little difference was found between the olfactory epithelium mRNA profiles of
individual Brown Norway adult rats of the same age, sex and origin, allowing a
reference transcriptome to be defined. However, the RNA profiles of newborn, adult
and old rats showed marked differences: both the lists of genes specifically expressed
at each age group and the levels of expression of genes expressed in all three age
groups differed between the three groups, allowing a clear clustering of the samples as
a function of age. Although 22-month old rats may not be considered very old, it
should be noted that the life expectancy of male Brown Norway rats is only around 31
part due to the loss of central brain function [42, 43]. However, the small but
measurable changes in the mRNA profiles of the olfactory epithelium observed in this
study between adults and old rats may also contribute to this deterioration. The
smaller number of OR genes expressed and their lower levels of expression at birth
would be consistent with an incomplete development of olfactory function at this age.
The Venn diagrams, t-tests and RTqPCR analyses reported here all indicate that a
small number of OR genes (n=16) were more strongly expressed or expressed
exclusively in newborn rats from different litters. This number is likely to be an
underestimation considering that five of the 77 OR genes taken at random were
overexpressed at birth. The types of ligand they recognize are not known, but given
that two- to five-day-old rats are blind and deaf, these OR genes may be important for
behavior, mother-pup relationship and/or nipple recognition. These findings are
consistent with the recent observation that newborn rats react to odorant exposure
[44].
Methods
Animals
Brown Norway rats were obtained from Charles River Laboratories (L'Arbresle,
France) or Elevage Janvier (Le Genest-Saint-Isle, France). Female rats with their
progeny (3 to 5 days old) were purchased from Charles River Laboratories. From their
arrival until the time at which they were killed, the rats were kept in the animal house
(12:12 h light/dark cycles with free access to food and water) under the rules
Olfactory epithelium dissection
Rats were anesthetized with an injection of 0.3 ml/100 g body weight ketamine
hydrochloride (Clorketam 1000 from Vetoquinol). They were then killed by
decapitation. Rat skulls were opened through a sagittal section and right and left
olfactory epithelia were quickly removed and placed separately in RA1 Buffer from
the Nucleospin RNA II kit (Macherey-Nagel, Düren, Germany).
RNA isolation
Total RNA was isolated with the Nucleospin RNA kit, according to the
manufacturer’s (Macherey-Nagel, Düren, Germany) instructions, which included an
in-column DNase treatment before RNA elution, to ensure the absence of genomic
DNA. Recovered RNA was quantified with a Nanodrop ND-1000 spectrophotometer
(NanoDrop Technologies, Cambridge, UK), and RNA integrity was assessed with the
RNA 6000 Nano LabChip kit, using the Agilent 2100 Bioanalyzer (Agilent
Technologies, Palo Alto CA, USA). Only RNA samples with an RNA Integrity
Number (RIN) greater than 8.8 were used for further analysis (RNA profiling analysis
and real time reverse transcription PCR analysis). Application of this strict quality
threshold resulted in the elimination of the left sample from one male adult rat from
Elevage Janvier.
Target preparation and microarray hybridization
RNA samples were labeled with the Agilent Low RNA Input Fluorescent Linear
Amplification kit (p/n 5184-3523), according to the manufacturer’s instructions.
Briefly, 350 ng of total RNA was used as template for reverse transcription to
spectrophotometer and was found to be between 1.2 and 1.9 pmol/ml.
Hybridization was performed with the Agilent Gene Expression Hybridization kit (p/n
5188-5242), used according to the manufacturer’s instructions. Briefly, 1650 ng of
labeled cRNA from each RNA sample was mixed with Hybridization Buffer and
Blocking Agent and subjected to fragmentation (by incubation for 30 min at 60°C in
the dark). Hybridizations onto 4x44K Whole Rat Genome 60-mer oligonucleotide
microarrays (G4131F) (Agilent Technologies, Palo Alto CA, USA) were performed in
a rotary oven (65°C, 17 h and 10 rpm) in the dark. Slides were disassembled and
washed in Gene Expression Wash Buffers I and II, according to the manufacturer’s
instructions, and dried with a nitrogen-filled air gun before scanning. Fifteen arrays
were used for the experiment analyzing the male/female and rat origin comparisons.
Thirty-five arrays were used for the “aging” comparison.
Data acquisition and processing
Microarrays were scanned with a dynamic autofocus microarray scanner (Agilent
DNA Microarray Scanner), using Agilent parameters. Feature Extraction software
version 9.5 was used to extract and analyze the signals. Array results were analyzed
with GeneSpring GX software version 7.3 (Agilent Technologies), via the Enhanced
Agilent Feature Extraction Import Preprocessor.
Data were normalized in two steps, using the algorithms supplied with the Feature
Extraction software. Data were first transformed to convert any negative value to
0.01; normalization was then performed by a per-chip 50th percentile method, which
normalized the data for each chip with respect to the median of the chip concerned,
allowing comparison between chips. A second normalization step was applied to the
median of all the values obtained for a given gene was calculated and used as the
normalization standard for that gene, such that, regardless of absolute differences in
the expression of the various genes, all were placed on the same scale for comparison.
The accuracy of microarray results was assessed by comparing the overall gene
expression levels for each chip by box plot analysis. Each box plot was centered on
zero, with comparable dynamic intensities, demonstrating the technical homogeneity
of the experiment overall (data not shown).
The microarray data have been uploaded into the Gene Expression Omnibus (GEO)
database (SuperSeries no. GSE15954 and samples nos. GSM400094–GSM400143).
Expressed transcripts
Low-intensity and unreliable results were removed using a "filter on flags" feature,
with standardized software algorithms classifying spots as "present," "marginal," or
"absent". Spots were considered "present" only if the output was uniform, not
saturated and significantly above background; spots that satisfied the main
requirements but were outliers relative to the typical values for the other genes were
considered "marginal". Filters were set to retain for further analysis only those values
classified as “present” or "marginal".
The terms "present" or "marginal" defining the nature of the hybridization signals on
each microarray should not be confused with the terms expressed transcripts, weakly
expressed transcripts and not expressed transcripts defined by comparing the results
obtained with the different samples, as explained in Figure 1.
Content of the 44K Agilent microarrays
the manufacturer provided chromosomal location information: rat GenBank accession
numbers were assigned for 36,383 of the probes; rat Ensembl transcript identifications
(IDs) were assigned for 168 other probes; and non-rat accession numbers for 2,757
probes for which no rat annotations were available. Together, these probes encompass
23,642 unique rat accession numbers and 2,270 unique non-rat accession numbers and
represent 16,947 rat Unigene IDs plus 5,941 non-rat Unigene IDs (Unigene build
166). In addition to these probes, there are a number of so-called technical probes
engineered by Agilent and used by GeneSpring to ascertain the quality of the data.
For additional details, please consult the Agilent website [46].
Due to uncertainties regarding the names of a number of genes that are probed by
many oligonucleotides on the arrays, the term “gene transcripts”, used throughout this
paper, designates transcripts and genes collectively identified by these probes, except
for OR genes that are annotated as such. Although some gene transcripts were probed
by more than one oligonucleotide, each OR gene was probed by a single
oligonucleotide.
Selection of differentially expressed genes
We performed t-test analysis with GeneSpring software (Benjamini & Hochberg
correction for false discovery rate (p value of 0.01)) to select genes that were
differentially expressed between groups.
Hierarchical clustering
Hierarchical support trees including bootstrap analysis with replacement after 1000
iterations were constructed with TIGR Mev v 4.2 software [47]. Numbers at the nodes
(range = 1 to 100) indicate the support for the clustering. The clustering pattern was
Functional annotation
Analysis of the enrichment of expressed genes with Gene Ontology (GO) categories
(i.e. GO terms with a significantly larger number of associated genes than expected
for a random distribution) was performed with NIH DAVID [48, 49]. Briefly, the
GenBank accession numbers of the genes of interest were uploaded to the DAVID
website and analysis was carried out with the Rattus norvegicus gene repertoire as a
reference list. GO categories with significantly larger numbers of expressed genes
than expected (p value corrected < 0.05) were selected.
Real time reverse transcription PCR analysis (RTqPCR)
RTqPCR was performed for a number of genes, with forward (F) and reverse (R)
primers designed with Primer3 software [50] (additional file 8). Primer specificity
was assessed from the monophase dissociation curves. Only pairs presenting similar
efficiencies (100 ± 5%) were retained (data not shown). Briefly, the High-Capacity
cDNA Archive kit (Applied Biosystems, Foster City, CA, USA) was used for reverse
transcription and the Power SYBR Green PCR master kit (Applied Biosystems) was
used for quantitative PCR, according to Applied Biosystems gene amplification
specifications (40 cycles of 15 s at 95°C and 1 min at 60°C). Gene expression was
analyzed with the ABI Prism 7900HT sequence detection system, and results were
handled with the associated SDS version 2.3 software (Applied Biosystems).
Hprt (hypoxanthine-guanine phosphoribosyltransferase) mRNA levels did not vary
significantly between groups or experiments. This gene was therefore used as an
internal reference for the comparison of rats of different origins and ages. The relative
sample” corresponding to RNA prepared from one adult rat epithelium.
List of abbreviations used
Cy: cyanine ; DNA: deoxyribonucleic acid ; GEO: Gene Expression Omnibus ; GO:
Gene Ontology ; OR: olfactory receptor ; OSN: olfactory sensory neuron ; PCA:
principal component analysis ; PCR: polymerase chain reaction ; RIN: RNA integrity
number ; RNA: ribonucleic acid ; RT: reverse transcription ; SD: standard deviation
Authors’ contributions
MR carried out molecular genetic experiments, interpreted the data and drafted the
manuscript. SR carried out molecular genetic experiments. AV participated in the
statistical treatment of the data. FG conceived, designed, coordinated the study and
helped write the manuscript. All authors read and approved the final manuscript.
Acknowledgements
The Centre National de la Recherche Scientifique, the Université de Rennes 1, the
Conseil Régional de Bretagne and the Technical Support Working Group (TSWG)
are thanked for their generous support and encouragement to FG. The authors are
References
1. Buck L, Axel R: A novel multigene family may encode odorant receptors:
a molecular basis for odor recognition. Cell 1991, 65(1):175-187.
2. Olender T, Lancet D, Nebert DW: Update on the olfactory receptor (OR)
gene superfamily. Hum Genomics 2008, 3(1):87-97.
3. Niimura Y, Nei M: Extensive gains and losses of olfactory receptor genes
in Mammalian evolution. PLoS One 2007, 2(1):e708.
4. Quignon P, Giraud M, Rimbault M, Lavigne P, Tacher S, Morin E, Retout E,
Valin AS, Lindblad-Toh K, Nicolas J et al: The dog and rat olfactory
receptor repertoires. Genome Biol 2005, 6(10):R83.
5. Malnic B, Godfrey PA, Buck LB: The human olfactory receptor gene
family. Proc Natl Acad Sci U S A 2004, 101(8):2584-2589.
6. Godfrey PA, Malnic B, Buck LB: The mouse olfactory receptor gene
family. Proc Natl Acad Sci U S A 2004, 101(7):2156-2161.
7. Robin S, Tacher S, Rimbault M, Vaysse A, Dreano S, Andre C, Hitte C,
Galibert F: Genetic diversity of canine olfactory receptors. BMC Genomics
2009, 10:21.
8. Menashe I, Man O, Lancet D, Gilad Y: Different noses for different people.
Nat Genet2003, 34(2):143-144.
9. Young JM, Shykind BM, Lane RP, Tonnes-Priddy L, Ross JA, Walker M,
Williams EM, Trask BJ: Odorant receptor expressed sequence tags
demonstrate olfactory expression of over 400 genes, extensive alternate splicing and unequal expression levels. Genome Biol 2003, 4(11):R71.
10. Zhang X, De la Cruz O, Pinto JM, Nicolae D, Firestein S, Gilad Y:
Characterizing the expression of the human olfactory receptor gene family using a novel DNA microarray. Genome Biol 2007, 8(5):R86.
11. Feldmesser E, Olender T, Khen M, Yanai I, Ophir R, Lancet D: Widespread
ectopic expression of olfactory receptor genes. BMC Genomics 2006, 7:121.
12. Pluznick JL, Zou DJ, Zhang X, Yan Q, Rodriguez-Gil DJ, Eisner C, Wells E,
Greer CA, Wang T, Firestein S et al: Functional expression of the olfactory
signaling system in the kidney. Proc Natl Acad Sci U S A 2009,
106(6):2059-2064.
13. Firestein S: How the olfactory system makes sense of scents. Nature 2001,
413(6852):211-218.
14. Chess A, Simon I, Cedar H, Axel R: Allelic inactivation regulates olfactory
receptor gene expression. Cell 1994, 78(5):823-834.
15. Malnic B, Hirono J, Sato T, Buck LB: Combinatorial receptor codes for
odors. Cell 1999, 96(5):713-723.
16. Ishii T, Serizawa S, Kohda A, Nakatani H, Shiroishi T, Okumura K, Iwakura
Y, Nagawa F, Tsuboi A, Sakano H: Monoallelic expression of the odourant
receptor gene and axonal projection of olfactory sensory neurones. Genes
Cells2001, 6(1):71-78.
17. Serizawa S, Ishii T, Nakatani H, Tsuboi A, Nagawa F, Asano M, Sudo K,
Sakagami J, Sakano H, Ijiri T et al: Mutually exclusive expression of
odorant receptor transgenes. Nat Neurosci 2000, 3(7):687-693.
18. Serizawa S, Miyamichi K, Nakatani H, Suzuki M, Saito M, Yoshihara Y,
Sakano H: Negative feedback regulation ensures the one receptor-one
19. Ressler KJ, Sullivan SL, Buck LB: A zonal organization of odorant
receptor gene expression in the olfactory epithelium. Cell 1993,
73(3):597-609.
20. Vassar R, Ngai J, Axel R: Spatial segregation of odorant receptor
expression in the mammalian olfactory epithelium. Cell 1993,
74(2):309-318.
21. Mombaerts P, Wang F, Dulac C, Chao SK, Nemes A, Mendelsohn M,
Edmondson J, Axel R: Visualizing an olfactory sensory map. Cell 1996,
87(4):675-686.
22. Barnea G, O'Donnell S, Mancia F, Sun X, Nemes A, Mendelsohn M, Axel R:
Odorant receptors on axon termini in the brain. Science 2004, 304(5676):1468.
23. Strotmann J, Levai O, Fleischer J, Schwarzenbacher K, Breer H: Olfactory
receptor proteins in axonal processes of chemosensory neurons. J Neurosci
2004, 24(35):7754-7761.
24. Wang F, Nemes A, Mendelsohn M, Axel R: Odorant receptors govern the
formation of a precise topographic map. Cell 1998, 93(1):47-60.
25. Feinstein P, Mombaerts P: A contextual model for axonal sorting into
glomeruli in the mouse olfactory system. Cell 2004, 117(6):817-831.
26. Mombaerts P: Axonal wiring in the mouse olfactory system. Annu Rev Cell
Dev Biol2006, 22:713-737.
27. Zhang X, Rogers M, Tian H, Zou DJ, Liu J, Ma M, Shepherd GM, Firestein
SJ: High-throughput microarray detection of olfactory receptor gene
expression in the mouse. Proc Natl Acad Sci U S A 2004,
28. Gibbs RA, Weinstock GM, Metzker ML, Muzny DM, Sodergren EJ, Scherer
S, Scott G, Steffen D, Worley KC, Burch PE et al: Genome sequence of the
Brown Norway rat yields insights into mammalian evolution. Nature 2004, 428(6982):493-521.
29. Possidente B, Lumia AR, McGinnis MY, Teicher MH, deLemos E, Sterner L,
Deros L: Olfactory bulb control of circadian activity rhythm in mice.
Brain Res1990, 513(2):325-328.
30. Takumi T, Taguchi K, Miyake S, Sakakida Y, Takashima N, Matsubara C,
Maebayashi Y, Okumura K, Takekida S, Yamamoto S et al: A
light-independent oscillatory gene mPer3 in mouse SCN and OVLT. EMBO J
1998, 17(16):4753-4759.
31. Zylka MJ, Shearman LP, Weaver DR, Reppert SM: Three period homologs
in mammals: differential light responses in the suprachiasmatic circadian clock and oscillating transcripts outside of brain. Neuron 1998,
20(6):1103-1110.
32. Yamaguchi S, Mitsui S, Yan L, Yagita K, Miyake S, Okamura H: Role of
DBP in the circadian oscillatory mechanism. Mol Cell Biol 2000, 20(13):4773-4781.
33. Xu J, Burgoyne PS, Arnold AP: Sex differences in sex chromosome gene
expression in mouse brain. Hum Mol Genet 2002, 11(12):1409-1419.
34. Xu J, Watkins R, Arnold AP: Sexually dimorphic expression of the
X-linked gene Eif2s3x mRNA but not protein in mouse brain. Gene Expr
35. Xu J, Deng X, Watkins R, Disteche CM: Sex-specific differences in
expression of histone demethylases Utx and Uty in mouse brain and neurons. J Neurosci 2008, 28(17):4521-4527.
36. Roberts ES, Soucy NV, Bonner AM, Page TJ, Thomas RS, Dorman DC:
Basal gene expression in male and female Sprague-Dawley rat nasal respiratory and olfactory epithelium. Inhal Toxicol 2007, 19(11):941-949.
37. Jones DT, Reed RR: Golf: an olfactory neuron specific-G protein involved
in odorant signal transduction. Science 1989, 244(4906):790-795.
38. Scott JW, Brierley T, Schmidt FH: Chemical determinants of the rat
electro-olfactogram. J Neurosci 2000, 20(12):4721-4731.
39. Su AI, Wiltshire T, Batalov S, Lapp H, Ching KA, Block D, Zhang J, Soden
R, Hayakawa M, Kreiman G et al: A gene atlas of the mouse and human
protein-encoding transcriptomes. Proc Natl Acad Sci U S A 2004, 101(16):6062-6067.
40. Cloonan N, Forrest AR, Kolle G, Gardiner BB, Faulkner GJ, Brown MK,
Taylor DF, Steptoe AL, Wani S, Bethel G et al: Stem cell transcriptome
profiling via massive-scale mRNA sequencing. Nat Methods 2008, 5(7):613-619.
41. Brown Norway rats informations [
http://transgenose.cnrs-orleans.fr/taam/souches.php?s=70&sp=rats]
42. Boyce JM, Shone GR: Effects of ageing on smell and taste. Postgrad Med J
2006, 82(966):239-241.
43. Rawson NE: Olfactory loss in aging. Sci Aging Knowledge Environ 2006,
44. Miller SS, Spear NE: Olfactory learning in the rat neonate soon after birth.
Dev Psychobiol2008, 50(6):554-565.
45. Wauthier V, Waxman DJ: Sex-specific early growth hormone response
genes in rat liver. Mol Endocrinol 2008, 22(8):1962-1974.
46. Agilent Technologies website [http://www.chem.agilent.com]
47. TIGR Mev 4.2 [http://www.tm4.org/mev.html]
48. Dennis G, Jr., Sherman BT, Hosack DA, Yang J, Gao W, Lane HC, Lempicki
RA: DAVID: Database for Annotation, Visualization, and Integrated
Discovery. Genome Biol 2003, 4(5):P3.
49. Huang da W, Sherman BT, Lempicki RA: Systematic and integrative
analysis of large gene lists using DAVID bioinformatics resources. Nat
Protoc2009, 4(1):44-57.
50. Primer 3 [http://frodo.wi.mit.edu/]
51. Livak KJ, Schmittgen TD: Analysis of relative gene expression data using
real-time quantitative PCR and the 2(-Delta Delta C(T)) Method. Methods
2001, 25(4):402-408.
Figure legends
Figure 1 - Number of features above background
RNA from 15 olfactory epithelia (eight rats were killed, but one olfactory RNA
sample did not pass the quality control test (the RIN test) and was not further
processed) were hybridized in parallel. The y-axis represents the number of transcripts
background levels, as defined by GeneSpring. Transcripts for which 11 or more of the
15 samples (73%) gave raw values above background levels were scored as
“expressed”. Transcripts positive in 1 to 10 samples were scored as “weakly
expressed”. All other transcripts were scored as “not expressed”.
Figure 2 - Expression of gene transcripts and OR transcripts
Grouping of total gene transcripts and OR transcripts into three categories: expressed,
weakly expressed and not expressed. For 39,308 of the 41,012 unique probes on the
array, an accession number is given in GenBank and Ensembl [45]. They correspond
to 23,642 unique transcripts or genes, including 1136 OR genes. The ratios of
expressed transcripts over not expressed transcripts and of expressed OR genes over
not expressed OR genes are 2.75 and 3.36, respectively.
Figure 3 - Delta Ct values for 77 OR genes
Results of RTqPCR (means of technical triplicate for each gene), are expressed as
delta Ct values (Cycle threshold), using Hprt mRNA as a reference (Ct OR-Ct Hprt).
The analyses were performed on three samples and the size of the vertical bars
corresponds to the standard deviation. The curve links the mean Ct values obtained
with these three samples. The name of the OR genes are indicated on the x axis: in
green are genes identified as expressed, in yellow the OR genes identified as weakly
expressed and in red are the OR genes identified as not expressed by microarray
hybridization. As indicated by the size of the vertical bars defining the cycle threshold
(Ct) values for any given analyzed RNA, the amount of mRNA differs by 0.08 to 2.2
Figure 4 - Differential expression of OR genes in the endoturbinates
We prepared mRNA from the four endoturbinates dissected from an adult rat. mRNA
samples were used for RTqPCR (technical triplicates for each gene) for the same set
of 77 OR genes. ∆∆Ct values were expressed with respect to Hprt mRNA as internal
reference and the control sample as external control as specified in [51].
Endoturbinate II’, III and IV OR Ct values were normalized with respect to
endoturbinate II OR Ct values, taken as a reference. The standard deviations are
calculated from the triplicate values. Panel A is a control showing that Gapdh and
Golf are expressed at similar levels in the four different endoturbinates. Panel B
shows the Ct values for the OR genes that are more strongly expressed in
endoturbinate II. Panel C shows OR genes with similar levels of expression in
endoturbinates II and II’. In panel D, are shown OR genes more strongly expressed in
endoturbinate II’; panel E presents OR genes more strongly expressed in
endoturbinate III and, finally, panel F shows OR genes more strongly expressed in
endoturbinate IV. On the x axis, OR gene family names follow gene names.
Figure 5 - Expression of gene transcripts and OR transcripts at various ages
Grouping of gene transcripts and OR transcripts into three categories: expressed,
weakly expressed and non expressed. In experiments describing adult olfactory
epithelium mRNA profiles (Figure 1), total transcripts and OR genes were identified
as being expressed when ~75 % of the samples gave a corresponding hybridization
signal above background levels. Similarly in the experiments described in this figure,
we selected as threshold 3 in the case of each litter, 6 for the adults and 6 for the old
rats. “Not expressed” total transcripts and “not expressed” OR genes did not show
Figure 6 - Expression levels of OR genes expressed at birth but not in older rats
(A) RNA samples prepared from olfactory epithelia (4 adults, 4 old rats and 19
newborns from each litter L1 to L4) were used for RTqPCR of 7 OR genes identified
by microarray analysis as expressed in newborns only. Each mRNA was analyzed in
triplicate and a mean value calculated. ∆Ct values were calculated with respect to the
Hprt values and ∆∆Ct with respect to a control sample equated to 1. Further, the
analyses were performed on four samples of the same group of age; error bars
represent means ± SD (n=4 rat RNA samples per group).
(B) The table shows the number of samples giving a hybridization signal above
background. For Olr500, taken as an example, none of the 8 adult and 8 old rat
samples gave a hybridization signal above background. Conversely, all samples from
the 15 newborn rats from litters L2 to L4 and three newborn rats of the four of litter
L1 gave a hybridization signal above background.
Figure 7 - Hierarchical clustering of samples for OR genes expressed in olfactory epithelium in the three age groups of rats
Numbers at the nodes (range=1 to 100) indicate support (bootstrap value) for the
clustering. Note the high bootstrap values at each node corresponding to the age
groups but their much lower values for the downstream branches.
Figure 8 - Up- and down-regulated transcripts and OR genes
Numbers of up- and down-regulated transcripts and OR genes (fold change ≥ 5)
identified by pair-wise comparisons between age groups.
The RTqPCR results detailed in Figure 10 are presented as box plots. Note the lower
positions of the medians for the newborn samples and the greater dispersion of DDCt
values. A Mann-Whitney test performed with the 77 values calculated for the
different samples confirmed that the data obtained for newborns differed from those
obtained for the old and adult groups (p values < 10-10).
Figure 10 - Relative expression of a subset of 77 OR genes at three different ages
RTqPCR was performed for 77 OR mRNAs, with olfactory epithelium mRNA
prepared from 3 adult rats, 3 old rats and 9 newborn rats from three litters (L1, L2 and
L4) used as a template (i.e. 15 samples, each analyzed in triplicate). Results are
expressed as ∆∆Ct values with Hprt taken as a reference (x axis). Gene names are
distributed into four sectors, from top to bottom: (A) G
α
olf, which is clearly lessstrongly expressed at birth and Gapdh, which is expressed at similar levels in all age
groups, (B) 5 OR genes more strongly expressed at birth than later in life, (C) 43 OR
genes far less strongly expressed at birth than at other ages and (D) 29 genes
expressed to a similar extent at birth and at other ages or only slightly less strongly
expressed at birth.
Tables
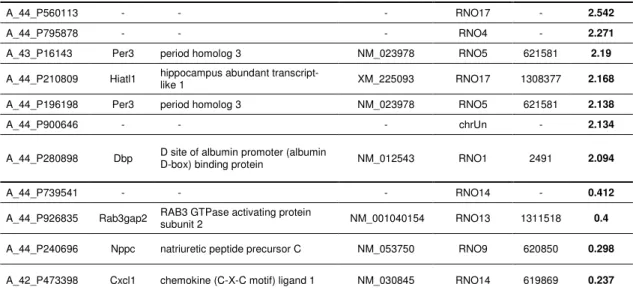
Table 1 - Genes differentially expressed in the olfactory epithelia of rats from different suppliers
Agilent Probe Gene
Symbol Gene Name Genbank ID Chromosome RGD ID
Fold difference
Charles River /
Janvier
A_44_P560113 - - - RNO17 - 2.542
A_44_P795878 - - - RNO4 - 2.271
A_43_P16143 Per3 period homolog 3 NM_023978 RNO5 621581 2.19
A_44_P210809 Hiatl1 hippocampus abundant
transcript-like 1 XM_225093 RNO17 1308377 2.168 A_44_P196198 Per3 period homolog 3 NM_023978 RNO5 621581 2.138
A_44_P900646 - - - chrUn - 2.134
A_44_P280898 Dbp D site of albumin promoter (albumin
D-box) binding protein NM_012543 RNO1 2491 2.094
A_44_P739541 - - - RNO14 - 0.412
A_44_P926835 Rab3gap2 RAB3 GTPase activating protein
subunit 2 NM_001040154 RNO13 1311518 0.4 A_44_P240696 Nppc natriuretic peptide precursor C NM_053750 RNO9 620850 0.298
A_42_P473398 Cxcl1 chemokine (C-X-C motif) ligand 1 NM_030845 RNO14 619869 0.237
Genes differentially expressed in the olfactory epithelia of rats obtained from two
different suppliers and ranked by fold difference. Note that Per3 was identified twice
and that four probes correspond to non-annotated genes.
Table 2 - Genes differentially expressed in the olfactory epithelia of male and female rats
Agilent Probe Gene
Symbol Gene Name Genbank ID Chromosome RGD ID
Fold difference
Female / Male
A_44_P1071281 - - AI072660 RNOX - 2.846
A_44_P384683 Utx ubiquitously transcribed
tetratricopeptide repeat, X chromosome XM_228424 RNOX 1565481 2.082
A_44_P379924 Ccdc39 coiled-coil domain containing 39 NM_001107667 RNO2 1306277 1.869
A_43_P16682 Eif2s3x eukaryotic translation initiation factor 2,
subunit 3, structural gene X-linked XM_216704 RNOX 1561279 1.838
A_44_P500598 Eif2s3x eukaryotic translation initiation factor 2,
subunit 3, structural gene X-linked XM_216704 RNOX 1561279 1.721
Genes differentially expressed in olfactory epithelia between male and female rats
Note that Eif2s3x was identified twice and one probe corresponds to a non-annotated
Table 3 - OR genes upregulated in newborns
Gene Symbol Family / Subfamily L1 vs Adult L1 vs Old L2 vs Adult L2 vs Old L3 vs Adult L3 vs Old L4 vs Adult L4 vs Old Adult vs Old Olr1079 7A 3.2 6.1 3.9 7.3 4.1 7.7 3.6 6.8 -Olr1055 6AO 3.7 4.6 3.8 4.7 4.8 6.0 4.2 5.2 -Olr1119 7B4 3.0 - 2.9 2.9 4.4 4.4 3.9 3.9 -Olr336 5AF - - 2.7 2.7 2.1 2.2 2.1 2.1 -Olr921 6D - - 3.2 5.4 3.4 5.8 2.5 4.3 -Olr581 5O - - 3.5 2.4 3.7 2.4 3.0 - -Olr441 5F - - 2.1 2.0 2.6 2.5 - - -Olr995 6D - - - - 2.3 2.2 - -
-List of OR genes found to be up-regulated in newborn rats by t-test analysis (p
value < 0.01). Fold differences are expressed with respect to adults and old rats.
Figures in bold pointed to fold differences > 5 and “-“ mean that the t-test analysis
gave no significant p value.
Additional files
Additional file 1
Title: List of the 1136 OR genes that are probed in the 44K Agilent microarray. Description: This XLS document contains a list of the 1136 OR genes that are probed in the 44K Agilent microarray.
Additional file 2
Title: Venn diagrams of transcripts and OR genes expressed in rats of the different groups of age.
Description: This PDF document displays Venn diagrams of transcripts and OR genes expressed in rats of the different groups of age.
Additional file 3
Description: (A) Numbers of expressed OR genes, deduced by microarray
hybridization of the RNA samples prepared from newborns of four different litters
compared to the OR genes expressed by adults and old rats. (B) Names of OR genes
expressed in all newborn rats but not in adults and old rats. Comparisons of the OR
genes expressed in each litter with the other two age groups showed that 15 to 23 OR
genes per litter were expressed exclusively in newborn rats. Interestingly, 9 of these
OR genes were identified in newborn rats from all litters, four OR genes in litters L2,
L3 and L4 and two OR genes in litters L1, L3 and L4. This suggests that newborn
animals express a characteristic set of OR genes that is not expressed in older rats.
Additional file 4
Title: mRNA levels of nine OR genes identified by microarray as expressed in adult and old animals but not in newborns
Description: Diagram showing RTqPCR results for nine OR genes randomly selected
from the 28 OR genes not expressed at birth but expressed in adult and old animals;
Suclg1, which was found on microarray analysis to be expressed to a similar extent in
all the age groups tested, was used as a control in this experiment. Each mRNA was
analyzed in triplicate and a mean value calculated. ∆Ct values were calculated with
respect to the Hprt values and ∆∆Ct with respect to a control sample equated to 1.
Further, the analyses were performed on four samples of the same group of age; error
bars represent means ± SD (n=4 rat RNA samples per group).
Title: Hierarchical clustering of samples using all transcripts for which mRNA was detected in all three groups of age
Description: Numbers at the nodes (range=1 to 100) indicate support (bootstrap
value) for the clustering.
Additional file 6
Title: Comparison of expression level between and within age groups
Description: These two figures illustrate the close level of mRNA expression
observed between samples prepared from animals of the same group of ages. Figure
A: the microarray expression levels of three OR mRNA taken at random are
compared between the 19 pup samples from 4 litters, 8 samples from 4 adults and 8
samples from 4 old rats. Figure B is a color code hierarchical clustering representation
of the profiles of the 393 OR mRNA expressed in common (see additional file 2)
within the 35 samples prepared from newborn, adult and old rats.
Additional file 7
Title: GO terms characterizing the transcripts and OR genes up- or downregulated in the three different age groups.
Description: Differentially expressed genes : Newborn / Old rats (up-expressed in newborn rats / foldchange >=5 )
Additional file 8
Title: Oligonucleotides used for RTqPCR
732
186
218
26701
4590
9721
0%
20%
40%
60%
80%
100%
All gene
transcripts
(n = 41012)Olfactory
receptors
genes
(n = 1136)(65%)
(65%)
(24%)
(19%)
(11%)
(16%)
Additional files provided with this submission:
Additional file 1: Additional_file_1.xls, 318K
http://www.biomedcentral.com/imedia/1920428113319518/supp1.xls
Additional file 2: Additional_file_2.pdf, 151K
http://www.biomedcentral.com/imedia/1155688685319518/supp2.pdf
Additional file 3: Additional_file_3.pdf, 60K
http://www.biomedcentral.com/imedia/9455868553195187/supp3.pdf
Additional file 4: Additional_file_4.pdf, 589K
http://www.biomedcentral.com/imedia/3829153893195188/supp4.pdf
Additional file 5: Additional_file_5.pdf, 51K
http://www.biomedcentral.com/imedia/1353665640319518/supp5.pdf
Additional file 6: Additional_file_6.pdf, 197K
http://www.biomedcentral.com/imedia/8819245483195188/supp6.pdf
Additional file 7: Additional_file_7.xls, 49K
http://www.biomedcentral.com/imedia/3993114473195191/supp7.xls
Additional file 8: Additional_file_8.xls, 35K