HAL Id: hal-01489663
https://hal.archives-ouvertes.fr/hal-01489663
Preprint submitted on 19 Apr 2018HAL is a multi-disciplinary open access
archive for the deposit and dissemination of sci-entific research documents, whether they are pub-lished or not. The documents may come from teaching and research institutions in France or abroad, or from public or private research centers.
L’archive ouverte pluridisciplinaire HAL, est destinée au dépôt et à la diffusion de documents scientifiques de niveau recherche, publiés ou non, émanant des établissements d’enseignement et de recherche français ou étrangers, des laboratoires publics ou privés.
Is intensity a relevant criterion in the perception of
spontaneous speech? The case of emphasis in English.
Sophie Herment
To cite this version:
Sophie Herment. Is intensity a relevant criterion in the perception of spontaneous speech? The case of emphasis in English.. 2012. �hal-01489663�
Is intensity a relevant criterion in the perception of spontaneous speech?
The case of emphasis in English
Sophie Herment
Laboratoire Parole et Langage, Aix-Marseille Université sophie.herment@univ-amu.fr
Abstract
Analysing intensity in spontaneous speech is most delicate. However, for reasons that will be given in detail, this paper shows that the measurements seem relevant and that it is therefore possible to consider intensity as a key factor in acoustic studies on oral spontaneous speech. Minute analyses are thus carried out on a corpus of English spontaneous speech and described here, and the statistical analyses on the whole corpus show that fundamental frequency is not the most important acoustic correlate of emphasis, as is widely agreed in the literature, but that the combination of intensity and duration is the most relevant cue for emphasis. This parameter is called total amplitude, i.e. the energy spent to utter a segment of speech. The statistical analysis carried out for each speaker and for the different speech styles also points out that different parameters are important in the perception of emphasis in spontaneous speech and for some speakers, intensity is the most relevant criterion, whether it be very high, or very low.
Index Terms: intensity, emphasis, prominence, energy, rhythmic units, total amplitude. 1. Introduction
Most linguists attest that intensity is a relevant criterion in the perception of prominence (Fry, 1955, 1958; Brown & McGlone, 1974; Beckman & Edwards, 1994; Sluitjer & van Heuven, 1993, 1996; Campbell, 1995; Campbell & Beckman, 1995). However, the studies showing the importance of intensity are based on laboratory speech and experiments in which the recordings are performed in optimal conditions (like those of Campbell & Beckman, 1995 or Sluitjer & van Heuven, 1996). Indeed, as soon as intensity is concerned, a crucial problem arises: how to interpret data on global intensity when it is known that measuring intensity is very delicate: “[…] intensity variation will never have communicative significance for the simple reason that intensity is too susceptible to noise. If the speaker accidentally turns his head or passes a hand before his mouth, intensity drops of greater magnitude than those caused by the difference between stressed and unstressed syllables will easily occur. For this reason, manipulating intensity in stress perception experiments seems ill-advised.” (Sluitjer & van Heuven, 1996: 2372). In the same way, the data will be different according to the microphones used, to the distance between the speaker and the microphone. Analysing intensity in spontaneous speech thus seems a tricky subject, but at the same time, it seems difficult not to take it into account when studying prominence or emphasis. We therefore decided to take the risk and analysed intensity in a corpus of spontaneous speech in order to determine its importance in the perception of emphatic words or passages.
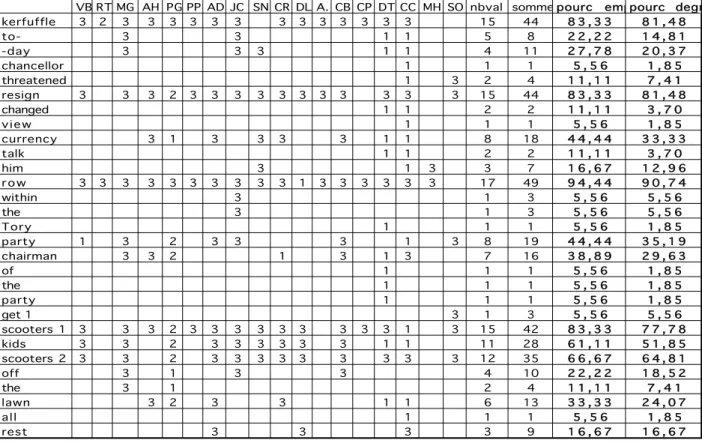
2. Corpus and method 2.1. Corpus and degree of emphasis
The study presented here is based on a corpus of spontaneous British English (Herment-Dujardin, 2001) containing three different speech styles: a political TV debate (3 males and 1 female), an
informal conversation (4 speakers: 2 males and 2 females, cf. Herment, 2010) and a radio broadcast (2 females). Passages were selected (the primary corpus thus consisting of ten speakers and about 20 minutes of speech) and a perceptual experiment was conducted: naïve native English speakers were asked to mark the passages that they perceived as being emphatic. A voluntarily vague definition of emphasis was given: what is emphatic is what is “being made prominent in some way” and which is “not neutral”, “with a special involvement on the part of the speaker”. The results of this experiment made it possible to determine a degree of emphasis for each word, based on the percentage of listeners marking each word as emphatic: the words marked by all the listeners have a 100% degree of emphasis, those marked by half of the listeners obtain 50%, and so on. Table 1 below shows the results for sound files 1, 2 and 3: the words marked as emphatic by the listeners are listed in the table. The last but one column gives the raw degree of emphasis, and the last column also gives a degree of emphasis but which is calculated according to the degree the listeners gave. Indeed they could give three degrees of emphasis to the words or passages (3 being the highest degree).
VB 1/3 sauf 2ème passageRT1/2/3MG 3 AH 3PG1/2/3PP 3AD 1/3JC 1/3SN 1/3CR 1/3DL 1/3A. 3CB 3CP 3DT1/3CC 1/3MH 1/3SO 3nbval somme pourc emphpourc degré
kerfuffle 3 2 3 3 3 3 3 3 3 3 3 3 3 3 3 15 44 8 3 , 3 3 8 1 , 4 8 to- 3 3 1 1 5 8 2 2 , 2 2 1 4 , 8 1 -day 3 3 3 1 1 4 11 2 7 , 7 8 2 0 , 3 7 chancellor 1 1 1 5 , 5 6 1 , 8 5 threatened 1 3 2 4 1 1 , 1 1 7 , 4 1 resign 3 3 3 2 3 3 3 3 3 3 3 3 3 3 3 15 44 8 3 , 3 3 8 1 , 4 8 changed 1 1 2 2 1 1 , 1 1 3 , 7 0 view 1 1 1 5 , 5 6 1 , 8 5 currency 3 1 3 3 3 3 1 1 8 18 4 4 , 4 4 3 3 , 3 3 talk 1 1 2 2 1 1 , 1 1 3 , 7 0 him 3 1 3 3 7 1 6 , 6 7 1 2 , 9 6 r o w 3 3 3 3 3 3 3 3 3 3 1 3 3 3 3 3 3 17 49 9 4 , 4 4 9 0 , 7 4 within 3 1 3 5 , 5 6 5 , 5 6 the 3 1 3 5 , 5 6 5 , 5 6 Tory 1 1 1 5 , 5 6 1 , 8 5 party 1 3 2 3 3 3 1 3 8 19 4 4 , 4 4 3 5 , 1 9 chairman 3 3 2 1 3 1 3 7 16 3 8 , 8 9 2 9 , 6 3 of 1 1 1 5 , 5 6 1 , 8 5 the 1 1 1 5 , 5 6 1 , 8 5 party 1 1 1 5 , 5 6 1 , 8 5 get 1 3 1 3 5 , 5 6 5 , 5 6 scooters 1 3 3 3 2 3 3 3 3 3 3 3 3 3 1 3 15 42 8 3 , 3 3 7 7 , 7 8 kids 3 3 2 3 3 3 3 3 3 1 1 11 28 6 1 , 1 1 5 1 , 8 5 scooters 2 3 3 2 3 3 3 3 3 3 3 3 3 12 35 6 6 , 6 7 6 4 , 8 1 off 3 1 3 3 4 10 2 2 , 2 2 1 8 , 5 2 the 3 1 2 4 1 1 , 1 1 7 , 4 1 lawn 3 2 3 3 1 1 6 13 3 3 , 3 3 2 4 , 0 7 all 1 1 1 5 , 5 6 1 , 8 5 rest 3 3 3 3 9 1 6 , 6 7 1 6 , 6 7
Table 1: degree of emphasis for sound files 1, 2 and 3.
Sound file 1: This is a kerfuffle today about whether the chancellor has threatened to resign (speaker DD)
Sound file 2: If John major changed his view on a single currency and a lot of talk on him having a
row within the Tory party and telling them to (DD)
Sound file 3: telling the um Chairman of the Party to to get his g get the scooters his kids’ scooters
off the lawn and all the rest of it (DD)
2.2. Pre-analyses
In order to avoid the problems mentioned in the introduction, pre-analyses were first carried out to ensure that the intensity data were not biased.
The software PRAAT (Boersma & Weenink, 2001) was used for all the measures. The maximum intensity and the minimum intensity values of several segments were taken. The mean intensity of highly emphatic and non emphatic words was also measured. Finally, the intensity of unstressed (V), stressed (‘V) and reduced vowels (Red V) was measured in order to have a reasonable overview. Four speakers were selected (for a total of 52 very short segments). Table 2 shows the results for each speaker: the two values given in each box and separated by a slash are the min and max values obtained for each category.
Table 2: intensity values in deciBel (dB) per speaker.
The values for reduced vowels did not prove relevant but this is due to the fact that reduced vowels are often very short and hence difficult to measure. The other values seem coherent and non biased at all. Interesting conclusions can already be drawn if we take a close look at all the values we obtained.
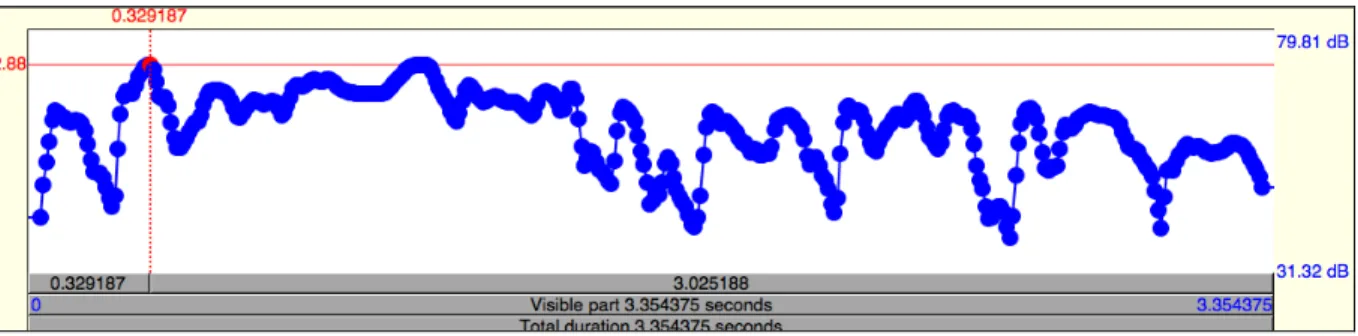
Intensity declines along the sentence for speaker VB, as figure 1 shows (although this is not as clear for the other speakers).
Figure 1: Intensity curve for a sentence by VB, sound file 4
Sound file 4: It’s not really in the area where I’m looking for something so (i)t wasn’t very
convenient really (speaker VB)
This might be due to the type of discourse: VB is a speaker from the informal conversation sample. When her intensity declines, it is a sign that she has finished and another speaker can take the speech turn. The other 3 speakers are taken from the political debate, which is a different style in which the speakers usually want to keep talking and avoid being interrupted.
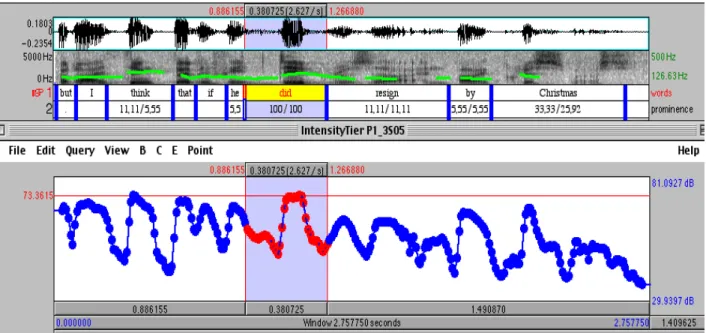
The highest intensity values are often to be found on the first accented word in the intonation unit (the head) and similar intensity values for the head and the emphatic word are observed. Figures 2 (sound file 5) and 3 (sound file 6) below exemplify this phenomenon. We can see on figure 2 that the level of intensity for the emphatic word “did” is the same as that of the first accented word “think”:
Figure 2: Sound file 5: oscillogram, spectrogam and F0 curve,with 2 tiers displaying the words
and the degree of emphasis in the first window. Intensity curve in the second window.
Sound file 5: but I think that if he did resign by Christmas (speaker JT)
On figure 3 below, the intensity curve is as high for the emphatic word “uncomfortable” as for the accented syllables of “maintain” and “coalition”:
Figure 3: same as figure 2 for sound file 6
Sound file 6: is to maintain this rather uncomfortable coalition that exists within the cabinet (speaker JT)
The results of the pre-analyses being encouraging, analyses on the whole corpus were carried out.
3. Acoustic analyses and measurements 3.1. Measures
I measured intensity at very short intervals so as to compare very close targets and minimize the problem of variability. I had previously done a rhythmic labelling of the corpus into intonation units but also in smaller units called tonal units following Hirst (1999, 2005) and Hirst et al. (2000). The tonal unit as defined here starts at the beginning of an accented word and encompasses the unaccented words until the next accented word (which means it is word-boundary dependent):
‘cause you / just / feel it in the / House of / Commons a / lot
Intensity measures were taken for each tonal unit (labelled UT for French Unité Tonale), for each word (mot) longer than 64 ms (PRAAT cannot give an intensity value for shorter segments) and for each intonation unit (labelled UI, which stands for French Unité Intonative): I thought this measure could be relevant in cases when there was no external noise or movement. For each of these 3 rhythmic units, 5 parameters were measured:
• minimal intensity in dB (MinInt), • the corresponding time in seconds (s.), • maximal intensity in dB (MaxInt), • the corresponding time in s., • mean intensity in dB (MeanInt).
3.2. Calculations
Then the differences between the values in percentage were calculated:
• EcMxImt_MeanIUI (Ec stands for écart meaning gap: this is the gap between MaxInt_mot and
MeanInt_UI): this calculation gives the relative difference between the max intensity value on
the word and the mean intensity value of the intonation unit.
• EcMxIUT_MeanIUI (gap between MaxInt_UT and MeanInt_UI): this is the same calculation as above but the max intensity value is taken on the tonal unit here (UT).
• EcMinImt_MeanIUI (gap between MinInt_mot and MeanInt_UI): the min intensity value on the word is compared here to the mean intensity value of the intonation unit.
• EcMinIUT_MeanIUI (gap between MinInt_UT and MeanInt_UI): same measure as above but the word is replaced by the tonal unit.
• EcMxIntmot_UI (gap between MaxInt_mot and MaxInt_UI): the max intensity values on the word and on the intonation unit are compared.
• EcMxIntUT_UI (difference between MaxInt_UT and MaxInt_UI): the max intensity values on the tonal unit and on the intonation unit are compared.
• EcMinImot_UI (difference between MinInt_mot and MinInt_UI): the min intensity values are compared between the word and the intonation unit here, and between the tonal unit and the intonation unit for the next parameter:
• EcMinIUT_UI (difference between MinInt_UT and MinInt_UI).
• EcMeanImot_UI (gap between MeanInt_mot and MeanInt_UI): still following the same principle, the mean intensity values of the word and of the intonation unit are compared here. • EcMeanIUT_UI (gap between MeanInt_UT and MeanInt_UI) : this calculation compares the
mean intensity values between the tonal unit and the intonation unit.
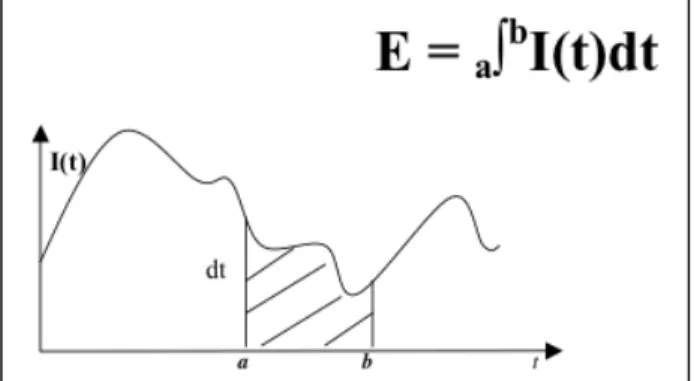
3.3. Total amplitude
Following Beckman (1986), I calculated a final parameter called total amplitude (TA), which corresponds to the energy used to produce a sound. TA is the intensity integral over a certain period
of time (from a to b), i.e. the product of instantaneous intensity (I(t)) by the differential interval of time (dt), as shown in figure 4 below:
Figure 4: total amplitude = intensity integral over a period of time (from a to b)
Total amplitude is relevant according to Beckman (1986) for stress accent languages like English, where several parameters play a role in the perception of the melodic accent, as opposed to pitch accent languages like Japanese for instance, where only the melody intervenes. TA was calculated for each word (TA_mot) as follows: the duration (in seconds) of the word was multiplied by the mean intensity value of the word (in dB), giving an approximation of the striped surface shown on figure 4 in dB.s.
4. Statistical analysis 4.1. Method
Once all the measures taken and calculations done for intensity, they were entered in a database, along with data concerning fundamental frequency and duration, all 3 parameters (F0, duration and intensity) being known as the most relevant in the perception of prominence (cf. Hirst & Di Cristo, 1999, amongst others). Details are given in section 3 for intensity but the same kind of work, with similarly complex measurements and calculations, was performed for F0 and duration (cf. Herment-Dujardin, 2001).
A statistical analysis was carried out with the software CRUISE (Kim & Loh, 2001), which generates classification trees. Different classes of emphasis were needed and I decided on three, using the degree of emphasis previously described (cf. 2.1):
0 = non emphatic (0 to 32%) 1 = emphatic (33 to 65%) 2 = very emphatic (66 to 100%)
4.2. Results
I ran the software for the whole primary corpus, for each speech style and for each speaker.
4.2.1. Primary corpus
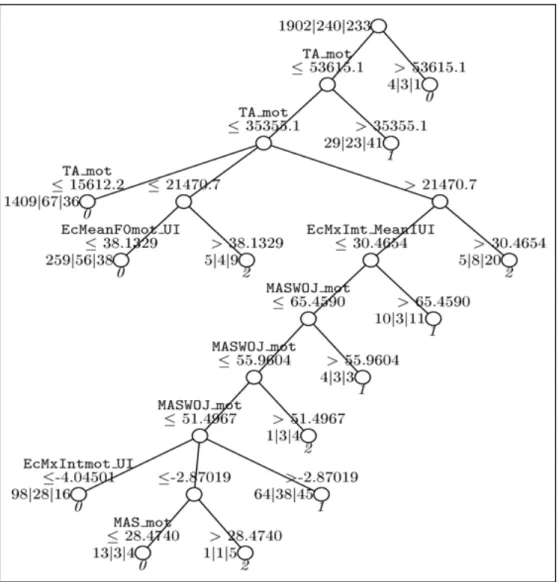
The trees obtained with Cruise are very complex. Figure 5 below shows the tree generated for the whole primary corpus. We can see that total amplitude is the most relevant criterion at both extremes. If TA is weak, there is likely to be little emphasis. If TA is high, there is likely to be much emphasis. If TA is average, i.e. if the energy is not decisive, then other parameters show up: F0 and intensity. The pitch movement is particularly relevant then (EcMeanF0mot_UI and
MASWOJ_mot, which is the slope - MASWOJ stands for mean absolute slope without octave
jump). If the pitch movement is large and starts higher than for the rest of the intonation unit, the word will be perceived as emphatic. Intensity, more precisely the difference between the max
intensity value of the word and the mean intensity value of the intonation unit (EcMxImt_MeanIUI), comes third: if a word is uttered with a stronger intensity than the words around in the intonation unit, it is perceived as emphatic.
Figure 5: classification tree for the primary corpus
4.2.2. Speech styles
For the political debate (4 speakers analysed), F0 is the most relevant parameter (SD_mot, i.e. Standard Deviation on the word). Intensity comes next (the difference between the max values on the word and the intonation unit).
For the conversation (4 speakers), total amplitude (TA) is the first criterion and intensity comes second again: if TA is average, the difference between the max intensity value of the word and the mean intensity of the intonation unit becomes relevant.
Finally, for the radio programme (2 speakers), F0 comes first (with the difference between the max F0 value on the word and the mean F0 value of the intonation unit). Intensity is second again, with the difference between the max values of the word and the intonation unit (EcMxIntmot_UI).
When we check the validation files in CRUISE, we see that the results for the political debate are less reliable than for the other 2 speech styles. This is probably due to the different individual strategies used by the politicians who are orators as opposed to the other speakers of the corpus who certainly develop fewer means for emphasis. For the same reason, the higher the number of speakers, the more difficult it is to draw tendencies.
4.2.3. Speakers
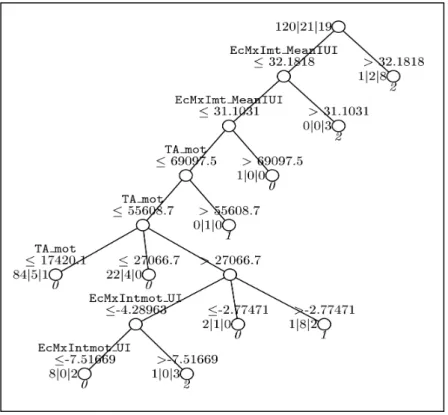
The trees are indeed very different from one speaker to the other, reinforcing the idea that each speaker uses different ways of expressing emphasis. Figures 6 and 7 show two totally different trees:
Figure 6: classification tree for speaker VB
Figure 7: classification tree for speaker PS
TA is the only criterion coming out for speaker VB (and for another speaker –YB– too): if TA is high, the word is very emphatic; the opposite is also true: if TA is low, the word is not emphatic. The tree for speaker PS is very different and much more complex. PS probably uses different strategies to express emphasis, intensity (EcMxImt_MeanIUI) being the most relevant criterion for him: if the gap is higher than 31%, then the word is highly emphatic. If it is smaller than 31%, then TA is relevant, and then intensity shows up again.
The results for the other speakers are also heterogeneous. For DD, PM and CB, total amplitude comes out first, followed by F0. For MM and JT, the fundamental frequency (the standard deviation on the word) is the most important parameter for emphasis. Intensity comes next (EcMxIntmt_UI). Speaker DL uses energy (TA) and intensity (EcMxIntmt_UI or EcMaxIUT_UI: the smaller the
difference, the more emphatic the word, of course, since there are chances for the emphatic word to be the highest in intensity of the intonation unit).
It is precisely because of this heterogeneity that the tree for the whole corpus is so complex (figure 5).
5. Intensity dropping
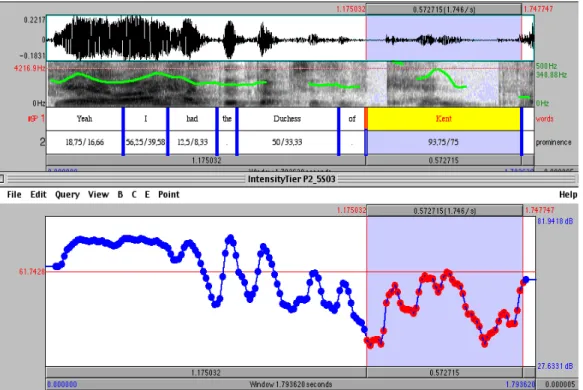
It should not be forgotten that this is a study based on a statistical analysis and it can be very interesting to focus on particular cases. We have just seen that the classification trees are very different from one speaker to the other (cf. figures 6 & 7). We have also mentioned the different speech styles: a speaker won’t use the same means if they take part in a political debate or if they have an informal conversation, using individual strategies. When the statistical analysis picks intensity as a relevant criterion in the perception of emphasis, it is a rise in intensity because this is what happens most of the time. However, a drop in intensity can also be relevant. There is in the corpus one case of intensity dropping which is a clear means of emphasizing a word. Figure 8 shows a PRAAT window with the oscillogram in the upper part, the spectrogram and the F0 curve below and two tiers with the words and the percentage of emphasis below each word. The intensity curve is in the lower part.
Figure 8: intensity dropping: sound file 7 Sound file 7: yeah I had the Duchess of Kent (VB)
The emphatic segment is “Kent” (highlighted in the window above). The intensity drops significantly (the mean value is 54.45 dB for the word “Kent” and 69.42 dB for the rest of the intonation unit), while the pitch movement is a high falling tone as can be seen on the F0 curve. This phenomenon is not very common: when the F0 curve rises, the intensity usually increases as well. We have the opposite case here. The initial plosive /k/ is also lengthened, as visible on the spectrogram. A combination of parameters is observed in this particular case, the dropping of intensity being the main one.
The word is perceived as very emphatic because it is not pronounced like the adjacent words or the other words uttered by the speaker. Intensity, a decrease here, is probably the most important acoustic feature in this particular example.
6. Conclusions
The major result of the global study of the acoustic and prosodic correlates of emphasis is that total amplitude (TA) is the main parameter in the perception of emphasis. Total amplitude includes intensity since it is the combination of intensity and duration on a period of time. The more energy is spent to pronounce a word, the more emphatic it will be perceived. F0 comes next and intensity third, according to our statistical analysis on the whole primary corpus (cf. 4.2.1). These results corroborate those found by Kochanski et al. (2005), who studied the acoustic correlates of prominent syllables in different dialects of British English in a corpus of natural speech. They show that “speakers primarily marked prominence by patterns of loudness and duration”.
The results presented here also show that emphasis is perceived thanks to a combination of parameters, that this combination is speaker-dependent, and that among the different parameters, we find intensity.
It is therefore possible to assert that intensity is a highly relevant criterion in the perception of emphasis, even in spontaneous speech. More generally, we can say that intensity is an important parameter to be taken into account in studies on oral spontaneous speech. Of course, when measuring intensity and comparing data, one must be very careful and avoid the problem of variability. Then, even if the recording conditions are not optimal, intensity is definitely measurable and proves to be very relevant.
7. References
Beckman, M. & Edwards, J., Articulatory evidence for differentiating stress categories, in Keating, P.A., (eds.), Phonological Structure and Phonetic Form. Papers in Laboratory Phonology III, Cambridge: Cambridge University Press: 1-33, 1994.
Beckman, M., Stress and Non-Stress Accent, Dordrecht : Foris Publications, 1986.
Boersma, P. & Weenink, D., “PRAAT: a system for doing phonetics by computer”, Glot
International 5(9/10): 341-345, 2001.
Brown, W.S. & McGlone, R.E., Aerodynamic and acoustic study of stress in sentence productions,
Journal of the Acoustical Society of America 56: 971-974, 1974.
Campbell, N. & Beckman, M., “Stress, Loudness and Spectral Tilt”, Proceedings of the Acoustical
Society of Japan, Spring meeting, 3-4-3, 1995.
Campbell, N., Loudness, spectral tilt, and perceived prominence in dialogues, Proceedings of the
XIIIth International Congress of Phonetic Sciences (Stockholm 1995), 3: 676-679, 1995.
Fry, D.B., Duration and intensity as physical correlates of linguistic stress, Journal of the Acoustical
Society of America 27/4: 765-768, 1955.
Fry, D.B., Experiments in the perception of stress, Language and Speech 1: 126-152, 1958.
Herment-Dujardin, S., L'emphase dans le discours spontané anglais : corrélats acoustiques et
prosodiques. Thèse de doctorat, Université de Provence, Aix-en-Provence, France, 2001.
Herment, S., COEC: a Corpus of English Conversation, [CRDO] <http://crdo.fr/crdo000014>, 2010.
Hirst, D.J. & Di Cristo, A., Intonation Systems: a Survey of Twenty Languages, Cambridge: Cambridge University Press, 1998.
Hirst, D.J., “The symbolic coding of duration and timing: an extension to the INTSINT system”,
Hirst, D.J., “Form and function in the representation of speech prosody”, Speech Communication, 46 (3-4): 334–347, 2005.
Hirst, D.J., Di Cristo, A. & Espesser, R., Levels of representation and levels of analysis for intonation, in M. Horne, (ed.): 51-88, 2000.
Kim, H. & Loh, W-Y., CRUISE, “User Manual”, Technical Report 989, March 3, 1998, revised November 10, 2001, Department of Statistics, University of Wisconsin, Madison, 2001.
Kochanski, G., Grabe, E., Coleman, J. & Rosner, B., “Loudness predicts prominence: fundamental frequency lends little”. Journal of the Acoustical Society of America 118, 1038-1054, 2005. Sluitjer, A. & van Heuven, V., “Perceptual clues of linguistic stress : intensity revisited”, Working
Papers 41, Proceedings of the ESCA Workshop on Prosody, Lund University, Sweden,
246-249, 1993.
Sluitjer, A. & van Heuven, V., “Spectral balance as an acoustic correlate of linguistic stress”,