HAL Id: inserm-00515600
https://www.hal.inserm.fr/inserm-00515600
Submitted on 7 Sep 2010
HAL is a multi-disciplinary open access archive for the deposit and dissemination of sci-entific research documents, whether they are pub-lished or not. The documents may come from teaching and research institutions in France or abroad, or from public or private research centers.
L’archive ouverte pluridisciplinaire HAL, est destinée au dépôt et à la diffusion de documents scientifiques de niveau recherche, publiés ou non, émanant des établissements d’enseignement et de recherche français ou étrangers, des laboratoires publics ou privés.
Combining voltage and calcium imaging from neuronal
dendrites.
Marco Canepari, Kaspar Vogt, Dejan Zecevic
To cite this version:
Marco Canepari, Kaspar Vogt, Dejan Zecevic. Combining voltage and calcium imaging from neu-ronal dendrites.. Cellular and Molecular Neurobiology, Springer Verlag, 2008, 28 (8), pp.1079-93. �10.1007/s10571-008-9285-y�. �inserm-00515600�
Cellular and Molecular Neurobiology, in press
Combining voltage and calcium imaging from neuronal
dendrites
Marco Canepari1, 2, Kaspar Vogt1, Dejan Zecevic2
1 Abteilung Neurophysiologie und Neuropharmacologie, Biozentrum – University
of Basel, Basel, Switzerland
2 Department of Cellular and Molecular Physiology, Yale University School of
Medicine, New Haven, CT 06520, USA
Correspondence to: Dr. Marco Canepari
Abteilung Neurophysiologie und Neuropharmacologie, Biozentrum – University of Basel, Klingelbergstrasse 70, 4056 Basel, Switzerland
Tel.: +41 (61) 2672179 Fax: +41 (61) 2672179 E-mail: [email protected]
SUMMARY
The ability to monitor membrane potential (Vm) and calcium (Ca2+) transients
at multiple locations on the same neuron can facilitate further progress in our understanding of neuronal function. Here we describe a method to combine Vm
and Ca2+ imaging using styryl voltage sensitive dyes and Fura type UV-excitable Ca2+ indicators. In all cases Vm optical signals are linear with membrane potential
changes, but the calibration of optical signals on an absolute scale is presently possible only in some neurons. The interpretation of Ca2+ optical signals depends on the indicator Ca2+ buffering capacity relative to the cell endogenous buffering capacity. In hippocampal CA1 pyramidal neurons, loaded with JPW-3028 and 300 µM Bis-Fura-2, Vm optical signals cannot be calibrated and the physiological
Ca2+ dynamics are compromised by the presence of the indicator. Nevertheless, at each individual site, relative changes in Vm and Ca2+ fluorescence signals
under different conditions can provide meaningful new information on local dendritic integration. In cerebellar Purkinje neurons, loaded with JPW-1114 and 1 mM Fura-FF, Vm optical signals can be calibrated in terms of mV and Ca2+ optical
signals quantitatively reveal the physiological changes in free Ca2+. Using these two examples, the method is explained in detail.
Keywords: voltage-sensitive dyes, calcium-sensitive dyes, imaging, neuronal
INTRODUCTION
Membrane potential (Vm) and intracellular calcium (Ca2+) transients are the
basic signalling mechanisms in nerve cells. Thus, an optical technique that allows monitoring both signals at multiple locations on the same neuron can significantly improve our capability to investigate and understand neuronal function.
The initial idea of multiple-site optical recording of membrane potential transients (voltage imaging) from individual nerve cells using selective staining of neurons by intracellular application of voltage sensitive dyes (Cohen et al., 1974; Grinvald et al., 1987) was further developed, first in invertebrate neurons in isolated ganglia (Antic and Zecevic, 1995; Zecevic, 1996; Antic et al., 2000) and subsequently adopted for mammalian nerve cells in brain slices (Antic et al., 1999; Antic, 2003; Djurisic et al., 2004). Numerous analogues of the most successful voltage sensitive dyes were tested for intracellular application (Grinvald et al., 1987; Antic and Zecevic, 1995). Presently, the optimal voltage indicators in recording from neuronal processes of individual neurons in brain slices are a fluorescent dye designated JPW-1114 (also called di-2-ANEPEQ; available from Invitrogen - Molecular Probes) and its close analogue JPW-3028 (di-1-ANEPEQ) (Djurisic et al., 2004; Milojkovic et al., 2005; Palmer and Stuart, 2006; Berger et al., 2007; Gasparini et al., 2007; Canepari et al., 2007). These dyes are lipophilic but still sufficiently water soluble to be used for microinjection. Both dyes belong to aminostyryl pyridinium class of fast potentiometric membrane dyes that undergo a large charge shift upon excitation and display a strictly linear electrochromic response to membrane potential in the range of -100 mV to 100 mV (Loew and Simpson, 1981; Loew et al., 1992). The excitation wavelengths used for Vm imaging for this dye are in the range of 520±45 nm.
Similar sensitivity was recently reported for a new series of styryl electrochromic dyes developed to extend the excitation wavelength from 450–550 nm range to wavelengths close to 700 nm (Zhou et al., 2007).
If a neuron is stained with two indicators with different spectral properties, the time course of two independent physiological variables can be monitored at the same locations in the same experiment and directly correlated. The possibility to combine optical recordings using two indicators has been utilised to measure intracellular pH and Ca2+ (Martinez-Zaguilan et al., 1991) and slow membrane
potential changes and Ca2+ signals (Kremer et al., 1992). For combined fast Vm
and Ca2+ optical recordings, because the best known styryl dyes are characterised by broad excitation and emission spectra, the choice of a specific Ca2+ indicator is limited. One possibility is to use blue-excitable green-fluorescent Ca2+ indicators (i.e. Fluo, Calcium Green and Oregon Green indicators) as reported by Bullen and Saggau (1998) and by Berger et al. (2007) or green-excitable orange-fluorescent Ca2+ indicators (Sinha and Saggau, 1999). The use of these Ca2+ indicators in combination with styryl dyes has two main disadvantages. First, because of the large overlap in the excitation spectra and the still significant overlap in the emission spectra of the voltage and Ca2+
indicators, Ca2+ related fluorescence signals can be contaminated by the fluorescence from the voltage sensitive dye (unpublished observations). Second,
since the wavelengths that are used to excite the Ca2+ indicator are strongly
absorbed by the voltage sensitive dye, Ca2+ measurements contribute to the photo-damage caused by the voltage sensitive dye. To minimise these problems, combined Vm and Ca2+ imaging can be done using UV-excitable Ca2+ indicators
such as Bis-Fura-2, as described in our recent study (Canepari et al., 2007) and by Milojkovic et al. (2007). In principle, Ca2+ signals with similar optical properties can be obtained using anyone of the commercially available UV-excitable Fura dyes (Fura-2, Bis-Fura-2, Fura-4F, Fura-5F, Fura-6F, Fura-FF and Mag-Fura-2).
Although the use of UV-excitable Ca2+ indicators provides independent Vm
and Ca2+ fluorescent signals, combining Vm and Ca2+ imaging have limitations
that depend on neuronal properties. In voltage imaging, an important factor is the ability to calibrate signals in terms of membrane potential (in mV). In some neurons this calibration is possible because a voltage signal of known amplitude is available at every recording site and can be used as a calibration standard. For example, in mitral cells of the olfactory bulb the axo-somatic action potentials are known to propagate without attenuation along the dendritic arbor (Bischofberger and Jonas, 1997) and were used to calibrate Vm optical recordings (Djurisic et al.,
2004). In cerebellar Purkinje neurons such a calibration could be accomplished using a prolonged hyperpolarisation generated in the soma which spreads with little attenuation along the dendritic tree (Stuart and Häusser, 1994). In the majority of the neurons, however, a calibrating signal is not available and the amplitude of Vm optical signals from different sites cannot be quantitatively
compared. Nevertheless, at each individual site, Vm optical signals still vary as a
linear function of the membrane potential change. This signal can be used for providing spatially well resolved analysis of relative changes in membrane potential responses under different conditions. Additionally, an approximate calibration of optical signals on an absolute scale is possible in many parts of the dendritic arbor of several principal neuronal types. Such a calibration is based on the known absolute amplitude of the decremental back-propagating action potential in different parts of the dendritic tree (e. g. Frick et al., 2004).
The interpretation of Ca2+ optical signals depends on the Ca2+ buffering capacity of the indicator relative to the endogenous buffering capacity of the cell. At one extreme, if the Ca2+ buffering capacity of the dye is significantly higher than the endogenous Ca2+ buffering capacity of the cell, the physiological Ca2+
homeostasis is altered by the presence of the indicator and the quantitative estimation of intracellular free Ca2+ concentration becomes meaningless (Nowycky and Pinter, 1993). Nevertheless, Ca2+ optical signals will still reflect the
kinetics of the dye-bound Ca2+ and can serve as an estimate of the total intracellular Ca2+ increase. At the opposite extreme, if the buffering capacity of an indicator is so low that its presence does not significantly alter the physiological Ca2+ homeostasis, Ca2+ optical signals can be used to measure intracellular free Ca2+ changes at any location with minimal distortion by diffusion of the dye-bound Ca2+.
In this report, we illustrate the method of combined Vm and Ca2+ imaging by
two indicative examples. In the first example, we explore hippocampal CA1 pyramidal neurons in which Vm signals cannot be precisely calibrated and the
dye Ca2+ buffering capacity dominates the relatively low endogenous Ca2+
buffering of the neuron. In the second example we explore cerebellar Purkinje neurons in which Vm optical signals can be calibrated and the dye Ca2+ buffering
is negligible compared to the relatively high endogenous Ca2+ buffering of the
cell.
METHODS
Slice preparation
Experiments on hippocampal CA1 pyramidal neurons were carried out on hippocampal slices from 21-30 day old Sprague-Dawley rats. The rats were decapitated following halothane anaesthesia and 300 μm thick slices were cut as described in Canepari et al. (2007). Slices were incubated at 37 0C for 30 minutes and then maintained at room temperature (23-25 0C). Measurements were done at 33-35 0C. The extracellular solution used during slicing, incubation and recording contained (in mM): 125 NaCl, 26 NaHCO3, 20 glucose, 2.5 KCl,
1.25 NaH2PO4, 2 CaCl2 and 1 MgCl2, and was bubbled with gas mixture (95%
O2, 5% CO2).
Experiments on cerebellar Purkinje Neurons were done in 250 µm thick sagittal cerebellar slices from 25-35 days old mice (C57BL/6). Animals were decapitated following halothane anaesthesia (according to the Swiss regulation) and slices were prepared in ice-cold solution using a HM 650 V vibroslicer (Microm, Germany). Slices were incubated at 35 0C for 40 minutes and thereafter maintained at room temperature (23-25 0C). Measurements were done at 32-34
0C. The extracellular solution used during incubation and recording contained (in
mM): 125 NaCl, 26 NaHCO3, 20 glucose, 3 KCl, 1 NaH2PO4, 2 CaCl2 and 1
MgCl2, pH 7.4 when bubbled with gas mixture (95% O2, 5% CO2). The solution
used for slicing contained 0.4 mM mM CaCl2 and in some animals 250 mM
sucrose replaced NaCl. .
Electrophysiological recordings
Somatic whole-cell recordings were made with a Multiclamp 700A amplifier (Axon Instruments, USA) under visual control using infrared DIC video-microscopy on an upright microscope (Model BX51-WI, Olympus, Japan). The basic intracellullar solution contained (mM): 120 KMeSO4, 10 NaCl, 4 Mg-ATP,
0.3 Tris-GTP, 14 Tris-Phosphocreatine, 20 HEPES (pH 7.3, adjusted with KOH). Dyes (all purchased from Molecular Probes - Invitrogen, Carlsbad, CA, USA except JPW-3028 obtained from Leslie Loew and Joe Wuskell of the University of Connecticut) were dissolved in water and added to their final concentration of that was 0.25-1 mg/mL for the voltage sensitive sensitive dyes. The procedure of staining individual neurons with voltage sensitive dyes is described in the first part of the result section. Local stimulation of presynaptic fibres was carried out with patch pipettes filled with extracellular solution positioned using hydraulic manipulators (Narishige, Japan).
Imaging apparatus and data analysis
The schematic of the imaging apparatus is shown in Fig. 1. The source of excitation light was either a 250 W xenonarc lamppowered by Model 1700XT/A power supply (Opti-Quip, Highland Mills, NY, USA) or a 150 W xenon lamp (CAIRN Research Ltd., Faversham, UK). The light was directed either to a filter cube for the voltage sensitive dye or to another cube optimised for the Ca2+ indicator. The cubes were inserted in the light pathway with a manual switch. The JPW filter cube had an excitation band-pass filter ex1 = 525±25 nm, a dichroic mirror dic1 > 570 nm and a long-pass emission filter em1 > 610 nm. The Fura filter cube had a band-pass excitation filter ex2 = 387±6 nm, a dichroic mirror dic1 > 470 nm and a band-pass emission filter em1 = 510±42 nm. The excitation light from the filter cube was further directed to a water immersion objective (either Nikon 60X/1.0 NA or Olympus 60X/1.1 NA) to illuminate the preparation and the fluorescent image of the stained cell, was projected via an optical coupler (either 0.1X for hippocampal CA1 pyramidal neurons or 0.25X for cerebellar Purkinje neurons) onto a CCD chip of a NeuroCCD-SM (RedShirtImaging LLC, Decatur, GA, USA). The imaged field was ~ 300 µm X 300 µm and ~125 µm X 125 µm in measurements from hippocampal CA1 pyramidal neurons or from cerebellar Purkinje neurons respectively. The NeuroCCD-SM CCD is a fast data acquisition camera with 80X80 pixels designed primarily for voltage imaging. The camera can acquire up to 2000 frames/s at full-frame resolution. In Ca2+
measurements, images were acquired at 500 frames/s. Vm signals were acquired
either at 2000 frames/s or at 5000 frames/s (binning factor 3). During the experiment, individual trials were saved and checked for consistency. This was necessary to correlate Vm and Ca2+ signals and average trials in order to
increase the signal-to-noise ratio. Data were analysed either with NeuroPlex (RedShirtImaging LLC, Decatur, GA, USA) or with dedicated software written in Matlab (The MathWorks Inc., Natick, MA, USA).
Pharmacological effects and photodynamic damage of JPW-1114 at cerebellar Purkinje neurons
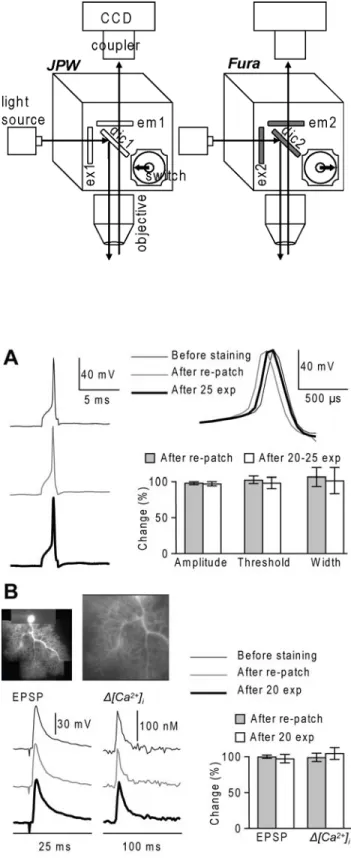
Cell overload with voltage sensitive dyes or excessive exposures to light can cause pharmacological effects and photodynamic damage. Previous studies have shown that voltage sensitive dyes JPW-1114 or JPW-3028 have little pharmacological effect when applied at functional concentrations to vertebrate neurons. Staining and a moderate number of repetitive exposures to light had negligible effect on the size and waveform of action potentials elicited by somatic current injection in neocortical and CA1 hippocampal pyramidal neurons and in mitral cells of the olfactory bulb (Antic et al., 1999; Antic, 2003; Djurisic et al., 2004; Palmer and Stuart, 2006; Canepari et al., 2007). We repeated the same test in cerebellar Purkinje neurons from the mouse. In 4 cells, stained at 32-34 ºC with JPW-1114, action potentials were recorded somatically at a sampling rate of 16 kHz during the staining, immediately after re-patching following equilibration of the dye inside the cell and after 20-25 light exposures lasting 150 ms and separated by 30 s time intervals. The summary results of this test are shown in
Fig. 2(A). The amplitude of the action potential relative to the initial amplitude (mean ± SD) was 0.98±0.02 after re-patching and 0.97±0.06 following the light exposures. The firing threshold relative to the initial one was 1.02±0.05 after re-patching and 0.99±0.08 following the light exposures. The width at half-height, typically 4-5 data points, changed at most 1 sample in either direction. Its value relative to the initial one was 1.06±0.13 after re-patching and 1.02±0.18 following the light exposures. The changes in these parameters were not significant (P>0.1, paired t-test) demonstrating that pharmacological effects and photodynamic damage did not influence somatic action potentials in Purkinje neurons. In Purkinje neurons, somatic action potentials do not back-propagate to the dendrites (Stuart and Häusser, 1994). In order to test the effects of the dye on dendritic signals, we measured the somatic climbing fibre excitatory postsynaptic potential (EPSP) and the associated Ca2+ signal in the dendrites during the staining, immediately after re-patching following equilibration of the dye and after 20 light exposures. Ca2+ signals were estimated by averaging fluorescence over the entire imaged dendrite to minimise fluctuations due to local variability. The climbing fibre EPSP is an all-or-none synaptic potential enabling us to explore the pharmacological effects of JPW-1114 directly on synaptic signals at the site of origin. In order to prevent somatic firing associated with the climbing fibre EPSP, this test was done with 10 mM of the Na+ channel blocker QX-314 in the internal solution. The summary of the results is shown in Fig. 2(B). The amplitudes of the EPSP and Ca2+ signal, relative to their initial values, were 1.00±0.02 and 0.99±0.10 after re-patching and 0.97±0.06 and 1.06±0.08 after 20 light exposures (N=5 cells, P>0.1 in all paired t-tests). We concluded that the voltage sensitive dye did not significantly affect excitatory synaptic transmission and dendritic excitability in cerebellar Purkinje neurons.
RESULTS
Staining of the cells and recording procedures
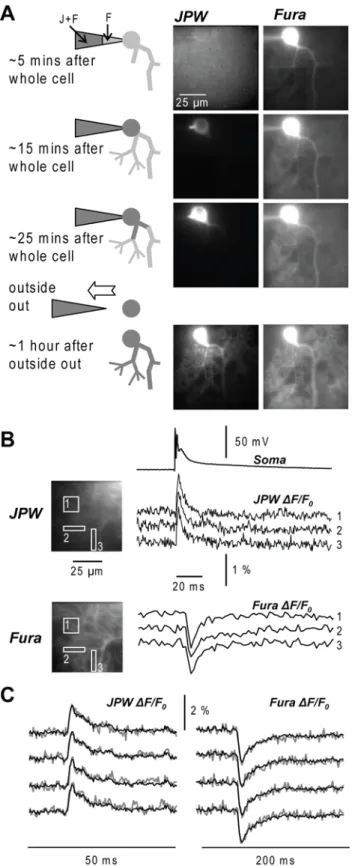
The staining protocol for a cerebellar Purkinje neuron is illustrated in Fig. 3(A). Intracellular staining was accomplished by free diffusion of the dyes from a patch-electrode into the soma in 15-60 minutes, depending on the electrode resistance. Glass pipettes were first filled from the tip with dye-free solution by applying negative pressure for about 1 minute and then back-filled with the solution containing the two indicators. Dye-free solution in the tip was necessary to prevent the leakage of the dye into the extracellular medium before the electrode is attached to the neuron.
Although the equilibration of the Ca2+ indicator in distal dendrites takes longer than 20 minutes, Fura fluorescence over the entire dendritic field could be detected already after 5-10 minutes when JPW fluorescence was almost absent. JPW fluorescence in the soma was detectable after 10-20 minutes with the highest increase typically after 20-30 minutes. The patch electrode was detached from the cell by forming an outside-out patch after 30-45 minutes when the resting light intensity from the soma, measured using 0.75% of the total light
intensity, in order to prevent pharmacological effects due to dye overload (Djurisic et al., 2004; Canepari et al., 2007). Presently, the signal-to-noise ratio for voltage imaging increases with the light intensity but is usually limited by the photodynamic damage. While there is a nonlinear (third order) relation between the damage and the illumination intensity, there is a linear relation between the damage and dye concentration (Sacconi et al., 2006). Thus, it is favourable to maximise staining. In hippocampal CA1 pyramidal neurons experiments, the dye diffusion from a patch-pipette into the cell body continued until the first change in the action potential shape was detected (30-45 minutes). The resting light intensity in the soma was then determined under standard recording conditions (2 KHz frame rate; 0.075% of the full excitation light intensity). In subsequent experiments we gradually extended the staining period to increase the amount of dye in the soma, as indicated by the resting light intensity, until irreversible damage to the neuron was caused. The damage was, most likely, caused by the nonspecific pharmacological effects of the dye. In subsequent experiments, the staining was then adjusted to be slightly below the damaging concentration of the dye.
After that, the preparation was incubated for additional 1-2 hours at room temperature to allow the voltage-sensitive dye to diffuse into distal processes. The position of the cell was localised within the slice using the voltage fluorescence and the cell body was usually re-patched before making optical measurements to obtain electrical recordings from the soma. Both the duration of staining and the equilibration period depend on temperature. Although these were faster at near physiological temperatures (32º-34º), the survival of cells was better if the staining and the incubation were done at 24º. Thus, staining and incubation was routinely done at room temperature except in the experiments used to test the toxicity of the dye.
An example of Vm and Ca2+ optical signals obtained sequentially from the two
indicators from three regions on the dendritic tree of a Purkinje neuron stained by JPW-1114 and Fura-FF is illustrated in Fig 3(B). An intracellular calcium increase corresponds to a fractional decrease of fluorescence for a Fura dye excited at 387 nm (see methods). The signals were elicited by the activation of a climbing fibre EPSP. The signal-to-noise ratio in these recordings was improved by averaging 4 responses. Signal averaging as well as the sequential recording of Vm and Ca2+ signals is meaningful only if repeated application of the same
stimulation protocol resulted in the same response. This was confirmed in measurements of the type shown in Fig. 3(C). The Vm and the Ca2+ signals were
recorded from a 10 X 10 µm location on the dendritic tree of a Purkinje cell in response to four repetitions of climbing fibre activation separated by 1 minute. The results showed that signals were practically identical in 4 individual trials (gray traces). The superimposed black traces correspond to the averages of Vm
and Ca2+ responses. Therefore, it was possible to directly compare Vm and Ca2+
signals recorded sequentially.
Interpretation of Vm and Ca2+ optical signals
scale in terms of membrane potential. In a multi-site recording, the fractional change in light intensity is proportional to voltage, but also, to a different extent at different sites, to the ratio between the amount of dye that is bound to membranes that do not change potential (inactive dye) and the amount of dye that is bound to membranes that change potential (active dye). This ratio is unknown and varies in different regions of the neuron. Thus, the fractional change of fluorescence corresponding to a given membrane potential change is different in recording from different regions of the cell and the calibration of all detector pixels cannot be done by calibrating the optical signal from any single site.
Since the fractional change of fluorescence corresponding to a given membrane potential transient from a given site is fairly stable over many acquisition trials, such a calibration is absolute and straight-forward if a calibrating electrical signal of known amplitude is available at all locations. An all-or-none action potential signal is ideal for this purpose and can be used to create a "sensitivity profile" of the neuron under study. This type of calibration was used to scale the amplitudes of optical signals from mitral cells (Djurisic et al., 2004). A similar calibration is possible in the dendritic tree of Purkinje neurons using a long lasting hyperpolarising pulse which spreads into the dendritic arbor from the soma with little amplitude attenuation (Stuart and Häusser, 1994). The same approach of calibrating Vm signals is not possible in hippocampal CA1 pyramidal
neurons (Canepari et al., 2007) or in neocortical pyramidal neurons (Antic et al., 1999: Antic 2003) because a membrane potential transient of known amplitude is not available. Nevertheless, at each individual site, voltage imaging provides useful information on relative changes in membrane potential responses under different conditions.
The interpretation of Ca2+ optical signals depends on how much a Ca2+
indicator perturbs the physiological Ca2+ homeostasis. The buffering capacity of a Ca2+ indicator, Kdye, is defined as the ratio between the dye-bound Ca2+ and the
free Ca2+ in the presence of the indicator. Some theoretical values of Kdye for the
commercially available Fura dyes at the concentrations of 300 µM and 1 mM are shown in Table I. The perturbation of the physiological Ca2+ introduced by the Ca2+ indicator can be evaluated by comparing the parameter Kdye with the
endogenous buffering capacity of the cell (Kcell) which can be measured using
standard procedures (Neher, 1995). Table II shows some examples of estimates of Kcell that can vary among different systems by two orders of magnitudes. The
parameter RK, defined as the ratio between Kdye and Kcell, provides an estimate of
the fraction of Ca2+ that binds to the indicator compared to the Ca2+ that binds to the endogenous buffer. The interpretation of Ca2+ optical signals is simplified in two extreme cases: RK >>1 and RK <<1.
If RK >>1, it is possible to assume that Ca2+ will bind almost exclusively to the
dye and the measurement of the physiological intracellular free Ca2+ is not possible in these conditions. If the Ca2+ indicator is not saturated, the total intracellular Ca2+ signal is given by the dye-bound Ca2+
Δ[DCa2+]= [D]·(Fmin-F)/(Fmin-Fmax) (1)
Fmax are the fluorescence at 0 and saturating Ca2+ (Ogden and Capiod, 1997;
Canepari et al., 2004). The resting intracellular free Ca2+ concentration is very low and Fmin can be approximated with the initial fluorescence (F0). Since the
auto-fluorescence of the slice can be typically used as a good estimate for Fmax, Δ[DCa2+] is proportional to the inverse fractional change in fluorescence after
auto-fluorescence subtraction (-ΔF/F). The spatio-temporal gradient of -ΔF/F reflects the binding of the Ca2+ to the dye and the diffusion of the dye-bound Ca2+ (Nowycky and Pinter, 1993; Canepari and Mammano, 1999). It follows that a signal that corresponds to a local increase in free Ca2+ concentration restricted to a particular site (for instance a dendritic spine) under physiological conditions, would be, in the presence of the indicator, observed elsewhere as result of the diffusion of Δ[DCa2+] following a local increase in Ca2+.
In the other extreme case of RK <<1, the fraction of a Ca2+ transient that
binds to the dye is negligible compared to the fraction bound to the endogenous buffering of the cell. Under these conditions, the estimate of the amplitude of the change in intracellular free Ca2+, given by
Δ[Ca2+]i = Kd·(Fmin-F)/(F-Fmax) (2)
will be very close to the physiological one and will also track the dynamics of intracellular free Ca2+ concentration. As in equation (1), Δ[Ca2+]i can be
approximated with Kd·(F0-F)/(F) where F0 is the initial (steady-state) fluorescence.
Under these conditions, Ca2+signals can be directly related to the physiological
functions of a neuron.
The following two examples describe the application of Vm and Ca2+ imaging
in preparations where optical signals can either be used to indicate relative changes under different experimental conditions or can be calibrated on the absolute scale.
Combined voltage and Ca2+ imaging from hippocampal CA1 pyramidal neurons
In measurements from CA1 pyramidal neurons, we loaded individual neurons with the voltage-sensitive dye JPW-3028 and 300 µM Bis-Fura-2 to analyse, over large regions of the dendritic tree, the Vm and Ca2+ signals responsible for the
induction of LTP. As stated above, Vm optical signals from the dendritic tree of
hippocampal CA1 pyramidal neurons cannot be precisely calibrated in terms of mV. These cells are also characterized by relatively low endogenous buffering capacity in the dendrites and even lower buffering capacity in the spines (Table II). Thus, in order to preserve physiological Ca2+ homeostasis, sub-millimolar
concentrations of low affinity Fura dyes (Fura-6F, Fura-FF or Mag-Fura-2) would have to be used. However, these dyes cannot reliably measure Ca2+ transients that, under physiological conditions, correspond to a Δ[Ca2+]i substantially lower
than 1 µM, such as those associated with back-propagating action potentials. Therefore, reliable measurements of small Ca2+ transients from hippocampal CA1 pyramidal neurons required application of Bis-Fura-2, a higher affinity indicator dye.
Fig. 4 shows typical measurements from a hippocampal CA1 pyramidal neuron. The sensitivity of Vm and Ca2+ imaging from an apical dendrite is
illustrated in panels (B) and (C). Optical signals correspond to a back-propagating action potential evoked in the soma by a depolarizing current pulse. Vm signals declined in amplitude with distance from the soma and became
undetectable in dendritic regions that were more than 400 µm away from the cell body (Fig. 4(B)). The amplitude of Vm signals from different locations, however,
can be compared only approximately because the optical signals could not be precisely calibrated. Ca2+ transients associated with the back-propagating action potential, recorded from the same dendritic regions, also declined in amplitude with distance from the soma (Fig. 4(C)). The relatively small fractional change in fluorescence (<2%) indicates that Ca2+ influx associated with a back-propagating action potential did not saturate the indicator and that the signal was proportional to the integral of the Ca2+ flux (e.g. Helmchen et al., 1996). However, since the Ca2+ entering the cell was almost exclusively sequestrated by the indicator, these measurements could not be used to estimate the physiological Ca2+ dynamics.
With these limitations in quantifying optical signals, our measurements are still qualitatively consistent with previous studies showing that the amplitude of the back-propagating action potential, as well as the associated Ca2+ transient, declined monotonically with distance from the soma along the distal part (> 200 µm from soma) of the main apical dendrite (Jaffe et al., 1992; Spruston et al., 1995; Frick et al., 2004). Additionally, the non-calibrated Vm and Ca2+ signals still
provide a unique possibility to analyse non-linear and spatially inhomogeneous interactions of dendritic membrane potential signals and Ca2+ signals that represent the first step in the induction of synaptic plasticity. This analysis is based on monitoring relative changes in Vm and Ca2+ signals from the same
regions on the dendritic tree under different experimental conditions. In the experiment illustrated in Fig. 4(E-G), Vm signals and Ca2+ transients were
recorded sequentially from the same locations on the dendritic arbour. Specifically, we analysed a critical Vm signal that is spatially correlated with the
supra-linear Ca2+ transient evoked by a theta-burst pairing protocol that typically induces LTP. Fig. 4(E) shows that the EPSP related Ca2+ transient is strictly limited to the site of activated synapses (region 5). Fig. 4(F-G) shows Vm and
Ca2+ signals related to back-propagating action potentials evoked alone (unpaired, black traces) and paired with a train of EPSPs (paired, red and blue traces) where the action potential was in coincidence with the fifth EPSP. Although a supra-linear Ca2+ signal was observed in different regions, only at location 5, adjacent to the stimulating electrode, it was mediated by NMDA receptors (see Fig. 6F in Canepari et al, 2007). The analysis of Vm and Ca2+
signals from this type of measurements resulted in the conclusion that unblocking of NMDA receptors during coincident activity and the resulting supra-linear increase in Ca2+ influx at the site of activated synapses did not require boosting of the back-propagating action potential baseline-to-peak amplitude as suggested in a number of previous studies (Canepari et al., 2007).
Combined voltage and Ca2+ imaging from cerebellar Purkinje neurons
As in pyramidal neurons, different patterns of synaptic activity can induce different forms of long-term synaptic plasticity in cerebellar Purkinje neurons. The
associative signal for synaptic plasticity in the dendrites of Purkinje neurons that do not support back-propagating action potentials is the climbing fibre EPSP, a large synaptic potential originating in the soma and in the proximal dendrite. This signal spreads along the distal dendrites where the parallel fibre synapses are formed. Repetitive activation of parallel fibre synaptic activity can either induce LTP or long-term depression (LTD) depending on whether parallel fibre stimulation is paired with climbing fibre stimulation (Coesmans et al., 2004). Full understanding of synaptic mechanisms underlying parallel fibre synaptic plasticity requires spatially well resolved recordings of both Vm and Ca2+ signals following
different patterns of parallel fibre and climbing fibre activity.
To demonstrate the ability to carry out these experiments, we filled Purkinje neurons with 1 mM of the Ca2+ indicator Fura-FF and with the voltage sensitive dye JPW-1114. Purkinje neurons have an exceptionally high dendritic Kcell
estimated at ~2000 (Fierro and Llano, 1996). Therefore, the addition of a low affinity Ca2+ indicator does not significantly alter the physiological homeostasis of Ca2+ and Ca2+ signals can be quantified in terms of Δ[Ca2+]i. Additionally, Vm ΔF/F signals can be calibrated in terms of membrane potential using long-lasting
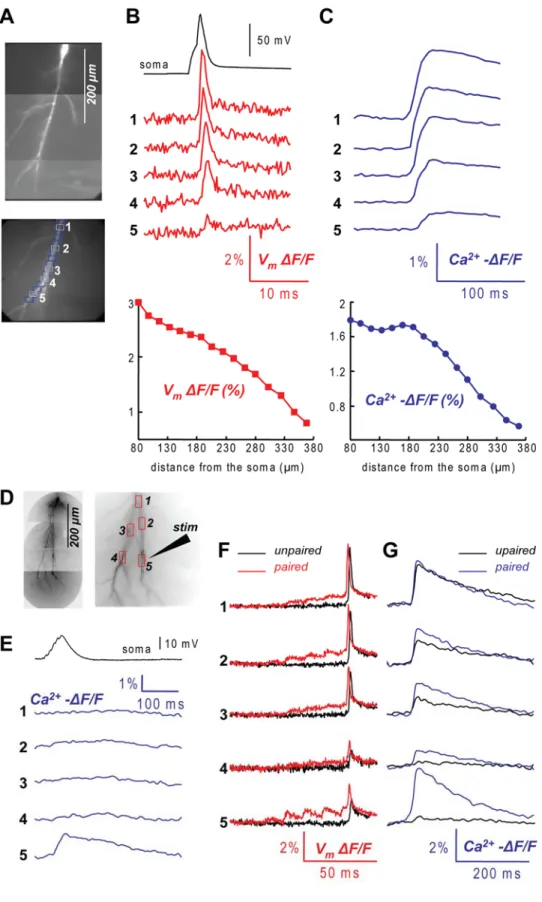
hyperpolarising pulses that have approximately the same amplitude throughout the dendritic arbor (Stuart and Häusser, 1994; Roth and Hausser, 2001). A standard calibration procedure is illustrated in Fig. 5. Fig.5(A) shows that the optical signal corresponding to 11.5 mV hyperpolarisation evoked in the soma is similar in different regions of the dendritic tree. The steady-state hyperpolarising pulse can be recorded at low acquisition rate (typically 125 frames/s) using a moderate illumination to minimise bleaching and photo-toxicity. These recordings are used to calibrate Vm signals at the level of single pixels.
Mature Purkinje neurons are characterized by a large EPSP driven by individual climbing fibres. The EPSP spreads from the sites of origin into more distal parts of the dendritic tree. To establish the sensitivity of Vm and Ca2+
imaging from Purkinje neurons, we monitored the climbing fibre EPSP at different distances from the soma. Recordings from 4 selected locations in Fig. 5(B) illustrate the signal-to-noise ratio which can be obtained with modest averaging (9 trials for Vm signals and 4 trials for Ca2+ signals). The calibrated optical signals
indicated that the climbing fibre EPSP slightly attenuated along the dendrites but its amplitude remained at about 50 mV at 100 µm from the soma, in agreement with previous electrode recordings (Stuart and Häusser 1994). Δ[Ca2+]i signals
associated with the climbing fibre EPSP and recorded sequentially from same locations slightly increased with distance from the soma. This result is not surprising given the uneven distribution of Ca2+channels that increase with the distance from the soma (Llinas and Sugimori, 1980).
In another series of measurements we used calibrated Vm and Ca2+ signals
to analyse spatially non-uniform differences between dendritic signals associated with parallel fibre and climbing fibre activation. Fig. 5(C) shows a composite fluorescent image of a Purkinje neuron with 3 representative recording regions indicated by red boxes. The position of a stimulating electrode is shown schematically. A train of 7 parallel fibre EPSPs at 100 Hz was evoked by stimulating a bundle of presynaptic fibres near the stimulating electrode. Vm
signals (red traces) and Δ[Ca2+]
i signals (blue traces) from 3 recording regions
indicated in Fig. 4(C) are shown in Fig. 5(D). The Δ[Ca2+]i signal with a peak
amplitude of ~300 nM was strictly localised to the proximity of the stimulating electrode (location 1). The EPSP-evoked depolarisation preceding the Ca2+
signal at location 1 was ~60 mV in amplitude, markedly higher than the responses from the other two locations (<40 mV). This response was compared, in the same cell, with the depolarisation and Δ[Ca2+]i signal associated with a
train of 5 climbing fibre EPSPs at 100 Hz. As shown in Fig. 5(E), the climbing fibre stimulation protocol induced similar peak depolarisation (50-60 mV) in all three regions with a slight decline in the response during the train (black traces on the left). The membrane potential response was associated with a small
Δ[Ca2+]i transient (<100 nM) corresponding to the first EPSP (Fig. 5F, black
traces). At location 1 the peak depolarisation evoked by a train of climbing fibre EPSPs (black traces) was smaller compared to depolarisation evoked by parallel fibre activation (red traces) while at locations 2 and 3, the Vm response to
climbing fibre stimulation was clearly larger in amplitude. We further established that Δ[Ca2+]i signals associated with activation of both parallel fibres and climbing
fibres were mediated by voltage-gated Ca2+ channels. These signals were neither affected by the block of metabotropic glutamate receptors nor by the block of NMDA receptors, which are the only possible source of synaptic Ca2+ (data not shown). Thus, the remarkable regional difference between Δ[Ca2+]
i
signals evoked by parallel fibre and climbing fibre activation could be explained by differences in membrane potential responses and correlated with different short-term synaptic plasticity, (facilitation or depression) evoked by two synaptic pathways.
The comparison of both ΔVm and Δ[Ca2+]i signals between different dendritic
sites, as described above, depends on calibration of optical signals on an absolute scale. The combined Vm and Ca2+ imaging is the only approach
currently available to carry out this type of measurements.
DISCUSSION
Combining voltage and Ca2+ imaging is the only experimental approach that allows correlation of regional dendritic Vm and Ca2+ signals at multiple sites. This
report describes the advantages and limitations of the technique as applied to the dendritic tree of individual mammal neurons in brain slices using UV-excitable Ca2+ indicators. In particular, it concentrates on the type of information that can be obtained from the application of this method depending on whether or not optical signals are calibrated.
If a voltage calibration is not available, the method is limited to monitoring relative changes in Vm signals under different conditions and to the analysis of
the signal waveform which is obtained directly from the optical data. This type of measurements can provide unique and often critical information on synaptic potential and action potential signal interactions at high spatial and temporal resolution. If calibration of optical data in terms of membrane potential is possible, the amplitude of Vm signals from different dendritic regions can be
compared on an absolute scale allowing quantitative analysis of how synaptic potentials and action potentials in the dendritic tree interact to control Ca2+ signalling, synaptic plasticity and input-output function of a neuron (Djurisic et al., 2004; Canepari et al., 2007).
Similar considerations apply to the interpretation of Ca2+ signals. If high concentrations of a high affinity Ca2+ indicator are used, the amplitude and the duration of Δ[Ca2+]i under physiological conditions cannot be derived, but Ca2+
signals can be still used to characterise region specific non-linear Ca2+ responses that mediates synaptic plasticity (e.g. Koester and Sakmann, 1998; Magee and Johnston, 1997). If the endogenous Ca2+ buffering of the cell is high relative to the buffering capacity of the indicator, optical signals can be used to measure physiological Δ[Ca2+]i signals allowing the analysis of the relationship
between spatial and temporal characteristics of Δ[Ca2+]i and synaptic plasticity.
Simultaneous voltage and Ca2+ imaging
UV-excitable Fura dyes are the optimal Ca2+ probes to be combined with styryl voltage-sensitive dyes because they have minimal overlap in the excitation and emission spectra. This combination, however, prevents the true simultaneous Vm and Ca2+ recordings which would be mandatory in
measurements that depend on single trial recordings. The simultaneous Vm and
Ca2+ imaging can be achieved by using two dedicated photo-detectors together
with two fluorescent indicators with overlapping excitation spectra, but separable emission spectra. This approach, however, has reduced sensitivity compared to sequential recording because it requires several compromises including non-optimal excitation and emission wavelengths, an excess of photodynamic damage caused by continuous excitation of voltage-sensitive dye throughout the recording of longer-lasting Ca2+ signals, as well as the problem of incomplete
optical separation of the emission spectra of the 2 indicators causing cross-talk between signals (Sinha et al., 1995; Bullen and Saggau, 1998).
Present limitations for in vivo imaging
A significant step forward in the experimental approach described here would be the possibility to combine dendritic Vm and Ca2+ optical recordings in vivo. At
present, this possibility is limited, firstly by the difficulties of selective staining of individual neurons with voltage-sensitive dyes in vivo. Secondly, in vivo imaging from deep tissues with adequate spatial resolution requires non-linear optical methods (second-harmonic generation or two-photon fluorescence). The difficulties of recording fast (sub-millisecond) Vm transients with nonlinear
microscopy are considerable, precluding practical application of these techniques in physiologically relevant experiments. This was mainly because of the relatively small number of photons collected per time-point. In this situation, the high relative shot noise requires very high dye sensitivity (not currently available) to obtain detectable signals (Kuhn et al., 2004; Dombeck et al., 2005). Nevertheless, a recent improvement in the sensitivity of two-photon excitation Vm
imaging, based on optimizing several aspects of recording conditions, allowed, for the first time, recordings of action potentials in single-trial measurements from
individual nerve terminals in mouse in vivo preparation (Fisher et al., 2007). This result provides methodological foundation for optical monitoring of electrical activity in vivo that could be combined with two-photon Ca2+ imaging.
ACKNOWLEDGEMENT: This work was supported by the University of Basel
and the NIH grant RO1NS42739. We are grateful to Leslie Loew and Joe Wuskel for kindly providing voltage-sensitive dyes, and to Helene Pierre for technical help.
REFERENCES
Antic, S. (2003). Action potentials in basal and oblique dendrites of rat neocortical pyramidal neurons. J. Physiol. (Lond.) 550:35-50.
Antic, S., Major, G., and Zecevic, D. (1999). Fast optical recordings of membrane potential changes from dendrites of pyramidal neurons. J. Neurophysiol.
82:1615-1621.
Antic, S., Wuskell, J. P., Loew, L., and Zecevic, D. (2000). Functional profile of the giant metacerebral neuron of Helix aspersa: temporal and spatial dynamics of electrical activity in situ. J. Physiol. (Lond.) 527:55-69.
Antic, S., and Zecevic, D. (1995). Optical signals from neurons with internally applied voltage-sensitive dyes. J. Neurosci. 15:1392-1405.
Berger, T., Borgdorff, A., Crochet, S., Neubauer, F. B., Lefort, S., Fauvet, B., Ferezou, I., Carleton, A., Luscher, H. R., and Petersen, C. C. (2007). Combined voltage and calcium epifluorescence imaging in vitro and in vivo reveals subthreshold and suprathreshold dynamics of mouse barrel cortex. J. Neurophysiol. 97:3751-3762.
Bischofberger, J., and Jonas, P. (1997). Action potential propagation into the presynaptic dendrites of rat mitral cells. J. Physiol. (Lond.) 504:359-365. Borst , J. G., Helmchen, F., and Sakmann, B. (1995). Pre- and postsynaptic
whole-cell recordings in the medial nucleus of the trapezoid body of the rat. J. Physiol. (Lond.) 489:825-840.
Bullen, A., and Saggau, P. (1998). Indicators and optical configuration for simultaneous high-resolution recording of membrane potential and intracellular calcium using laser scanning microscopy. Pflügers Arch.
436:788–796.
Canepari, M., Auger, C., and Ogden, D. (2004). Ca2+ ion permeability and single-channel properties of the metabotropic slow EPSC of rat Purkinje neurons. J. Neurosci. 24:3563-3573.
Canepari. M., Djurisic, M., and Zecevic, D. (2007). Dendritic signals from rat hippocampal CA1 pyramidal neurons during coincident pre- and post-synaptic activity: a combined voltage- and calcium imaging study. J.
Physiol. (Lond.) 580:463-484.
Canepari, M., and Mammano, F. (1999). Imaging neuronal calcium fluorescence at high spatio-temporal resolution. J. Neurosci. Meth. 87:1-11 .
Cohen, L. B., Salzberg, B. M., Davila, H. V., Ross, W. N., Landowne, D., Waggoner, A. S., and Wang, C. H. (1974). Changes in axon fluorescence during activity: molecular probes of membrane potential. J. Membr. Biol.
19:1-36.
Coesmans, M., Weber, J. T., De Zeeuw, C. I., and Hansel, C. (2004). Bidirectional parallel fiber plasticity in the cerebellum under climbing fiber control. Neuron 44:691-700.
Djurisic, M., Antic, S., Chen, W. R., and Zecevic, D. (2004). Voltage imaging from dendrites of mitral cells: EPSP attenuation and spike trigger zones. J.
Dombeck, D. A., Sacconi, L., Blanchard-Desce, M., Webb, W. W. (2005) Optical recording of fast neuronal membrane potential transients in acute mammalian brain slices by second-harmonic generation microscopy. J.
Neurophysiol. 94:3628-3636.
Fierro, L., and Llano, I. (1996). High endogenous calcium buffering in Purkinje cells from rat cerebellar slices. J. Physiol. (Lond.) 496:617-625.
Fisher, J. A., Barchi, J. R., Welle, C. G., Kim, G. H., Kosterin, P., Obaid, A. L., Yodh, A. G., Contreras, D., Salzberg, B. M. (2000). Two-photon excitation of potentiometric probes enables optical recording of action potentials from mammalian nerve terminals in situ. J. Neurophysiol. 2008 Jan 2, ; [Epub ahead of print]
Fisher, J. A., Salzberg, B. M., and Yodh A. G. (2005). Near infrared two-photon excitation cross-sections of voltage-sensitive dyes. J. Neurosci. Meth.
148:94-102.
Fluhler, E., Burnham, V. G., and Loew, L. M. (1985). Spectra, membrane binding, and potentiometric responses of new charge shift probes. Biochemistry
24:5749-5755.
Frick, A., Magee, J., and Johnston, D. (2004). LTP is accompanied by an enhanced local excitability of pyramidal neuron dendrites. Nat. Neurosci.
7:126-135.
Gasparini, S., Losonczy, A., Chen, X., and Johnston, D., and Magee, J. C. (2007). Associative pairing enhances action potential back-propagation in radial oblique branches of CA1 pyramidal neurons. J. Physiol. (Lond.)
580:787-800.
Grinvald, A., Salzberg, B. M., Lev-Ram V., and Hildesheim, R. (1987). Optical recording of synaptic potentials from processes of single neurons using intracellular potentiometric dyes. Biophys. J. 51:643-651.
Helmchen, F., Imoto, K., and Sakmann, B. (1996). Ca2+ buffering and action potential-evoked Ca2+ signaling in dendrites of pyramidal neurons.
Biophys. J. 70:1069-1081.
Hyrc, K. L., Bownik, J. M., and Goldberg, M.P. (2000). Ionic selectivity of low-affinity ratiometric calcium indicators: mag-Fura-2, Fura-2FF and BTC.
Cell Calcium 27:75-86.
Jackson, M. B., and Redman, S. J. (2003). Calcium Dynamics, Buffering, and Buffer Saturation in the Boutons of Dentate Granule-Cell Axons in the Hilus. J. Neurosci. 23:1612-1621.
Kaiser, K. M., Zilberter, Y., and Sakmann, B. (2001). Back-propagating action potentials mediate calcium signalling in dendrites of bitufted interneurons in layer 2/3 of rat somatosensory cortex. J. Physiol. (Lond.) 535:17-31. Kuhn, B., Fromherz, P., Denk, W. (2004). High sensitivity of Stark-shift
voltage-sensing dyes by one- or two-photon excitation near the red spectral edge.
Biophys. J. 87:631639.
Kremer, S. G., Zeng, W., and Skorecki, K. L. (1992). Simultaneous fluorescence measurement of calcium and membrane potential responses to
Koester, H. J., and Sakmann, B. (1998). Calcium dynamics in single spines during coincident pre- and postsynaptic activity depend on relative timing of back-propagating action potentials and subthresh old excitatory postsynaptic potentials. Proc. Natl. Acad. Sci. USA 95:9596–9601.
Jaffe, D. B., Johnston, D., Lasser-Ross, N., Lisman, J. E., Miyakawa, H., and Ross, W. N. (1992). The spread of Na+ spikes determines the pattern of dendritic Ca2+ entry into hippocampal neurons. Nature 357:244-246.
Lips, M. B., and Keller, B. U. (1998). Endogenous calcium buffering in motoneurones of the nucleus hypoglossus from mouse. J. Physiol. (Lond.)
511:105-117.
Llinas, R., and Sugimori, M. (1980). Electrophysiological properties of in vitro Purkinje cell dendrites in mammalian cerebellar slices. J. Physiol. (Lond.)
305:197-213.
Loew, L. M., Cohen, L. B., Dix, J., Fluhler, E. N., Montana, V., Salama, G., and Wu, J. Y. (1992). A naphthyl analog of the aminostyryl pyridinium class of potentiometric membrane dyes shows consistent sensitivity in a variety of tissue, cell, and model membrane preparations. J. Membr. Biol. 130:1-10. Loew, L. M., and Simpson, L. L. Charge-shift probes of membrane potential: a
probable electrochromic mechanism for p-aminostyrylpyridinium probes on a hemispherical lipid bilayer. Biophys. J. 34:353-365.
Magee, J. C., and Johnston, D. (1997). A synaptically controlled, associative signal for Hebbian plasticity in hippocampal neurons. Science 275:209-213.
Martinez-Zaguilan, R., Martinez, G. M., Lattanzio, F., and Gillies, R. J. (1991). Simultaneous measurement of intracellular pH and Ca2+ using the fluorescence of SNARF-1 and fura-2. Am. J. Physiol. 260:297-307.
Milojkovic, B. A, Radojicic, M. S., and Antic SD. (2005). A strict correlation between dendritic and somatic plateau depolarizations in the rat prefrontal cortex pyramidal neurons. J. Neurosci. 25:3940-3951.
Milojkovic, B. A., Zhou, W. L., and Antic, S. D. (2007). Voltage and calcium transients in basal dendrites of the rat prefrontal cortex. J. Physiol. (Lond.)
585:447-468.
Naraghi, M. (1997). T-jump study of calcium binding kinetics of calcium chelators.
Cell Calcium 22:255-268.
Neher, E. (1995). The use of fura-2 for estimating Ca buffers and Ca fluxes.
Neuropharmacology 34:1423-1442.
Nuriya, M., Jiang, J., Nemet, B., Eisenthal, K. B., and Yuste R. (2006). Imaging membrane potential in dendritic spines. Proc. Natl. Acad. Sci. U S A
103:786-790.
Nowycky, M. C., and Pinter, M. J. (1993). Time courses of calcium and calcium-bound buffers following calcium influx in a model cell. Biophys. J. 64:77– 91.
Ogden D., and Capiod, T. (1997). regulation of Ca2+ release by InsP3 in single guinea pig hepatocytes and rat Purkinje neurons. J. Gen. Physiol.
109:741-756.
in motoneurones of the mouse spinal cord. J. Physiol. (Lond.) 520:485-502.
Palmer, L. M., and Stuart, G. J. (2006) Site of action potential initiation in layer 5 pyramidal neurons. J. Neurosci. 26:1854-1863.
Roth A., and Häusser, M. (2001). Compartmental models of rat cerebellar Purkinje cells based on simultaneous somatic and dendritic patch-clamp recordings. J. Physiol. (Lond.) 535:445-472.
Sacconi, L., Dombeck, D. A., and Webb, W. W. (2006). Overcoming photodamage in second-harmonic generation microscopy: real-time optical recording of neuronal action potentials. Proc. Natl. Acad. Sci. USA
103:3124-3129.
Sabatini, B. S., Oertner, T. G., and Svoboda, K. (2002). The life cycle of Ca2+ ions in dendritic spines. Neuron 33:439–452.
Schneggenburger, R., Meyer, A. C., and Neher, E. (1999). Released fraction and total size of a pool of immediately available transmitter quanta at a calyx synapse. Neuron 23:399-409.
Sinha, S. R., Patel, S. S., and Saggau, P. (1995). Simultaneous optical recording of evoked and spontaneous transients of membrane potential and intracellular calcium concentration with high spatio-temporal resolution. J.
Neurosci. Meth. 60:49-46.
Sinha, S. R., and Saggau, P. (1999). Simultaneous optical recording of membrane potential and intracellular calcium from brain slices. Methods
18:204-214.
Spruston, N., Schiller Y, Stuart G, Sakmann B. (1995). Activity-dependent action potential invasion and calcium influx into hippocampal CA1 dendrites.
Science 268:297-300.
Stuart G., and Häusser, M. (1994). Initiation and spread of sodium action potentials in cerebellar Purkije neurons. Neuron 13:703-712.
Vanselow, B. K., and Keller, B. U. (2000). Calcium dynamics and buffering in oculomotor neurones from mouse that are particularly resistant during amyotrophic lateral sclerosis (ALS)-related motoneurone disease. J.
Physiol. (Lond.) 525:433-445.
Wang J., Yeckel, M. F., Johnston, D., and Zucker, R. S. (2001). Photolysis of postsynaptic caged Ca2+ can potentiate and depress mossy fiber synaptic responses in rat hippocampal CA3 pyramidal neurons. J. Neurophysiol.
91:1596-1607.
Zecevic, D. (1996). Multiple spike-initiation zones in single neurons revealed by voltage-sensitive dyes. Nature 381:322-325.
Zhou, W-L., Yan, P., Wuskell, J. P., Loew, L. M., and Antic, S. D. (2007). Intracellular long-wavelength voltage-sensitive dyes for studying the dynamics of action potentials in axons and thin dendrites. J. Neurosci.
Fig. 2. Pharmacological effects and
photodynamic damage of JPW-1114 in cerebellar Purkinje neurons. (A) Electrode recordings of the AP from the soma at the beginning of the staining (thin-black trace), after re-patch (gray trace) and after 25 150 ms optical recordings separated by 30 s (thick-black trace). Graph: summary data for spike amplitude, voltage threshold, and width at half-height after staining (gray bars) and optical recordings (white bars) expressed as percent changes from control values (N = 4 cells). (B) Top left: a composite fluorescence image of a Purkinje neuron. Top right: fluorescence image of a dendritic region in the recording position. Bottom left: electrically recorded somatic climbing fibre EPSP and associated Δ[Ca2+]
i
signal from the dendrite shown above at the beginning of the staining (thin-black trace), after re-patch (gray trace) and after 20 150 ms optical recordings separated by 30 s (thick-black trace);
Δ[Ca2+]i signal estimated by averaging
fluorescence over the entire dendritic area of the top-right image. Bottom right: summary data for the EPSP and
Δ[Ca2+]i amplitude after staining (gray
bars) and optical recordings (white bars) expressed as percent changes from control values (N = 5 cells).
Fig. 1. Schematic of the imaging apparatus. Imaging setup for sequential recording of Vm and Ca2+
signals in epi-fluorescence mode by switching between two filter cubes. Filter set for voltage-sensitive dye (JPW): ex1 = 525±25 nm, dic1 > 570 nm and em1 > 610 nm. Filter set for Ca2+ indicator (Fura): ex2 = 387±6 nm, dic1 > 470 nm and em1 = 510±42 nm.
Fig. 3. Staining of the cells and
recording procedures. (A) A Purkinje neuron loading with a voltage sensitive dye (JPW, left column) and a Ca2+ indicator (Fura, right column).
The internal solution in the tip of the patch electrode did not contain voltage sensitive dye. Images were taken at 5, 15 and 25 minutes after whole-cell configuration and 1 hour after the patch electrode was removed. (B) Vm and Ca2+ fractional
changes of fluorescence related to a climbing fibre EPSP recorded after the dye equilibration period from the locations 1-3 reported in the fluorescence images of the dendritic tree on the left. Somatic recording of the climbing fibre EPSP is the upper trace. Four trials averaged to improve the signal-to-noise ratio. (C) Individual recordings of Vm (left) and Ca2+ (right)
fractional changes of fluorescence (gray traces) related to a climbing fibre EPSP. Superimposed black traces are the averages of the four trials.
Fig. 4. Combined voltage and Ca2+ imaging from CA1 hippocampal pyramidal neurons. (A) A
composite fluorescence image of a hippocampal CA1 pyramidal neuron (top) and a fluorescence image of an apical dendrite of the same cell in recording position (bottom); 16 regions at different
distance from the soma marked by blue rectangles. (B) Vm signals (ΔF/F) from locations 1-5
associated with a back-propagating action potential. Somatic recording of the action potential is the upper black trace A plot of signal amplitude vs distance from the soma shown below. (C) Ca2+ signal (-ΔF/F) from locations 1-5 associated with a back-propagating action potential. A plot of signal amplitude vs distance from the soma shown below. (D) A composite fluorescence image of another CA1 pyramidal neuron (left) and fluorescence image of the dendritic tree of the same cell in recording position (right). An extracellular stimulating electrode shown schematically. Five recording locations marked by red rectangles. (E) Ca2+ signals from locations 1-5 associated with a train of 5 EPSPs at 100 Hz. Note that the Ca2+ transient was localized to region 5. Somatic
recording of the EPSPs is the upper black trace. (F) Vm signals from locations 1-5 associated with
a propagating action potential (black traces) and with the pairing of 5 EPSPs with a back-propagating action potential (red traces). (G) Ca2+ signals from locations 1-5 associated with a back-propagating action potential (black traces) and with the pairing protocol (blue traces). Vm
Fig. 5. Combined voltage and Ca2+ imaging from cerebellar Purkinje neurons. (A) Calibration of
Vm signals. A composite fluorescence image of a Purkinje neuron (left) and a fluorescence
images of the dendritic tree in recording position with 3 recording locations marked by red rectangles (top). The color-coded representation of the optical signal corresponding to 11.5 mV prolonged somatic hyperpolarisation (top right). Electrical recording from the soma (black trace) and optical recordings from 3 marked locations (red traces) shown below. (B) A composite fluorescence image of another Purkinje neuron (top left) and a region on the dendritic tree in recording position with 4 recording locations marked by red rectangles (top right). Vm signals
(ΔVm, red traces – average of 9 recordings) and Ca2+ signals (Δ[Ca2+]i blue traces – average of 4
recordings) from locations 1-4 associated with a climbing fibre EPSP (bottom). Somatic recording is the upper black trace. (C) A composite fluorescence image of a Purkinje neuron (left) and an image of a dendritic region in recording position with 3 locations marked by red rectangles; the
position of the dendritic region in the composite image marked by a blue rectangle. Two stimulating electrodes for the parallel fibres and the climbing fibre depicted schematically. (D) Vm
signals (red traces – average of 4 recordings) and Ca2+ signals (blue traces – average of 4 recordings) associated with a train of 7 parallel fibre EPSPs at 100 Hz. Localised Ca2+ signal at location 1 corresponds spatially to the largest depolarisation. Somatic recording is the upper black trace. (E) Vm signals from locations 1-3 associated with a train of 5 climbing fibre EPSPs
(black traces) and with a train of 7 parallel fibre EPSPs (red traces). (F) Ca2+ signals from locations 1-3 associated with a train of 5 climbing fibre EPSPs (black traces) and with a train of 7 parallel fibre EPSPs (blue traces). Vm signals obtained at frame rate of 2 kHz. Ca2+ signals
obtained at frame rate of 500 Hz.
Dye Kd (µM) Kdye(300µM) Kdye(1mM)
fura-2 0.224 (a) ~1300 ~4500 fura-5F 0.4 (a) ~750 ~2500 bis-fura-2 0.525 (a) ~570 ~1900 fura-4F 0.77 (a) ~390 ~1300 fura-6F 5.3 (a) ~57 ~190 fura-FF 10 (b) ~30 ~100 Mag-fura-2 25 (c) - 40 (d) ~7.5-12 ~25-40
Table I. Dissociation constants and buffering capacities of Fura dyes. A list of commercially
available Fura dyes with dissociation constant (Kd) and buffering capacities (Kdye) at the two
concentrations of 300 µM and 1 mM. References: (a) Molecular Probes handbook (for fura-2 and
bis-fura-2 at 1 mM Mg2+); (b) Schneggenburger et al.,1999; (c) Hyrc et al., 2000; (d) Naraghi, 1997.
CNS Region neuron type site Kcell
Hippocampus CA1 pyramidal spine ~20 (a) Hippocampus DG granule axon ~20 (b) MNTB Calyx Held axon ~40 (c)
Hypoglossum motoneuron soma ~41 (d) Spinal Cord motoneuron soma ~50 (e) Neocortex L5 pyramidal dendr. ~130 (f) Hippocampus CA1 pyramidal dendr. ~180 (f)
OM nucleus motoneuron soma 265 (g) Neocortex L2/3 bitufted i.n. dendr. ~285 (h) Hippocampus CA3 pyramidal dendr. ~900 (i) Cerebellum Purkinje dendr. ~2000 (j)
Table II. Endogenous buffering capacities of some neurons. Estimated endogenous buffering
capacities (Kcell) of some rodent neurons. References: (a) Sabatini et al., 2002; (b) Jackson and
Redman, 2003; (c) Borst et al., 1995; (d) Lips and Keller, 1998; (e) Palecek et al., 1999; (f)
Helmchen et al., 1996; (g) Vanselow and Keller, 2000; (h) Kaiser et al., 2001; (i) Wang et al., 2001;