HAL Id: inserm-00598424
https://www.hal.inserm.fr/inserm-00598424
Submitted on 11 May 2012
HAL is a multi-disciplinary open access archive for the deposit and dissemination of sci-entific research documents, whether they are pub-lished or not. The documents may come from teaching and research institutions in France or abroad, or from public or private research centers.
L’archive ouverte pluridisciplinaire HAL, est destinée au dépôt et à la diffusion de documents scientifiques de niveau recherche, publiés ou non, émanant des établissements d’enseignement et de recherche français ou étrangers, des laboratoires publics ou privés.
Does cognitive reserve shape cognitive decline?
Archana Singh-Manoux, Michael Marmot, Maria Glymour, Séverine Sabia,
Mika Kivimäki, Aline Dugravot
To cite this version:
Archana Singh-Manoux, Michael Marmot, Maria Glymour, Séverine Sabia, Mika Kivimäki, et al.. Does cognitive reserve shape cognitive decline?: Cognitive reserve. Annals of Neurology, Wiley, 2011, 70 (2), pp.296-304. �10.1002/ana.22391�. �inserm-00598424�
Does cognitive reserve shape cognitive decline? Archana Singh-Manoux, PhD 1,2,3 Michael G Marmot, MD, PhD 2 Maria Glymour, SD 4 Séverine Sabia, PhD 1,2 Mika Kivimäki, PhD 2 Aline Dugravot, MSc 1
* Corresponding author & address:
1
INSERM, U1018
Centre for Research in Epidemiology and Population Health Hôpital Paul Brousse, Bât 15/16
16 Avenue Paul Vaillant Couturier 94807 VILLEJUIF CEDEX, France
Telephone: +33 (0)1 77 74 74 10 Fax: +33 (0)1 77 74 74 03 Email: [email protected]
2
Department of Epidemiology and Public Health University College London, UK
3
Centre de Gérontologie, Hôpital Ste Périne, AP-HP, France
4
Department of Society, Human Development, and Health, Harvard School of Public Health Running head: Cognitive reserve
Word count: abstract: 243; Text: 3527 Number of tables: 4; Number of figures: 1
ACKNOWLEDGEMENTS
ASM is supported by a “European Young Investigator Award” from the European Science
Foundation and the National Institute on Aging, NIH, USA (R01AG013196; R01AG034454). MK by the Academy of Finland, the BUPA Foundation, the National Heart, Lung, and Blood Institute, USA (R01HL036310) and the National Institute on Aging, NIH, USA
(R01AG034454) . The Whitehall II study has been supported by grants from the Medical Research Council; British Heart Foundation; Health and Safety Executive; Department of Health; and the National Institutes of Health, USA.
We thank all of the participating civil service departments and their welfare, personnel, and establishment officers; the British Occupational Health and Safety Agency; the British Council of Civil Service Unions; all participating civil servants in the Whitehall II study; and all members of the Whitehall II study team. The Whitehall II Study team comprises research scientists, statisticians, study coordinators, nurses, data managers, administrative assistants and data entry staff, who make the study possible.
Disclosure Statement
Abstract
Objectives: Cognitive reserve is associated with a lower risk of dementia but the extent to which it shapes cognitive aging trajectories remains unclear. Our objective is to examine the impact of three markers of reserve from different points in the lifecourse on cognitive function and decline in late adulthood.
Methods: Data are from 5234 men and 2220 women, mean age 56 years (standard
deviation=6) at baseline, from the Whitehall II cohort study. Memory, reasoning, vocabulary, phonemic and semantic fluency were assessed three times over 10 years. Linear mixed
models were used to assess the association between markers of reserve (height, education, and occupation) and cognitive decline, using the 5 cognitive tests and a global cognitive score composed of these tests.
Results: All three reserve measures were associated with baseline cognitive function, with strongest associations with occupation and the weakest with height. All cognitive functions except vocabulary declined over the 10 year follow-up period. On the global cognitive test, there was greater decline in the high occupation group (0.27; 95% confidence interval (CI): -0.28, -0.26) compared to the intermediate (-0.23; 95% CI: -0.25, -0.22) and low groups (-0.21; 95% CI: -0.24, -0.19); p=0.001. The decline in reserve groups defined by education (p=0.82) and height (p=0.55) was similar.
Interpretation: Cognitive performance over the adult lifecourse was remarkably higher in the high reserve groups. However, rate of cognitive decline did not differ between reserve groups except occupation where there was some evidence of greater decline in the high occupation group.
INTRODUCTION
There is considerable inter-individual variability in cognitive aging, some individuals or groups of individuals experience slower rates of cognitive decline than others.1,2 This
variability is also evident in the inconsistent relationship between the clinical and the
pathological severity of dementia.3 Hypothesized explanations for these discrepancies include functional reserve capacity, including neuroplasticity, biological variation between
individuals and incomplete understanding of disease mechanisms.3 Autopsies of individuals with „normal‟ brain aging, where an older person‟s cognition remains intact, reveal almost as many neurofibrillary tangles and amyloid plaques as seen in patients with Alzheimer‟s disease.4 These findings have led to the elaboration of the concept of cognitive reserve,
defined as the capacity that creates a delay in time between pathology and clinical expression of dementia.5
Anatomical features of the brain are likely to influence reserve,5,6 but complex or enriched environments may also be important as demonstrated in animal studies.7 Education and other markers of socioeconomic circumstances have been shown to be associated with a lower risk of dementia,8-14 and reduced clinical manifestation of neuropathological changes.15 Although most of the research on cognitive reserve focuses on dementia or cognitive decline immediately pre- or post-diagnosis, the concept of cognitive reserve has wider implications for cognitive aging.5 It is possible that greater cognitive reserve is associated with both high function and lower rates of cognitive decline in adulthood. Our objective is to examine the extent to which cognitive reserve shapes adult cognitive aging trajectories, starting in midlife. We use three markers of reserve: height, an anthropometric measure of development and seen to be a measure of cognitive reserve,16 alongside education and occupation.
MATERIALS AND METHODS
Study Population
The target population for the Whitehall II study was all London-based office staff, aged 35–55 years, working in 20 civil service departments. 17 At study inception (Phase 1), 1985-1988, 10,308 participants (67% men) underwent a clinical examination and completed a self-administered questionnaire. Cognitive testing was introduced to the full cohort at Phase 5 (1997-1999) of the study and repeated at Phases 7 (2002-2004) and 9 (2007-2009). All participants provided written consent and the University College London ethics committee (UCLH Committee Alpha, #85/0938) approved this study.
Cognitive function
The cognitive test battery, administered at three clinical examinations over 10 years, consists of five standard tasks, described below, chosen to provide a comprehensive assessment of cognitive function.
The Alice Heim 4-I (AH4-I) is composed of a series of 65 verbal and mathematical reasoning items of increasing difficulty.18 It tests inductive reasoning, measuring the ability to identify patterns and infer principles and rules. Participants had 10 minutes to do this section.
Short-term verbal memory was assessed with a 20-word free recall test. Participants were presented a list of 20 one or two syllable words at two second intervals and were then asked to recall in writing as many of the words in any order and had two minutes to do so.
We used two measures of verbal fluency: phonemic and semantic19. Phonemic fluency was assessed via “S” words and semantic fluency via “animal” words. Subjects were asked to
recall in writing as many words beginning with “S” and as many animal names as they could. One minute was allowed for each test.
Vocabulary was assessed using the Mill Hill Vocabulary test,20 used in its multiple-choice format, consisting of a list of 33 stimulus words ordered by increasing difficulty and six response choices.
Global cognitive score was created using all five tests described above by first standardizing the raw scores on each test to z-scores (mean=0; standard deviation (SD)=1) using the baseline mean and standard deviation value in the entire cohort for each test. Then the z scores were averaged to yield the global cognitive score. Previous research on cognitive ageing has used global scores of this description in order to minimize problems due to
measurement error.21,22
Cognitive reserve
We used three markers: occupational position, education and height. Occupational position was assessed by the British Civil Service grade of employment at the baseline of this study (Phase 5 of the Whitehall II study), concurrent to the first assessment of cognition. It is a three level variable representing high (administrative grades), intermediate (professional or executive grades) and low (clerical or support grades) position. This measure is a
comprehensive marker of socioeconomic circumstances and is related to salary, social status and level of responsibility at work.17 Education was measured as the highest qualification on leaving full-time education and categorised as lower secondary school or less, higher
secondary school, university or higher degree. Height was measured using a stadiometer with the participant standing completely erect with the head in the Frankfort plane. The mean height in men was 177 cm leading us to use 175-179 cm as the middle category and height above or below this range to constitute the other two categories. In women, the mean height was 163 cm, making the 160-164 cm group the middle category.
Statistical Analysis
All three markers of reserve, occupation, education and height, comprised three categories: high, intermediate and low. We first examined the mean cognitive scores at baseline as a function of reserve, using analysis of variance. These analyses were stratified by sex as the interaction term between sex and markers of cognitive reserve (all p<0.03 except that between occupation and sex for memory test, p=0.74, and phonemic fluency, p=0.17) suggested gender differences in the association between reserve markers and cognitive function.
Linear mixed models23 were then used to estimate the association between the markers of reserve and decline in the 5 cognitive tests. Mixed models use all available data over the follow-up, take into account the fact that repeated measures on the same individual are correlated with each other, and can handle missing data. In these analyses both the intercept and the slope were fitted as random effects, allowing them to vary between individuals. The mixed models were used to estimate 10 year decline and the associated 95% confidence interval (CI) in each measure of cognitive function using three cognitive assessments over ten years. We first examined gender differences in cognitive decline in models that included terms for time (here age centred at age 60 and divided by 10 for the coefficients to yield effects of decline over 10 years), age at baseline to adjust for cohort effects, gender, an
interaction term between gender and age at baseline, an interaction term between gender, time and the marker of cognitive reserve plus all lower order interaction terms contained within this triple interaction. The triple interaction term suggested that the association between cognitive reserve and cognitive decline was similar in men and women (p values between 0.15 and 0.86 except for memory test with height, p<0.001 and semantic fluency with education, p<0.02), leading us to combine men and women in the analysis for cognitive decline.
We then examined the association between each marker of reserve and cognitive decline using 3 assessments of cognitive function over the 10 year follow-up. The mixed models for these analyses included termsfor time, age at baseline, one marker of reserve at a time (occupation, education or height) specified as a categorical variable, sex, an interaction term between sex and the marker of reserve, an interaction term between cognitive reserve and age at baseline, and finally an interaction term between the marker of reserve and time. This last interaction term is the key objective of our paper and provides a test for the null hypothesis that there were no differences in cognitive decline between the low, intermediate and high reserve groups. It also allows calculation of the estimate of 10-year decline in the high, intermediate and low reserve groups. All the analyses were carried out using Proc Mixed procedure using the SAS software version 9.1 (SAS Institute Inc., Cary, NC, USA).
RESULTS
The baseline (1997-1999) of this study was Phase 5 of the Whitehall II study that started in 1985 on 10,308 individuals. Our analysis was based on 7,454 individuals (5,234 men and 2,220 women) with data on at least one of the three repeat measurements of cognition; 62.0% of these individuals had complete data at all three waves and 22.8% on two waves. Restricting the analyses to those with complete data or data at a minimum of two phases (N between 6310 and 6335, depending on the cognitive test) did not change the conclusions of the paper leading us to present analyses on 7,454 individuals. Compared to the baseline population of the Whitehall II study, N=10,308, the analysis reported in this paper was based on individuals who were younger (55.3 years vs.54.1 years at the start of the cognitive data collection, p<0.001), more educated (29.5% vs. 20.5% with a university degree, p<0.001) and more likely to be from the higher occupational position (42.1% vs. 23.6% at the start of the cognitive data collection, p<0.001). The three measures of cognitive reserve were modestly
correlated with each other: the Spearman‟ rank correlation coefficient of height with education and occupation was 0.06 (p<0.0001) and 0.12 (p<0.001) respectively and that between education with occupation was 0.45 (p<0.001).
Of the 7,454 individuals in the analysis, 98 died between the first two waves of
cognitive data collection and a further 213 died between the second and the third wave. Those who died did not have lower values on the markers of reserve (p=0.19 for occupational position, p=0.21 for education and p=0.09 for height) but had poorer cognitive scores (p<0.01 on all tests). Excluding these individuals from the analysis did not much modify the observed associations leading us to retain data before death from these individuals in the analysis.
Observed data over the three repeat assessments on all five tests are shown in Figure 1A to E. These data are stratified by occupational position and participants have been grouped in 5-year age groups using age at baseline. In the analysis there was some evidence of
accelerated decline at older ages for all tests except vocabulary (results not shown but available from authors). However, in order to simplify the presentation of the results of the main analysis we combined all age-groups and adjusted for age at baseline.
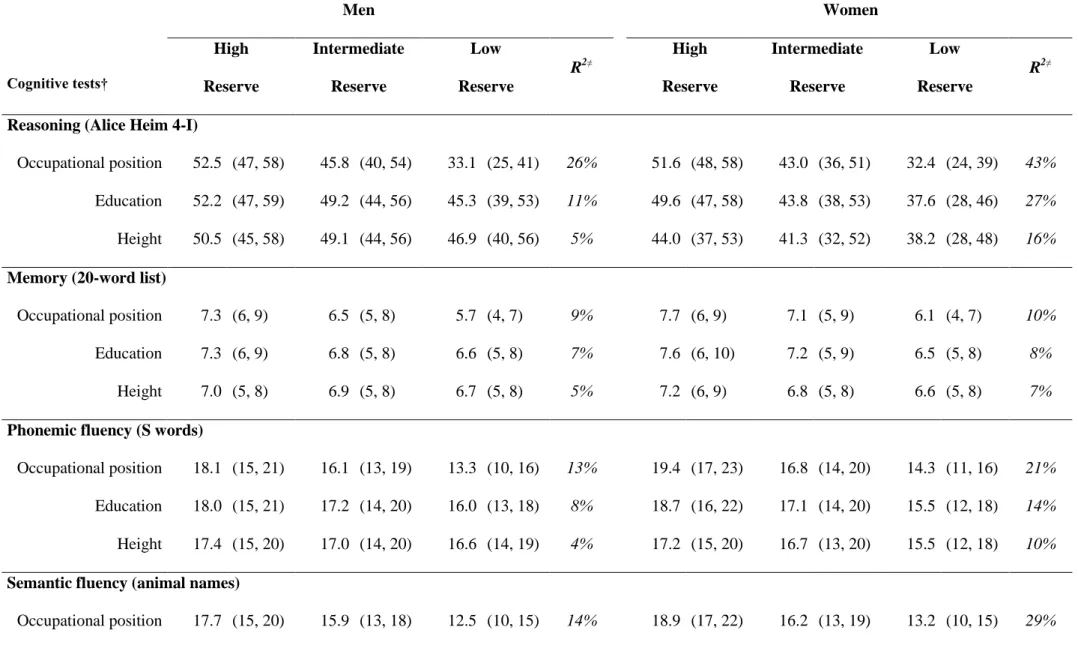
Table 1 presents mean cognitive scores (and those at the 25th and 75th percentile) at baseline as a function of the reserve measures in men and women. The interaction term between sex and the markers of cognitive reserve suggested gender differences in the association with cognitive tests; R2 estimates confirmed the stronger association between reserve and cognitive function in women. There was a finely graded association between all three markers of reserve and the five measures of cognitive function in both men and women (all p<0.01). The scores at the 25th and 75th percentile in each reserve group show little evidence of ceiling/floor effects in the tests. The estimates of variance explained (R2) suggest that of the three markers of reserve, occupation was most, and height the least strongly associated with cognitive function. The association between markers of reserve and cognition
was weakest for the measure of memory (R2 between 5 and 10%) and strongest for the measure of reasoning (R2 between 5 and 43%).
The mean age and sex adjusted decline in reasoning (AH4-I) was estimated at -3.49 (95% CI: 3.64, 3.35), in memory at 0.65 (95% CI: 0.72, 0.59), at 1.57 (95% CI: 1.66, -1.49) in phonemic fluency and at -1.32 (95% CI: -1.40, -1.24) in semantic fluency. There was some evidence of an improvement in vocabulary scores (0.09, 95% CI: 0.04, 0.15).
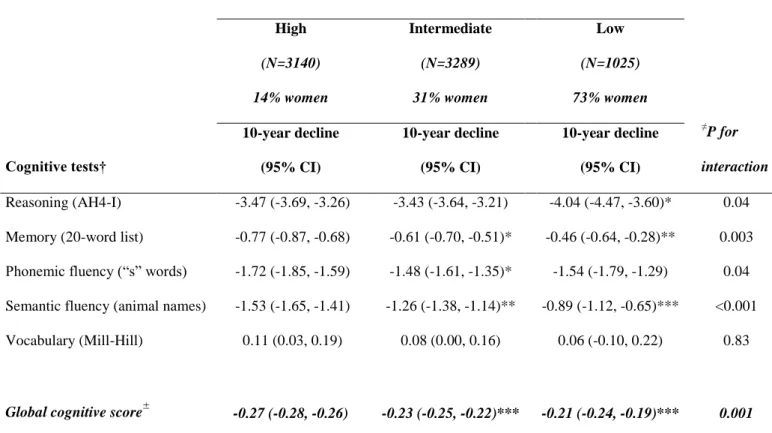
Table 2 presents estimates of cognitive decline over 10 years as a function of occupational position. Decline in all functions except vocabulary was evident in all three occupational groups. There was greater decline in reasoning (AH4-I) in the lower
occupational group (p=0.04). However, on tests of memory (p=0.003), phonemic (p=0.04) and semantic fluency (p<0.001) the decline was faster in the higher occupation group. On the global cognitive score, compared to the high occupational group (0.27 (95% CI: 0.28, -0.26), there was less decline in the intermediate (-0.23 (95% CI: -0.25, -0.22) and low (-0.21 (95% CI: -0.24, -0.19) occupational groups, both p<0.001.
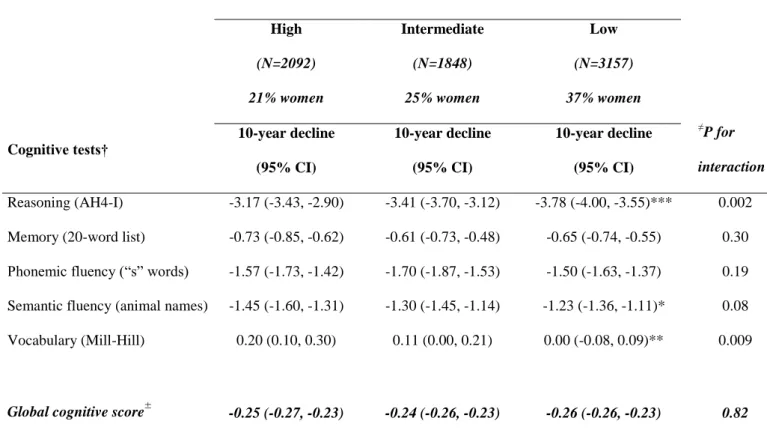
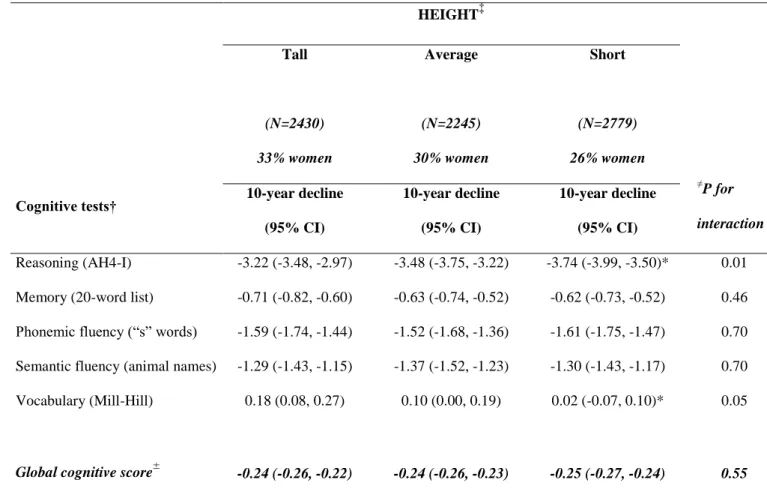
The analysis using education as the marker of cognitive reserve (Table 3) showed greater decline in reasoning (AH4-I) in the lower education group (p=0.002) but similar decline in all education groups for memory (p=0.30), phonemic fluency (p=0.19),semantic fluency (p=0.08) and global cognitive score (p=0.82). Vocabulary improved over the testing period more in the higher than the lower education group (p=0.009). Table 4 shows results for cognitive decline in analyses stratified by height. The results were similar to that for
education in that the high reserve group (taller than average) had slower decline in reasoning (AH4-I), p=0.01, and vocabulary (p=0.05) although the global cognitive score suggested similar declines in all height groups (p=0.55).
DISCUSSION
Our results showed all three markers of cognitive reserve used in this study to be
strongly associated with cognitive function scores but there was little evidence of slower rates of decline over a 10-year period in the higher reserve group. At the baseline cognitive
assessment, occupation was most strongly associated with cognition, explaining between 13 and 26% of the variance in test scores in men and between 10 and 43% in women. The impact of occupation was such that men aged 75-79 years in the high occupational group had a higher mean reasoning score (45.1, SD=9.2) than men aged 45-49 years (33.3, SD=10.9) from the low occupational group. Of the three measures, height had the weakest association with the measures of cognitive function at baseline.
Clinical studies, often on small number of subjects, assume that cognitive function declines only in the period immediately prior to the diagnosis of dementia.24,25 However, there is now enough evidence from large scale studies to suggest a much longer period of cognitive decline. The Framingham data show lower cognitive scores in those with dementia up to 10 years before the diagnosis of dementia.26 The French PAQUID study, based on adults aged 65 or older at baseline, shows the trajectory of cognitive decline in those who develop dementia to change course 12 years before diagnosis.27 Data from the 1921 Scottish Birth Cohort have shown childhood cognitive scores to also predict late-life dementia.28 The case for
continuities in aging, in that prior changes shape later life changes, makes it meaningful to examine age-related cognitive decline earlier than that in studies on dementia.
The extent to which cognitive reserve influences cognitive decline has been the subject of much research.29-32 However, the conclusion drawn from previous two-wave studies has been shown to be problematic,33 as adjustment for the baseline measure of cognitive function in regression models of change biases results. Longitudinal analyses, using education and income in the AHEAD study34 (mean age of participants 77 years) and education alone in the
Cambridge City over 75s Cohort Study35 suggest no consistent impact of reserve on the rate of decline in cognitive function. This is in agreement with studies on younger age-groups; an investigation based on adults aged 60-64 years at baseline showed education and measures of brain volume not to influence cognitive decline.36 A similar null finding was reported in a study of adults aged 49-81 years at baseline where education had no effect on the rate of cognitive decline.37
In our 10-year follow-up of individuals, whose mean age at baseline was 56 years (SD = 6 years), age-related decline was evident for all cognitive functions except vocabulary. The results for vocabulary were expected as some cognitive abilities, verbal knowledge for example, are known to be preserved into old age.1,38 Analyses based on the global cognitive score, constructed as in previous studies,21,22 may be less affected by measurement error than those based on individual cognitive tests. In our study, the results using this summary measure suggest faster decline in the high reserve group defined by occupation but similar decline in reserve groups defined by education and height.
The results for occupation, showing greater decline in the high reserve group, mirror findings from the AHEAD study34 where greater decline in memory and verbal fluency was observed in the high reserve group, defined by income but not education. In our data, of the three measures of reserve the association with cognitive tests was strongest with occupation. It is possible that faster decline in the high occupation group is the result of statistical
phenomena such as regression to the mean.39 However, the persistence of this effect with the global cognitive score in the present study suggests that regression to the mean might not completely explain the finding. An alternative explanation is that cognitive gains associated with work content in different occupations are transient, explaining the faster decline in the higher occupational group. However, it is important not to over interpret this finding as for all three measures of reserve, the decline in reasoning (AH4-I) was fastest in the lowest reserve
group. The overall conclusion from our results is that cognitive reserve does not much alter the rate of cognitive decline.
There are two possible ways in which cognitive reserve could impact the risk of cognitive impairments in old age: by their impact on peak adult cognitive function and by influencing the trajectory of cognitive decline itself (the slope of cognitive change with age). Either of these effects would lead to poor cognitive status, and perhaps greater risk of
dementia, in old age among those with low cognitive reserve. Much research on cognitive reserve focuses on its role in the interface between brain pathology and function among those with dementia.5,15,40 A simple formulation of the reserve hypothesis for aging is that greater cognitive reserve allows individuals to cope better or more successfully with aging. A
distinction has been made between the passive (threshold) and the active model of reserve.5,16
The passive model assumes that functioning below a certain threshold will lead to the diagnosis of dementia, greater reserve is protective simply by creating distance from the cut-off threshold of functioning for dementia.41 The active model promotes the view that greater
efficiency and compensatory mechanisms in those with great reserve will lead to better aging outcomes.5
Our results support the passive models of reserve: individuals with high reserve must experience substantial cognitive deterioration before they will reach any threshold of
impairment. Although we do not find evidence that reserve slows rate of cognitive change, the difference in cognitive function at baseline are very large. For example, at baseline, men with high-occupational position score 6.7 points above men with intermediate occupational level on the reasoning test; this is equivalent to 19 years of decline at the average rate experienced by the high-occupational position men. The baseline reasoning score difference between high and low occupational position men is 55 times the annual average rate of decline for high occupational position men.
In a recent paper, Stern and colleagues propose height, alongside other anthropometric measures of development, to represent a measure of passive reserve and measures of
education and occupation are seen to represent reserve from the perspective of the active model of reserve.16 In our data, height, education and occupation were all associated with the baseline scores of the five cognitive tests. Occupation was the most strongly associated with the measures of cognition. It is possible that the greater effect of occupation is attributable to the impact of environments encountered after the completion of education that induce practice and reinforcement of cognitive abilities. These cognitive activities induced by work may lead to maintenance of higher levels of function. In this sense cognitive reserve is not fixed but continues to be shaped by life experiences.42 This reflects findings from animal studies where enriched environments have been shown to improve brain structure and function.7,43
However, greater decline in the higher occupation groups might imply that some of these gains may be lost with ageing.
The primary caveat to the results reported here is that the Whitehall II study is based on a white collar cohort with stable jobs and thus is not representative of the general population. However, the study includes a wide occupational spectrum with salary difference of over 10-fold between the top and bottom of the hierarchy. A further limitation is the lack of
neuropathological data in our study. Although there is evidence to suggest that all cognitive decline has a neuropathological basis,21,44 it is possible that the effect of cognitive reserve is mostly apparent in groups of older individuals with significant neuropathology.
Advantages of this cohort is the large size, multiple and accurate measures of cognitive reserve, low attrition and a large battery of cognitive tests. Cognitive decline is a central feature of the aging process.2,3,38,45,46 An important goal of understanding cognitive aging trajectories over the adult lifecourse is to identify factors that are neuroprotective. The association of education, and other markers of reserve, with dementia,8-14 suggests that it
could be one such factor. It is important to identify neuroprotective factors as even in the absence of dementia, poor cognitive status at older ages is taxing for the individual and society at large. Our data suggests that cognitive reserve is associated with cognitive performance but not rate of decline in cognitive function. One of the key tasks of future research is to identify mechanisms that lead to the large differences in cognitive performance over the adult lifecourse.
References
1. Holland, CA and Rabbitt, PMA. The Course and causes of Cognitive Change with Advancing age. Reviews in Clinical Gerontology. 1991; 1:81-96.
2. Brayne, C. The elephant in the room - healthy brains in later life, epidemiology and public health. Nat Rev Neurosci. 2007; 8:233-239.
3. Nelson, PT, Braak, H, and Markesbery, WR. Neuropathology and cognitive impairment in Alzheimer disease: a complex but coherent relationship. J Neuropathol Exp Neurol. 2009; 68:1-14.
4. Crystal, H, Dickson, D, Fuld, P, et al. Clinico-pathologic studies in dementia: nondemented subjects with pathologically confirmed Alzheimer's disease. Neurology. 1988; 38:1682-1687.
5. Stern, Y. What is cognitive reserve? Theory and research application of the reserve concept. J Int Neuropsychol Soc. 2002; 8:448-460.
6. Christensen, H, Korten, AE, Jorm, AF, et al. Education and decline in cognitive performance: compensatory but not protective. Int J Geriatr Psychiatry. 1997; 12:323-330.
7. Markham, JA and Greenough, WT. Experience-driven brain plasticity: beyond the synapse. Neuron Glia Biol. 2004; 1:351-363.
8. Stern, Y, Gurland, B, Tatemichi, TK, et al. Influence of education and occupation on the incidence of Alzheimer's disease. JAMA. 1994; 271:1004-1010.
9. Qiu, C, Backman, L, Winblad, B, et al. The influence of education on clinically diagnosed dementia incidence and mortality data from the Kungsholmen Project. Arch Neurol. 2001; 58:2034-2039.
10. Evans, DA, Hebert, LE, Beckett, LA, et al. Education and other measures of socioeconomic status and risk of incident Alzheimer disease in a defined population of older persons. Arch Neurol. 1997; 54:1399-1405.
11. Launer, LJ, Andersen, K, Dewey, ME, et al. Rates and risk factors for dementia and
Alzheimer's disease: results from EURODEM pooled analyses. EURODEM Incidence Research Group and Work Groups. European Studies of Dementia. Neurology. 1999; 52:78-84.
12. Ngandu, T, von, SE, Helkala, EL, et al. Education and dementia: what lies behind the association? Neurology. 2007; 69:1442-1450.
13. Gatz, M, Mortimer, JA, Fratiglioni, L, et al. Accounting for the relationship between low education and dementia: a twin study. Physiol Behav. 2007; 92:232-237.
14. Mortimer, JA, Snowdon, DA, and Markesbery, WR. Head circumference, education and risk of dementia: findings from the Nun Study. J Clin Exp Neuropsychol. 2003; 25:671-679.
15. Bennett, DA, Wilson, RS, Schneider, JA, et al. Education modifies the relation of AD pathology to level of cognitive function in older persons. Neurology. 2003; 60:1909-1915.
16. Brickman, AM, Siedlecki, KL, Muraskin, J, et al. White matter hyperintensities and cognition: Testing the reserve hypothesis. Neurobiol Aging. 2009.
17. Marmot, M and Brunner, E. Cohort Profile: the Whitehall II study. Int J Epidemiol. 2005; 34:251-256.
18. Heim, AW. AH 4 group test of general Intelligence. Windsor, UK: NFER-Nelson Publishing Company Ltd., 1970.
19. Borkowski JG, Benton AL, and Spreen O. Word fluency and brain damage. Neuropsychologica. 1967; 5:135-140.
20. Raven, JC. Guide to using the Mill Hill vocabulary test with progressive matrices. London, UK: HK Lewis, 1965.
21. Wilson, RS, Leurgans, SE, Boyle, PA, et al. Neurodegenerative basis of age-related cognitive decline. Neurology. 2010; 75:1070-1078.
22. Arvanitakis, Z, Grodstein, F, Bienias, JL, et al. Relation of NSAIDs to incident AD, change in cognitive function, and AD pathology. Neurology. 2008; 70:2219-2225.
23. Laird, NM and Ware, JH. Random-effects models for longitudinal data. Biometrics. 1982; 38:963-974.
24. Scarmeas, N, Albert, SM, Manly, JJ, et al. Education and rates of cognitive decline in incident Alzheimer's disease. J Neurol Neurosurg Psychiatry. 2006; 77:308-316.
25. Hall, CB, Derby, C, LeValley, A, et al. Education delays accelerated decline on a memory test in persons who develop dementia. Neurology. 2007; 69:1657-1664.
26. Elias, MF, Beiser, A, Wolf, PA, et al. The preclinical phase of alzheimer disease: A 22-year prospective study of the Framingham Cohort. Arch Neurol. 2000; 57:808-813.
27. Amieva, H, Le, GM, Millet, X, et al. Prodromal Alzheimer's disease: Successive emergence of the clinical symptoms. Ann Neurol. 2008; 64:492-498.
28. Whalley, LJ, Starr, JM, Athawes, R, et al. Childhood mental ability and dementia. Neurology. 2000; 55:1455-1459.
29. Lee, S, Buring, JE, Cook, NR, et al. The relation of education and income to cognitive function among professional women. Neuroepidemiology. 2006; 26:93-101.
30. Koster, A, Penninx, BW, Bosma, H, et al. Socioeconomic differences in cognitive decline and the role of biomedical factors. Ann Epidemiol. 2005; 15:564-571.
31. Richards, M, Shipley, B, Fuhrer, R, et al. Cognitive ability in childhood and cognitive decline in mid-life: longitudinal birth cohort study. BMJ. 2004; 328:552.
32. Anstey, K and Christensen, H. Education, activity, health, blood pressure and apolipoprotein E as predictors of cognitive change in old age: a review. Gerontology. 2000; 46:163-177.
33. Glymour, MM, Weuve, J, Berkman, LF, et al. When is baseline adjustment useful in analyses of change? An example with education and cognitive change. Am J Epidemiol. 2005; 162:267-278.
34. Karlamangla, AS, Miller-Martinez, D, Aneshensel, CS, et al. Trajectories of cognitive function in late life in the United States: demographic and socioeconomic predictors. Am J Epidemiol. 2009; 170:331-342.
35. Muniz-Terrera, G, Matthews, F, Dening, T, et al. Education and trajectories of cognitive decline over 9 years in very old people: methods and risk analysis. Age Ageing. 2009; 38:277-282.
36. Christensen, H, Batterham, PJ, Mackinnon, AJ, et al. Education, atrophy, and cognitive change in an epidemiological sample in early old age. Am J Geriatr Psychiatry. 2009; 17:218-226.
37. Van Dijk, KR, Van Gerven, PW, van Boxtel, MP, et al. No protective effects of education during normal cognitive aging: results from the 6-year follow-up of the Maastricht Aging Study. Psychol Aging. 2008; 23:119-130.
38. Hedden, T and Gabrieli, JD. Insights into the ageing mind: a view from cognitive neuroscience. Nat Rev Neurosci. 2004; 5:87-96.
39. Barnett, AG, van der Pols, JC, and Dobson, AJ. Regression to the mean: what it is and how to deal with it. Int J Epidemiol. 2005; 34:215-220.
40. Roe, CM, Xiong, C, Miller, JP, et al. Education and Alzheimer disease without dementia: support for the cognitive reserve hypothesis. Neurology. 2007; 68:223-228.
41. Katzman, R. Education and the prevalence of dementia and Alzheimer's disease. Neurology. 1993; 43:13-20.
42. Stern, Y. Cognitive reserve. Neuropsychologia. 2009; 47:2015-2028.
43. Kozorovitskiy, Y, Gross, CG, Kopil, C, et al. Experience induces structural and biochemical changes in the adult primate brain. Proc Natl Acad Sci U S A. 2005; 102:17478-17482.
44. Johnson, DK, Storandt, M, Morris, JC, et al. Longitudinal study of the transition from healthy aging to Alzheimer disease. Arch Neurol. 2009; 66:1254-1259.
45. Finch, CE. The neurobiology of middle-age has arrived. Neurobiol Aging. 2009; 30:515-520.
46. Filippini, N, MacIntosh, BJ, Hough, MG, et al. Distinct patterns of brain activity in young carriers of the APOE-epsilon4 allele. Proc Natl Acad Sci U S A. 2009; 106:7209-7214.
Table 1. Mean (25th, 75th percentile) scores at baseline in men and women as a function of cognitive reserve markers.* Cognitive tests† Men Women High Reserve Intermediate Reserve Low Reserve R2≠ High Reserve Intermediate Reserve Low Reserve R2≠
Reasoning (Alice Heim 4-I)
Occupational position 52.5 (47, 58) 45.8 (40, 54) 33.1 (25, 41) 26% 51.6 (48, 58) 43.0 (36, 51) 32.4 (24, 39) 43%
Education 52.2 (47, 59) 49.2 (44, 56) 45.3 (39, 53) 11% 49.6 (47, 58) 43.8 (38, 53) 37.6 (28, 46) 27%
Height 50.5 (45, 58) 49.1 (44, 56) 46.9 (40, 56) 5% 44.0 (37, 53) 41.3 (32, 52) 38.2 (28, 48) 16% Memory (20-word list)
Occupational position 7.3 (6, 9) 6.5 (5, 8) 5.7 (4, 7) 9% 7.7 (6, 9) 7.1 (5, 9) 6.1 (4, 7) 10%
Education 7.3 (6, 9) 6.8 (5, 8) 6.6 (5, 8) 7% 7.6 (6, 10) 7.2 (5, 9) 6.5 (5, 8) 8%
Height 7.0 (5, 8) 6.9 (5, 8) 6.7 (5, 8) 5% 7.2 (6, 9) 6.8 (5, 8) 6.6 (5, 8) 7%
Phonemic fluency (S words)
Occupational position 18.1 (15, 21) 16.1 (13, 19) 13.3 (10, 16) 13% 19.4 (17, 23) 16.8 (14, 20) 14.3 (11, 16) 21%
Education 18.0 (15, 21) 17.2 (14, 20) 16.0 (13, 18) 8% 18.7 (16, 22) 17.1 (14, 20) 15.5 (12, 18) 14%
Height 17.4 (15, 20) 17.0 (14, 20) 16.6 (14, 19) 4% 17.2 (15, 20) 16.7 (13, 20) 15.5 (12, 18) 10% Semantic fluency (animal names)
Education 17.6 (15, 20) 16.9 (14, 19) 15.7 (13, 18) 8% 18.6 (16, 22) 16.5 (14, 19) 14.5 (12, 17) 22% Height 17.2 (15, 20) 16.8 (14, 19) 16.1 (13, 19) 5% 16.5 (14, 20) 16.0 (13, 19) 14.8 (11, 18) 13% Vocabulary (Mill-Hill) Occupational position 27.0 (25, 29) 24.7 (23, 27) 20.0 (17, 24) 20% 27.6 (26, 29) 24.0 (22, 27) 18.5 (14, 23) 39% Education 27.3 (26, 30) 26.0 (24, 28) 24.1 (22, 27) 12% 26.4 (26, 30) 24.6 (23, 28) 21.2 (18, 25) 19% Height 26.3 (24, 28) 25.8 (24, 28) 25.1 (23, 28) 2% 24.4 (22, 28) 22.9 (20, 27) 21.3 (17, 26) 10%
† Range of cognitive tests: Memory (0-20), Reasoning (0-65), Phonemic and Semantic Fluency (0.35) and Vocabulary (0-33).
* All three markers of reserve show a graded association with all 5 measures of cognitive function in men and women, p<0.01. ≠
Table 2. Cognitive decline as a function of occupational position, estimates derived from linear mixed models using 3 assessments over 10 years.
Cognitive tests† OCCUPATION POSITION ≠ P for interaction High (N=3140) 14% women Intermediate (N=3289) 31% women Low (N=1025) 73% women 10-year decline (95% CI) 10-year decline (95% CI) 10-year decline (95% CI) Reasoning (AH4-I) -3.47 (-3.69, -3.26) -3.43 (-3.64, -3.21) -4.04 (-4.47, -3.60)* 0.04
Memory (20-word list) -0.77 (-0.87, -0.68) -0.61 (-0.70, -0.51)* -0.46 (-0.64, -0.28)** 0.003 Phonemic fluency (“s” words) -1.72 (-1.85, -1.59) -1.48 (-1.61, -1.35)* -1.54 (-1.79, -1.29) 0.04 Semantic fluency (animal names) -1.53 (-1.65, -1.41) -1.26 (-1.38, -1.14)** -0.89 (-1.12, -0.65)*** <0.001
Vocabulary (Mill-Hill) 0.11 (0.03, 0.19) 0.08 (0.00, 0.16) 0.06 (-0.10, 0.22) 0.83
Global cognitive score± -0.27 (-0.28, -0.26) -0.23 (-0.25, -0.22)*** -0.21 (-0.24, -0.19)*** 0.001 † Range of cognitive tests: Memory (0-20), Reasoning (0-65), Phonemic and Semantic Fluency (0.35) and Vocabulary (0-33).
≠ The interaction term assesses whether the decline was different in the three occupational groups. Further tests
compared the high reserve group to the other two groups and here *p<0.05, **p<0.01, ***p<0.001.
±
Score calculated by converting raw scores on each test to z-scores using the baseline mean and standard deviation and then averaged across the five tests.
Table 3. Cognitive decline as a function of education, estimates derived from linear mixed models using 3 assessments over 10 years.‡
Cognitive tests† EDUCATION ≠P for interaction High (N=2092) 21% women Intermediate (N=1848) 25% women Low (N=3157) 37% women 10-year decline (95% CI) 10-year decline (95% CI) 10-year decline (95% CI) Reasoning (AH4-I) -3.17 (-3.43, -2.90) -3.41 (-3.70, -3.12) -3.78 (-4.00, -3.55)*** 0.002
Memory (20-word list) -0.73 (-0.85, -0.62) -0.61 (-0.73, -0.48) -0.65 (-0.74, -0.55) 0.30
Phonemic fluency (“s” words) -1.57 (-1.73, -1.42) -1.70 (-1.87, -1.53) -1.50 (-1.63, -1.37) 0.19 Semantic fluency (animal names) -1.45 (-1.60, -1.31) -1.30 (-1.45, -1.14) -1.23 (-1.36, -1.11)* 0.08
Vocabulary (Mill-Hill) 0.20 (0.10, 0.30) 0.11 (0.00, 0.21) 0.00 (-0.08, 0.09)** 0.009
Global cognitive score± -0.25 (-0.27, -0.23) -0.24 (-0.26, -0.23) -0.26 (-0.26, -0.23) 0.82
‡
Note that data on education were missing for 357 individuals; these analyses are based on 5018 men and 2079 women.
† Range of cognitive tests: Memory (0-20), Reasoning (0-65), Phonemic and Semantic Fluency (0.35) and Vocabulary (0-33).
≠ The interaction term assesses whether the decline was different in the three occupational groups. Further tests
compared the high reserve group to the other two groups and here *p<0.05, **p<0.01, ***p<0.001.
±
Score calculated by converting raw scores on each test to z-scores using the baseline mean and standard deviation and then averaged across the five tests.
Table 4. Cognitive decline as a function of height, estimates derived from linear mixed models using 3 assessments over 10 years.‡
Cognitive tests† HEIGHT‡ ≠P for interaction Tall (N=2430) 33% women Average (N=2245) 30% women Short (N=2779) 26% women 10-year decline (95% CI) 10-year decline (95% CI) 10-year decline (95% CI) Reasoning (AH4-I) -3.22 (-3.48, -2.97) -3.48 (-3.75, -3.22) -3.74 (-3.99, -3.50)* 0.01
Memory (20-word list) -0.71 (-0.82, -0.60) -0.63 (-0.74, -0.52) -0.62 (-0.73, -0.52) 0.46
Phonemic fluency (“s” words) -1.59 (-1.74, -1.44) -1.52 (-1.68, -1.36) -1.61 (-1.75, -1.47) 0.70 Semantic fluency (animal names) -1.29 (-1.43, -1.15) -1.37 (-1.52, -1.23) -1.30 (-1.43, -1.17) 0.70
Vocabulary (Mill-Hill) 0.18 (0.08, 0.27) 0.10 (0.00, 0.19) 0.02 (-0.07, 0.10)* 0.05
Global cognitive score± -0.24 (-0.26, -0.22) -0.24 (-0.26, -0.23) -0.25 (-0.27, -0.24) 0.55
‡
Height in thetall group in men (women) was ≥ 180cm (165cm), in the average group was 175-179cm (160-164cm) and in the shorter that average group it was ≤ 175cm (160cm).
† Range of cognitive tests: Memory (0-20), Reasoning (0-65), Phonemic and Semantic Fluency (0.35) and Vocabulary (0-33).
≠The interaction term assesses whether the decline was different in the three occupational groups. Further tests
compared the high reserve group to the other two groups and here *p<0.05, **p<0.01, ***p<0.001.
±
Score calculated by converting raw scores on each test to z-scores using the baseline mean and standard deviation and then averaged across the five tests.
Figure 1. Observed data on cognitive tests (Reasoning (A), Memory (B), Phonemic Fluency (C), Semantic Fluency (D) and E (Vocabulary) at three repeat assessments in the high, intermediate and low occupation groups.