Density Bonuses and Affordable Housing, in California: Examining the Economic Impact on Three Cases
By Kevin Skiles B.S. Architecture 1996 University of Michigan, Ann Arbor
Submitted to the Department of Urban Studies and Planning in Partial Fulfillment of the Requirements for the Degree of Master of Science in Real Estate
Development At the
Massachusetts Institute of Technology September 2003
@2003 Kevin Skiles all rights reserved
The author hereby grants MIT permission to reproduce and to distribute publicly paper and electronic copies of this thesis document in whole or in part.
Signature of Author:_
DepartgIent-1LU4ban Studies and Planning July 29,2003 Certified by:
David Geltner, Professor 4 Reif-ii-ie Finance Department of Urban Studies and Planning Thesis Supervisor.
Accepted by:
David Geltner, Chairman, Interdepartmental Degree Real Estate Development
MASSACHUSETTS INSTITUTE OF TECHNOLOGY
AUG 2 9 2003
LIBRARIES
Program inI
ROTCH
Density Bonuses and Affordable Housing- in California: Examining the Economic Impact on Three Cases
By Kevin Skiles
Submitted to the Department of Urban Studies and Planning On July 29, 2003 in Partial Fulfillment of the Requirements for the Degree of Master of Science in
Real Estate Development
Abstract
The State of California faces a shortage of housing in many of its urban and suburban communities. This shortage has led to increasing home prices and there has been growing citizen demand to address housing affordability. The California State
government recognized in 1992 that incentives were needed to stimulate the development of both housing that was designated for low-income residents and housing that was priced at market rate. The government understood that any law that acted as a further exaction on private developers would be counterproductive to their goals and thus adopted a density bonus program, to be implemented by local planning authorities, with the creation of California Government Code Sections 65915 through 65918.
The paper will use three case studies to analyze the law's effectiveness as an incentive to private developers. By understanding the impact of the density bonus on individual projects, we will be able to make detailed insights into what is successful and what problems exist with the current program
Thesis Adviser: David Geltner Title: Professor of Finance
Table of Contents I. Introduction
II. Case Selection Criteria
III. Methodology for Using Case Studies
IV. Granite Place: Santa Rosa, CA Andy Brown, developer
V. The Berkeleyan: Berkeley, CA Panoramic Interests, developer
IV. The Egyptian: San Diego, CA CityMark Development, developer
V. Conclusions VI. Bibliography pg. 4 pg. 5 pg. 10 pg. 20 pg. 33 pg. 48 pg. 63 pg. 67
Introduction
The State of California faces a shortage of housing in many of its urban and suburban communities. Growth and increased demand have outpaced supply over the last twenty years and home values have risen rapidly as a result. The high cost of housing has limited the ability of many families to find adequate housing at an affordable price. As a result, affordable housing has become a political issue that residents want to see their
state and local governments address.
With the growing citizen demand to address the affordable housing problem, the
California State government recognized in 1992 that incentives were needed to stimulate the development of both housing that was designated for low income residents and housing that was priced at market rate. The government understood that any law that acted as a further exaction on private developers would be counterproductive to their goals and thus adopted a density bonus program, to be implemented by local planning authorities, with the creation of California Government Code Sections 65915 through
65918.
The program has been adopted by numerous local jurisdictions and this paper will use three case studies to analyze the law's effectiveness as an incentive to private developers. By understanding the impact of the density bonus on individual projects, we will be able to make detailed insights into what is successful and what problems exist with the current program. A more thorough understanding of the workings of a density bonus will allow greater use of the existing program by private developers, insights toward improving the program and recommendations for further government action.
Case Selection Criteria
Primarily, cases will be selected based on their ability to make the two comparisons that will be at the heart of the paper's inquiry.
1. Cases study projects will be compared to a hypothetical project, on the same site, that would not include a density bonus for including affordable housing. 2. The welfare effect of the density bonus on the case study project will be
compared to the welfare effects of the density bonus on the other case study projects surveyed in the paper. Conclusion about each market's ability to encourage the use of density bonuses will be made.
I. Different Geographic Regions and Markets and the Model State Law
The paper will rely on cases from many different geographic regions rather than a single market. The purpose of this is to make comparisons between the way the same set of density bonuses are being used in the different markets and the different welfare effect of the bonus across different markets and regions. Thus, the control variable in the
comparison of case examples is the model law, which is uniform across all of the
market's cases will be drawn from. The value of analyzing the cases will in large part the comparison of markets.
Code California Government Code Sections 65915 through 65918 provide the framework for local municipality planning codes to provide density bonuses to development s that include affordable housing. This model code, created in 1992, is adopted by over one
hundred planning jurisdictions in the state of California and has been employed by hundreds of developments. "The purpose of these regulations is to provide increased residential densities to developers who guarantee that a portion of their residential development will be available to low income, very low-income, or senior households."
Provisions that outline what constitute low, very low and senior households are set forth in the statute. For a development to receive the density bonus as of right, one of the following criteria must be met:
"(A) At least 20 percent of the pre-bonus units in the development will be affordable, including an allowance for utilities, to low-income households at a rent that does not exceed 30 percent of
60 percent of area median income, as adjusted for assumed household size; or
(B) At least 10 percent of the pre-bonus units in the development will be affordable, including an allowance for utilities, to very low-income households at a rent that does not exceed 30 percent of 50 percent of the area median income, as adjusted
for assumed household size; or
(C) At least 50 percent of the total units will be available to Senior Citizens or qualifying residents as defined under California Civil
Code Section 51.3."'
Both rental and for sale projects can use the density bonus statute. The completed project is required to maintain the affordability standards for a period of ten years if no additional subsidy was used by the development. Furthermore, the code states that market rate and below market units should be comparable in size, location and quality to prevent a marginalization of the affordable housing component of the development. This
comparability requirement is a guideline and considerable flexibility exists for the local authority to interpret what 'comparable' is.
In return for providing affordability in one of the three manners set forth by the code, developments receive a density bonus. The bonus is 25% beyond the zoned density that is currently governing the property. The bonus can be in number of units or in Floor Area Ratio (FAR) depending on the metric in place at the site. "The importance of the density bonus being 'as of right' cannot be underestimated."2 Without having to labor
through a public hearing process, the use of the bonus does not add any entitlement risk to the project. While opponents of a project may still use whatever channels are available to them to protest the development, no additional means of challenge are created with the
use of the this statute.
In addition to this bonus, many local municipalities have augmented the state code framework. These additional bonuses are encouraged by the state code and show up in two forms. First, many jurisdictions provide for density increases beyond 25% in a case-by-case manner. Developers often submit a pro forma to the governing planning official
that shows the infeasibility of a housing project at the location. If the official bestows an additional density bonus beyond 25%, the project may become feasible without any
direct financial subsidation. The second method local municipalities employ to
encourage developers to build affordable housing through this code is to provide direct financial subsidation. These additional subsidies occur on a case-by-case method and often include reductions in fees, or direct financial contribution through a redevelopment agency. The uses of these additional bonuses are provided for within the framework of the state model code and have been used in many jurisdictions. Usually the provision of additional bonuses and assistance beyond the 25% density increase extend the
affordability requirement to thirty years. In this way the local agency can lock in affordability for a longer time period by providing additional subsidies.
Each of the cases this paper uses to analyze the effect of density bonus' will conform to the framework of the model code. In this way, we will be able to make conclusions regarding the effectiveness of the law on individual projects and make conclusions about the effectiveness of the law across various markets.
II. Projects must be representative of typical projects in the Region
The paper will seek to select cases that are representative housing developments of the geographic area where they were developed. Although this will limit the ability to compare individual cases to each other, it will allow better comparison between the project that was developed using the density bonus and a hypothetical project on the same
site that would not have used the density bonus. This will allow measurement of the density bonus' welfare effect.
In order to do this, the built project must be of a type that could have been developed without the density bonus. In addition to scale and construction type, this will require cases that are limited to the minimum affordability set forth in the sate law. Cases will also be limited to projects that received no significant direct government subsidy.
III. Cases will be drawn from markets that are stable and relatively large
It is the purpose of the study to find cases that are representative of the market and are typical of ongoing development in the market. For this reason, it is important to draw cases that are in markets with ongoing development and with reliable market data
including rent/SF figures, construction costs/SF and land costs. These inputs are required to complete an evaluation of the case studies. The cities of Santa Rosa, Berkeley and San Diego each contain projects that have used density bonuses in the past and have been selected in this study. There is considerable variety across these three markets that will make comparisons regarding the successful implementation of density bonuses insightful and enough development has occurred within each market to be able to make conclusions
Methodology for Using Case Studies I. Physical Description
A physical description of the project will provide important background and reference for the reader. While the names of the projects, and the exact locations may be kept private if requested by the project developer, the reader will be given enough information to get a rough picture in their mind of the project. Descriptions will include approximate
location, scale, type of units and construction type. The completion date of the project will be given as well.
The development team will be described in as much detail as is allowed by the company providing information. While not essential, a brief understanding of the organization responsible for the development, their goals and intent can be helpful. Fund sources including equity and debt investors will be described in order to later analyze the financial components of the project. Any significant deviations from market rate financing will be noted.
The overall intent and strategy of the development will be described as well. What market the project expects to serve and who the potential tenants are will be described.
The paper will attempt to ascertain what intent, be it social or profit-maximizing, the sponsor had when deciding to employ the density bonus. In essence, it is important to understand whether the use of the density bonus is a profit-maximizing decision or if some other goal is being served by the use of the bonus.
Any significant events during the development of the project that had impacts on the financial success of the project will be described. Primarily through direct interviews with the project sponsor, the paper will outline the general process of the development.
11. Financial Analysis with Discounted Cash Flow statements of Project as built and Hypothetical Project without use of the density bonus
A financial description, or analysis, will be outlined in the paper for each of the cases. Actual cash flows realized, or if not available, projected cash flows will be used to
determine a net operating income. Development costs and any direct fee waivers or subsidations by government will be tallied and compared with capitalized net income. Market rate costs of capital for both stabilized assets of this type and the development period will be used in these calculations. Stabilized asset costs of capital will be measured by adding market observed cap rates to projected gowth rates:
r = y + g
Using the Geltner 'canonical method' we can determine the market rate of risk for the development phase of the project by using the "equilibrium across the markets for stabilized property, construction debt and land."3 Thus having knowledge of:
Vt = Expected value of completed stabilized property at time T
Lt = Expected balance of all construction costs including financing
E[rv] = Market expected total rate of return on investments in completed properties of this type
E[rd] = Market expected total return on construction loans (actual expected yield)
Allows us to make the following calculation to determine E[rc], the opportunity cost of capital for the development of a particular project, with a particular budget at a particular location.
(VT- LTX1+E[r])'(1+E[r"
I
-TL(1+E[rD I
TV,
-(1 +E[r]L,
_The purpose of the discounted cash flow analysis is to be able to calculate a Net Present Value (NPV) for both the project incorporating density bonuses and the project in the same location, without density bonuses. The purpose of determining a different cost of capital for the stabilized phase and the development phase allows us to more rigorously compare the NPV of the project as built and the hypothetical, less dense project in the same location. The difference in density in some cases may create a significant
difference in construction cost as a percentage of total development cost which would in turn create a difference in E[rc] between the two projects.4
In order to make the comparison, the paper will analyze the existing zoning at the site without a density bonus, average construction and development costs and compute profitability of a development on the same site as the case study project. These inputs,
along with other financial information from the cases, will be used to analyze the net welfare effect of the density bonus.
III. Analyze case with the Rubin & Seneca Model and the Wheaton/DiPasquale Model: measurement of the density bonus welfare effect
Jeffrey Rubin and Joseph Seneca developed an economic model to quantify the effects of density bonuses on new developments in their 1989 paper entitled "Density Bonuses, Exactions, and the Supply of Affordable Housing". While their area of study was New Jersey, the model remains relevant to California's markets and model state law for many reasons. First, their model uses the four market rate units for every affordable unit which is consistent with California's 20% affordability requirement. Second, the model
abstracts variables from developments and the housing market and is generic enough to be of use with our projects and market variables.
The model created by Rubin and Seneca extracted "central elements of a density bonus and an accompanying inclusionary housing requirement"5. These elements include variables subject to public control such as the size of the area or unit number bonus and the subsidation requirement. An assumption of downward sloping demand curve with price on the vertical axis and density on the horizontal axis is used. Finally, below market prices are determined using Area Median Income (AMI) calculations based on rent being 30% of income.
The model is premised on varying profitability based on the density achieved by the development. This premise that profitability is variable with different developed densities is widely understood in academic and professional circles. As developed density of a particular site increases, rent decreases and construction costs increase. The
Wheaton/DiPasquale diagram employs this theory and indicates an optimal density
resulting in profit maximization. per sq. ft. Houaing FAR: F $ per sq. #t. Lard FAR: F
The model predicts the positive slope of construction costs as density increases by the following formula6 :
Where,
C= construction costs
t = cost of baseline "stick" construction
p = marginal impact of FAR on cost of construction
Anecdotal evidence from the development community suggests that there are break points that increase the costs of construction in leaps at certain densities that either require more stories or more restrictive construction types.7 Each case will be examined for its conformity to this upward sloping construction cost curve and any significant deviation will be noted.
In the Rubin and Seneca model, a density greater than the prescribed zoned density maximizes profit and is located at Q(e). Without the profit maximizing zoning lying beyond the existing as of right zoning, there would be no incentive for a profit-maximizing developer to employ a density bonus to exceed the current zoning. In addition to the profit maximizing zoning, the model outlines the impact on profit for the zoned density without the bonus, Q(z), the profit from the density with the bonus, Q(m), and a zero profit zoning that builds the maximum number of units, Q(s).
Tc F -- - - -A!N~ ~E I Q Y M J! ... Affordable Price MR Demand 0 Q Ql Q a O Q0b Q c Quantity of Units on ze ~a ~ s a given parcel of land
These dashed vertical density lines interact with the downward sloping demand curve that represents tenant's desires to live in 'less dense' housing to determine rent. For instance, with zoning fixed at Q(z), demand at point 'L' will determine rents at point 'T'.
What each of the cases in this paper will show, however, is that the relationship between density and price is different across projects and does not always conform to the assumed downward sloping demand curve. In certain projects of medium density (10-30 units per acre), the addition of more density does not always decrease price in proportion. As with
the increase in construction costs due to increases in density, there are break points at which added density will decrease costs but the relationship is not a smooth, downward sloped, linear one as predicted in the Wheaton/DiPasquale model and the Rubin and Seneca model. 9
P a-F
Where,
P = Price
a = all housing and location factors besides FAR
P
= marginal impact of FAR on Price/SFF = FAR
Actual prices of land, housing and actual zoned densities will support this claim and each case will show the unique effect of this result. The intersection of the density and the demand curve result in a rental price not a marginal cost to develop. Marginal costs are determined by actual development costs and are held constant in the Rubin and Seneca model at point A. The cost of below market unit construction minus the below market price is divided by the affordability percentage (25%) and this figure is added to the marginal cost of market rate units to arrive at point W = A + (25% * AU), the true marginal cost of a developed unit of housing.' 0
The Rubin and Seneca model can measure various effects. By measuring the area
prescribed by certain rectangles, the model can measure profit of existing zoning (AKTL) and profit under density bonus zoning (WVXR). By subtracting these two, we arrive at a
density bonus 'profit gain'. We can also measure the welfare loss of existing zoning (LXQ) and the welfare loss under density bonus zoning (CEQ). By subtracting these two we arrive at a density bonus 'welfare gain'. These measurements provide an
understanding of the impacts of the density bonus law used in the case study projects.
IV. Conclusions
There will be many conclusions that can be drawn from such an analysis. First, our cases should provide insight into the major forces within the market that impacted development costs and consequently created a gap between market rate and affordable unit prices. Land cost, construction costs and entitlement issues among others all could be relevant here. These effects will be quantified in generic, per square foot terms in these
conclusions.
Other important factors include the price elasticity of demand. Rubin and Seneca predict that Profit with the density bonus is more likely to exceed Profit without the bonus when the density bonus is large, the exaction rate is low and there is a high price elasticity of
demand. The paper will attempt to determine if these predictions are represented in the cases under varying market conditions.
With the law now being 12 years old and adopted in many jurisdictions, it will be
interesting to discover if the land sales included the price of profit maximization that may include the employment of a density bonus. By talking to the project sponsor and
discover if the 'excess profits' went to the land, to the subsidy only, to the developer, or some combination of all three. Who is getting the benefit of the increased welfare? The paper should shed light on this.
The use of cases will also allow the paper to get detailed anecdotal information that may have significantly effected profits and can be applied to other projects. For instance, an increase in scale of a project may create 'leaps in cost' as one more strict construction type is substituted for another. Prices of market rate units may increase or decrease with the inclusion of affordable units based on the design of the project - do the affordable units create a podium for the market rate units to achieve better views? Or did the increased density detract from the value of all units. Speedy project approval could also be a significant effect of including affordable housing. These effects will be discussed
and analyzed in each case.
The paper will discuss actions planning staff and developers could take to better utilize density bonuses. Recent laws in some of the regions studied in the paper mandate the inclusion of 10% affordable housing will be examined. Other incentives including reduction in fees and sped up entitlement periods will be examined to see what impact such policies could have on further incentivizing the use of density bonuses.
Granite Place - Santa Rosa, CA
Granite Place is a recently completed multi-family housing development in Santa Rosa, California. Santa Rosa is a city of 150,000 people in Northern California's Sonoma County. It lies about one hour north of the Golden Gate Bridge. While many residents commute to the San Francisco Bay Area for employment, Santa Rosa has an economy of its own and is the county seat of Sonoma County.
Developer Andy Brown acquired the one acre site in December of 2001 and completed the project in May of 2002. The project consists of 24 housing units, six of which are
studios, twelve of which are one bedrooms and six are two bedrooms. There are two units, a one bedroom and a two bedroom, that are restricted to 'Very Low Income' people who make less than 50% of the Area Median Income (AMI). In exchange for the
provision of these two units, the developer was able to increase the allowable units on the site from 19 to 24.
The construction of the project is typical of what is seen in much of Santa Rosa's multi-family housing market. There are three buildings, each containing eight units, arranged in a horseshoe formation around a central grassy courtyard. On the open end of the courtyard is the surface parking lot with free standing carports. The buildings are two story, wood frame with stucco finish built on a grade level concrete slab.'3 Due to some restrictions to the site which were put in place prior to Mr. Brown's acquisition, there are some upgrades to the construction that incurred cost to the development including the
burial of some of the electrical wires, an upgrade of the exterior finish system to stucco and Spanish style, clay tile roofs. In addition to these city mandated design features, the developer chose to selectively add designer light fixtures and increase all of the ceiling heights to nine feet, eight feet is standard throughout the market, in order to improve the design quality of the project. While these features added expense to the project, in the long run the developer has agreed that they have added significant value by improving the appearance of the development and consequently helping to retain tenants.
The site was acquired with an all cash payment of $350,000 and upfront fees to the city for all permits were $250,000 paid soon after acquisition. Much of the success of the project was in Mr. Brown's ability to cut construction costs at every available
opportunity. By sourcing material from Canada and using laborers from Sacramento, Mr. Brown estimates that hundreds of thousands of dollars were saved. Additionally, he and his son did much of the carpentry work further saving on labor costs. In total, the project was built for $76.50 per square foot. The R.S. Means workbook estimates construction
of this type in this location to be $119.15 per square foot. However, Mr. Brown acted as General Contractor and when you subtract out general contractor fees, often 25%, then the R.S. Means estimate falls to $89.37 per square foot.14 Essentially, by performing the general contractor responsibilities on the project, the developer was able to defer the fee that would have been paid to the general contractor into equity in the project.
On top of the $600,000 Mr. Brown had in the project from the acquisition, he put another $400,000 in during construction and got a construction loan of $1 million. To the bank's
disbelief, the developer's ability to pinch pennies throughout construction resulted in only $900,000 of the loan being drawn. This was a project that the in the bank's estimation would take almost $2.5 million to complete. At the end of May, after six months of development and construction, the project was complete and leases began to be signed. As of the beginning of the project stabilization period, Mr. Brown had $1 million in the project with a loan of $900,000.
Leases were quickly signed for the affordable units at $555 for the one bedroom and
$635 for the two bedroom. These rents are based on being affordable to 'Very Low
Income' tenants who make only 50% of the AMI. The rents are restricted to being affordable for thirty years. The market rate units went for $750, $825 and $1050 for studio's, one bedroom's and two bedroom's respectively. The following table
summarizes the physical and financial figures and allows us to compare the project that was built, with the density bonus, to a hypothetical project that was built without using a
density bonus. Figure Al. Physical Description Lot Area (SF) Building Area (SF) # units
Allowed Zoning (# units) Development Cost cost / SF
total construction cost land cost
Total Development Cost
Financial Description Rents / Price
unit type A studio unit type B 1BD unit type C 2BD subsidized unit A 1 BD subsidized unit B 2BD
Proj. w/ Proj. w/o density bonus density bonus
17000 13458
24 19
24 19 both projects evaluated at maximum legal density
$ 76.50 $ 82.50 $ 1,300,500 $ 1,110,313 $ 600,000 $ 600,000 $ 1,900,500 $ 1,710,313 750.00 825.00 1,050.00 555.00 635.00 750 825 1050
based on 50% AMI calculations (very low income) based on 50% AMI calculations (very low income)
One important fact to note regarding this project that deviates from the Rubin and Seneca model and the Wheaton and DiPasquale model is the impact of increased density on market rate rents. The developer of Granite Place is convinced that there is no difference in the eyes of his tenants between nineteen and twenty-four units per acre. Both of these
densities he describes as 'low density' and when he was developing the pro forma for the project with and without the density bonus, he did not deduct any rent from the units in the project with greater density. This fact runs contrary to the assumed downward sloping demand curve suggested in both the Rubin and Seneca model and the Wheaton and DiPasquale model. Mr. Brown notes that this demand curve has a downward trend but that it does not have a consistent and smooth slope. In his opinion, rent's sensitivity to density in the Santa Rosa market has certain break points. For instance, as a project
goes over twelve units per acre, rents decrease significantly. Again as a project increases past fifty units per acre, rents will fall again. The fact that the demand curve does not in reality act as a straight line, and has very little slope between twelve and fifty units per acre, has profound results on the profitability of adding density. 1
In a similar way, the addition of density to the Granite Place development decreased the overall per square foot construction cost. While it is generally understood that denser
development increases the cost of construction as demonstrated in the Wheaton and DiPasquale Optimal FAR graph, there are again certain break points to this construction cost curve. Increased costs of construction are typically experienced when a project gets large enough to require a more restrictive construction type or when stories need to be added to accommodate the additional density. Neither consequence resulted from the
addition of the five units at Granite Place as part of the density bonus. In fact, due to economies of scale that are outlined in the R.S. Means estimating handbook, construction costs per square foot actually decreased by $6 per square foot. 16 The resulting financial
effect of the developer's use of the density bonus on Granite Place Apartments is outlined in the figures A2.
Note that the total wealth generated by the density bonus is $230,715 as measured by taking the difference between the net present value of the project with the density bonus
and the net present value of a hypothetical unbuilt project without the bonus. This is a measurement of the wealth effect at the property level. Net present values were determined using market rate costs of capital. Growth and capitalization rates were observed from historical data. Market rates of risk for development, construction and stabilization were constructed from the observed capitalization and growth rates and by using the Canonical method. By taking into consideration the use of leverage, the
analysis in figure A3 shows the actual wealth effect of the density bonus to the developer owner.
What is striking about this analysis is the magnitude of increase in NPV attributed to the density bonus. While both the project that uses a density bonus and the project that does not use the bonus both provide a positive NPV investment, at the property level the
project that employs a density bonus increases the Net Present Value from $80,122 to $310,838. This represents a staggering increase of 287%. The analysis of the impact of the density bonus on the welfare of the equity investor or developer shows the effect of
leverage as well as the positive impact of the density bonus. Referencing Figure A3, the NPV of the equity component of the project jumped from $97,075 to $309,061 by employing the density bonus. This represents an increase of 218%.
In the case of Granite Place Apartments, it is clear from the analysis that the equity owner or developer is the main recipient of the wealth effect generated by the density bonus. There can be many explanations for this fact. The Santa Rosa real estate development market is comprised primarily of out of town developers, developer contractors, as was the case in Granite Place, and small property development firms. Using density bonuses requires both financial sophistication and knowledge of local statutes. The types of firms
developing in the Santa Rosa, for the most part, lack this nexus of sophistication and knowledge. This leads to an inefficient land market where land is sold at transaction prices that do not always represent the highest and best use.17 A more efficient market with more bidders and more sophisticated local developers can be predicted to transact land with the full knowledge of the NPV impacts of employing density bonuses in a development. This is not the case yet in Santa Rosa and developers who use such bonuses will be able to consistently beat the market's expected returns in the short run.
Another important component to the success of this project was the speed with which the developer was able to construct and stabilize Granite Place. In only six months, the developer secured entitlement and constructed the project. Leases were begun shortly thereafter. This speed had a profound effect on the profitability of the project. If for instance, employing a density bonus caused the entitlement process to drag out for an
extra nine months (a situation that is easy to imagine in many hard to build communities), the effect is outlined in Figure A4.
As can be seen from this analysis, a delay of nine moths absorbs all of the NPV gain attributed to the density bonus. This analysis did not take into account for legal fees for nine months of planning appeals that easily could amount to even more erosion of value. What is clear is that for density bonuses to most effective and most widely used by profit maximizing developers, there must not be an increase in entitlement risk. Any such risk or increase in scheduled time quickly eliminates the wealth created by the use of a
density bonus.
There are many conclusions we can draw from studying the Granite Place Apartments development. First, we can conclude that the standard assumptions of the
Wheaton/DiPasquale optimal density model and the Rubin Seneca model that increased density has a constant declining effect on rents is not the case in some markets. Second, the assumption that as density increases, construction costs smoothly increase is flawed.
What is clear is that just as with rents, the effects of density occur in jumps at certain break points. For construction, these break points are increases in building height and graduation to more restrictive construction types.
Our analysis of the cash flows from the project show that density bonuses can add
significant value to the project and that the majority of that increased value will fall to the developer in a less sophisticated market like Santa Rosa. It is also clear that any delays
or increased entitlement cost as a result to increasing the density of a development in order to use a density bonus will quickly erode any value created by such a bonus.
Figure A2.
Market Rate discount rates, cap rates and growth rates
development 16.03
construction 4.50
stabilized operation 9.00
using the WACC
% equity of project cost
equity OCC stabilized
growth rate of rents Capitalization rate
% based on Geltner Canonical Method % based on risk free rate plus 100 BP
% based on r = y + g
52.62
10.8C
2.00%
7.00%
rates are taken from market data and historical figures
10 yr Property Before Tax Cash Flow Schedule (assumes 5% vacancy, 5% management fee, 10% capital improvement reserves, insurance and taxes)
YO-6 mo. Yr1 (time T) Yr2 Development
project w/ bonus project w/o bonus
Y10 w/
Yr3 Y4 Y5 Y6 Y7 Y8 Y9 reversion
based on Y11
(1,900,500) $164,827 168,729 172,709 176,768 180,909 185,132 189,440 193,834 198,316 $3,101,278 (1,710,313) $133,164 136,366 139,632 142,963 146,361 149,827 153,362 156,968 160,646 $2,512,929
NPV (9% discount rate used Y1-10,
project w/ bonus project w/o bonus
16.03% used YO) $310,838
$80,122
IRR
project w/ bonus project w/o bonus Wealth effect to Project $230,715
12.38% 10.76%
Figure A3.
Analysis of Equity Returns to Owner (PBTCF - Debt service)
10 yr Equity Before Tax Cash Flow Schedule (assumes 7% interest only loan, 10 yr term)
Y10 w/
project w/ bonus project w/o bonus
YO-6 mo. Yr1 (time T) Yr2 Development (1,000,000) $101,792 $105,694 $1 (915,500) $77,527 $80,729 $ reversion Yr3 Y4 Y5 Y6 Y7 Y8 Y based on Y1 1 projected rents 09,674 $113,733 $117,874 $122,097 $126,405 $130,799 $135,281 $2,137,743 83,995 $87,326 $90,724 $94,190 $97,725 $101,331 $105,009 $1,662,480
NPV (10.8% discount rate used Y1-10, 16.03% used YO)
project w/ bonus $309,061
project w/o bonus $97,075
Wealth effect to Equity Owner
IRR
project w/ bonus project w/o bonus
$211,986
Figure A4.
Effect of 9 month delay on project that uses a density bonus.
10 yr Property Before Tax Cash Flow Schedule (assumes 5% vaca
YO-1.5 Yr. Yr1 (time T) Yr2 Development
project w/ bonus project w/o bonus
ncy, 5% management fee, 10% capital improvement reserves, insurance and taxes)
Y10 w/ reversion Yr3 Y4 Y5 Y6 Y7 Y8 Y9 based on Y1 1 projected rents (1,900,500) $164,827 168,729 172,709 176,768 180,909 185,132 189,440 193,834 198,316 $3,101,278 (1,710,313) $133,164 136,366 139,632 142,963 146,361 149,827 153,362 156,968 160,646 $2,512,929
NPV (9% discount rate used Y1-10, 13.11% used YO)
project w/ bonus and 9 month d $77,466
project w/o bonus and w/o delai $80,122
Wealth effect to Project ($2,657)
IRR
project w/ bonus project w/o bonus
12.38% 10.76% 16.17%
T
Demand (low density MFR)
Affordable Price
MC + (WA) NC
Qz Q=
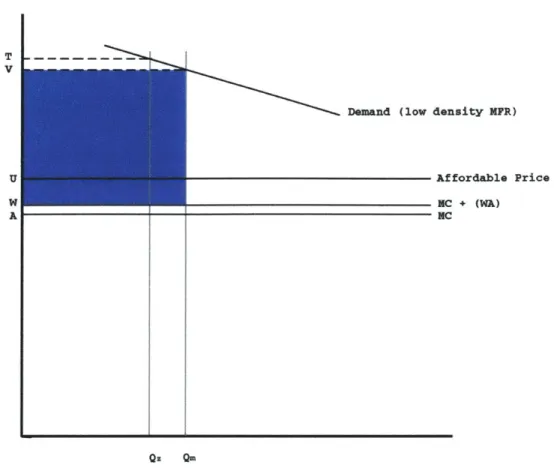
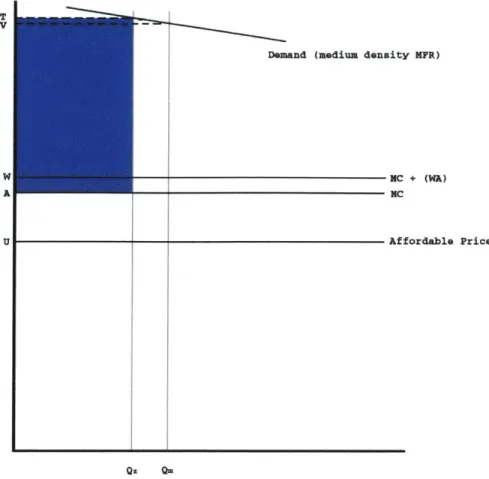
Figure A5. Profit of project with Density Bonus.
The rectangle formed by points WRXV is the first year profit of the project with the density bonus. In this case:
Rubin and Seneca Model inputs
rents $/Unit/yr. T $10,374 V $10,268 W $6,699 A $6,788 U $7,140
So the area of rectangle WRXV = (V-W) * (Qm) = (10,268-6,699)*(24) = $85,656
zoning
Qz Qm
density MFR)
Affordable Price
MC + (WA)
MC
Qz Qm
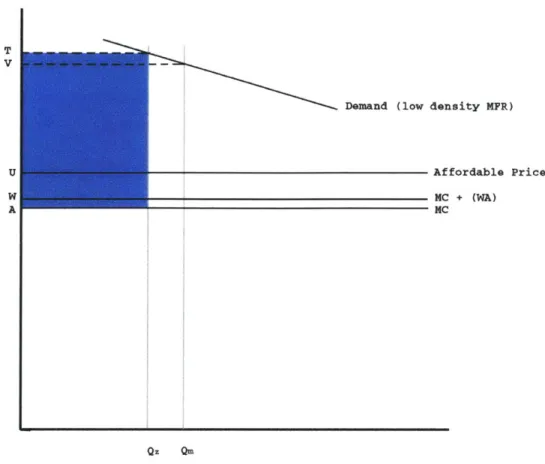
Figure A6. Profit of project without Density Bonus
The rectangle formed by points AKLT is the first year profit of the project without the density bonus. In this case:
Rubin and Seneca Model inputs
rents $/Unit/yr. T $10,374 V $10,268 W $6,699 A $6,788 U $7,140 zoning units/acre Qm
So the area of rectangle AKLT = (T-A) * (Qz)= (10,374-6788)*(19) = $68,134
T
.
V-I
Demand (low density MFR)U Affordable Price
W MC + (WA)
A MC
Qz Qm
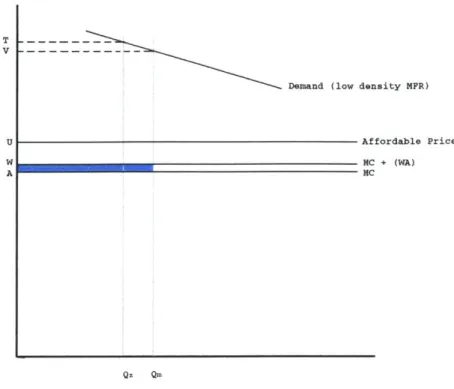
Figure A7. Subsidy of Affordable Units
The rectangle formed by points WANR is the amount of subsidy generated from the Market Rate units. In this case:
Rubin and Seneca Model inputs
rents $/Unit/yr. zoning units/acre
T $10,374 Qz 19
V $10,268 Qm 24
W $6,699
A $6,788
U $7,140
So the area of rectangle WANR = (W-A) * (Qm) = (6,699-6,788)*(24) = -$2,136
There is actually no subsidy. Incredibly, the developer was able to build affordable units at such low cost as to be able to make a profit on even the affordable units.
The Berkeleyan - Berkeley, CA
The Berkeleyan is a recently completed apartment building in Berkeley, CA. Berkeley is a dynamic city with a major university, many offices, retailing and a variety of housing types located just over the Bay Bridge from San Francisco. It has a young population due to the large numbers of students and young professionals and there is much demand for apartments throughout the city. Berkeley also has a very involved and 'progressive' population who often make development very difficult. The Berkeleyan in fact, was the first major downtown apartment building built since World War II according to developer
Patrick Kennedy.
Developer Patrick Kennedy and his company Panoramic Interests acquired the
Berkeleyan site in 1994 and spent three and a half years entitling and building the project. The project consists of 56 apartment buildings built over a ground floor retail and
parking. There are six one bedroom apartments and fifty two bedroom apartments. The market rate units rented for an average price of $1250 when originally rented. In
accordance with the model state statute and additional Berkeley affordable housing criteria, twenty percent of the apartments are set aside for moderate income renters who make 60% of the Area Median Income (AMI). These units are restricted to $625 per month. In exchange for the provision of these units, the developer was able to increase the size of the project from 42 to 56 units. This increase mandated an extra story beyond the originally zoned envelope. 8
The construction of The Berkeleyan is typical of apartment buildings built in more dense Northern California urban areas. The grade level parking and ground floor retail
establish a podium on top of which four stories of residential is built. The podium is constructed out of concrete and is type I construction. The residential structure above is type V wood framed construction. While the residential component of The Berkeleyan is the same construction type as Granite Place, The Berkeleyan's construction was much more expensive due to an increased structural complexity of a taller building and a mixed program. An important distinction can be made between the ways that the two projects employed the density bonus. Granite Place increased the density of the dwelling units without increasing the height of the buildings. The Berkeleyan increased density by building an additional story. This difference accounts for the increased construction cost of The Berkeleyan, which ended up at $130/SF.
The project is clearly well designed and a premium has been paid by the developer to build a project that will attract and retain discriminating
tenants to the project. The inclusion
of ground floor retail is not only another source of revenue but can be
seen as an urban amenity to the tenants above. Likewise, the innovative stacked parking system used in the project adds cost but allows for more parking in less space. It is the view of project developer Patrick Kennedy that while there is quite a bit of pent up
demand for rental apartments in Berkeley, projects that are attractive and well located are able to command a premium in the market and retain tenants more effectively. The
demographic of Berkeley supports the characterization of well-paid, educated and employed professionals, with discriminating tastes, setting the market prices.
Panoramic Interests acquired the site in 1994 for $400,000. Three and one half years of entitlement, design and construction followed. As mentioned previously, the cost of construction for this project was $130/SF. This figure is $15/SF higher than the inflation adjusted R.S. Means estimate for a building of this size, in this location. This
discrepancy between the Berkeleyan costs/SF and The R.S. Means estimate is likely due to the aforementioned design upgrades, the inclusion of a retail ground floor and the
stacked parking system. $15/SF seems reasonable for the upgrades that were built into the project and it appears that the developer, while not able to aggressively cut prices as
in the Granite Place case, was able to bring construction costs into accordance with industry standards. The fact that the project took three and a half years to entitle and construct is financially significant. Not only does this increased development time incur increased carrying costs of the land and professional fees, but the increased time period enlarges the opportunity cost of having the right to develop. In other words, this
opportunity cost to develop is accrued for three and a half years while the entitlement and construction process is navigated.
After the three and a half year development period, leases were signed in 1998 and the property was stabilized in that year. Market rate leases in the first full year of operation
averaged $1250 per month. Subsidized units averaged $625 per month. The following table summarizes the financial information regarding the development and stabilization of The Berkeleyan and a hypothetical project in the same location without using a density bonus for the provision of affordable housing.19
Figure BI.
Proj. wI Proj. wlo
density density
Physical Description bonus bonus
Lot Area (SF)
Building Area (SF) 41000 30750
# units 56 42
Allowed Zoning (# units) 56 42
Development Cost
cost / SF $130.00 $122.16
total construction cost 5,330,000 3,756,420
land cost 400,000 400,000
Total Development Cost $5,730,000 $4,156,420
Financial Description Rents / Price
unit type Market Rate $1,250 $1,250
unit type Below Market 650 based on 60% AMI
other income 2,500 1,875
Scheduled Rental Income Y1 $789,360 $652,500
As in the Granite Place case, the analysis of this case deviates from the Rubin and Seneca model predictions. The relationship between density and rent is inelastic and the
developer insists that there are density segments in the market. Patrick Kennedy
explained that in the Berkeley market, there is certainly not any reduction in rental value for a unit that is located within a project that is 25% larger when the project is still only a five story, 56 unit project. Mr. Kennedy, like the developer of Granite Place, supports the notion that the multi-family rental market is segmented into different tolerance groups of density rather than a smooth downward sloping relationship between density and rents as
suggested in the Rubin and Seneca model. While there may be reductions in rental value when projects grow beyond eighty or a hundred units, small to mid-size apartment buildings rents are inelastic with respect to density. The developer notes one other
interesting effect of adding another story. A unit that is located higher off of the street will often command a higher rental price. The increase in height afforded by the density
bonus at The Berkeleyan may have actually increased rental value for the additional market rate units. While there is no way to quantify this effect on this project other than to take the developer's word for it, it stands to reason that in an urban location where increased distance from the street and better views are valued, subsidized units can act as
20
a podium to build additional market rate units and thereby increase market rents.
The Berkeleyan brings up another important issue related to the use of density bonuses. Developer Patrick Kennedy related his concern that some of the tenants in the affordable units may decrease the value of the project by being bad tenants that may interfere with the enjoyment of the property by the rest of the tenants. Mr. Kennedy explains that one of the most important factors to success when mixing affordable housing with market rate housing is the careful selection of tenants. Often times, tenants in affordable housing projects can create problems by having unsavory friends, disturbing neighbors or having other anti-social behavior that infringes upon other tenants enjoyment. These types of tenants can have a tremendously negative impact on a project by driving away other tenants, decreasing tenant retention and thereby increasing vacancy. Mr. Kennedy
explains that careful tenant selection becomes even more important as the project becomes more dense and there is more interaction between tenants on the property.2 1
In contrast to the Granite Place case, the increase in density afforded by the provision of affordable housing increased construction costs in The Berkeleyan development. The density increase required an additional story and this increases the marginal cost of constructing additional units in accordance with the assumptions of the
Wheaton/DiPasquale model for optimal density. While the increased density in Granite Place defied the optimal density model with respect to construction costs by increasing
horizontal density rather than increasing vertical density, The Berkeleyan, with its increased vertical density, adheres to the assumption of the Wheaton/DiPasquale model. The estimate of the effect of this increased marginal cost using the R.S. Means estimators handbook is $12/SF. There is a slight decrease of $2/SF with the density bonus due to the increase in economies of scale. The net increase in square foot costs for the project that uses the density bonus in this location is $ 10/SF.2 2 The financial effect of the use of the density bonus in The Berkeleyan is outlined in Figure B2.
In contrast to the Granite Place Apartments, the use of a density bonus at The Berkeleyan has eroded the Net Present Value of the project by $139,345. If it were not for the requirement in Berkeley to use the density bonus, it is clear that profit-maximizing developers would choose not to receive an increase in density for providing affordable housing. In the case of The Berkeleyan, the city's mandate to use the law is actually another exaction placed on developers rather than being an incentive to spur
amount of bonus would have to be increased of there could be an decrease in entitlement time.
The table in Figure B4 shows the effect of a two year delay in the development process of The Berkeleyan. Actual rents, costs and time periods were used in the series of cash flows. A hypothetical series of costs and rents, reduced for inflation with a one and a half year development time period rather than a three and a half year period are represented in the second series of cash flows. The purpose is to quantify the reduction in NPV with a
development that is prolonged by two years. This figure is purely the opportunity cost to the project and does not account for any actual costs such as carrying costs, legal fees and
redesign fees that are often part of a prolonged entitlement process.
With this analysis, we can conclude that a major incentive that the city of Berkeley could use to spur development is the expedition of the entitlement period. In addition to the reduction in legal, design and carrying costs, the expedition of entitlements would add
$666,847 to the Net Present Value of the project. This amount represents an increase of 60%.
By analyzing The Berkeleyan at the Equity Before Tax Cash Flow level we can see the effect of leverage on the project. As was saw in the Ganite Place case, the effect of the density bonus is magnified when leverage is introduced. In the case of The Berkeleyan we have assumed a 100% equity purchase of the land and a 25% equity contribution to
the construction loan. With these assumptions we have a result of a $236,729 decrease in Net Present value due to the density bonus. Figure B3 outlines these values.
Again, it is important to remember that the project without the bonus is merely
hypothetical in this case since the City of Berkeley required the inclusion of affordable housing in this development. Nonetheless, it is interesting to see the resulting decrease in value associated with what is intended to be a developer incentive.
Several conclusion can be drawn from the analysis of The Berkeleyan development. First, it is clear that in this case, the density bonus statute acted as an exaction rather than
an incentive. If it were not for the city's inclusionary housing requirement, this
development would have ignored the law and developed a project with 100% market rate units. The reason for this is clearly the increase in construction costs that resulted from adding density. If the same construction costs are used to determine development costs and these figures are used in a discounted cash flow analysis in the same manner as figure B2, the density bonus has a positive net present value effect of $60,000. Likewise, the Rubin and Seneca model with inputs from The Berkeleyan shown in figure B5, keeps construction costs constant as density increases and predicts a positive increase to profits
of $215,656-$193,620=$22,036 in first year profit.
The increase in construction costs as density increases, predicted in the
Wheaton/DiPasquale model but not accounted for in the Rubin and Seneca model, absorb all of the positive financial impacts of the density bonus.
The Berkeleyan further supports the notion that there is a segmented relationship between density and rental prices. In a similar way to the Granite Place case, the Berkeley rental market shows a tolerance for density that runs counter to the assumptions of the Rubin and Seneca model. The downward sloping demand curve predicted in the model is in the case of Berkeley very slight in its slope. Developer Patrick Kennedy's assertion that in some cases the slope of this relationship may even be positive is an extremely interesting finding that could become an important part of the density bonus incentive on certain projects who are able to take advantage of market demand for views and increased
distance from the street.
Another important conclusion reached from the analysis is the importance of time in the development process. While it is widely understood in the industry that time is a very important factor in real estate development due to carrying costs and the opportunity costs of capital, the analysis of The Berkeleyan shows an opportunity for local planning authorities who want to promote affordable housing. The model statute gives developer's an "as of right" increase in density for the inclusion of affordable housing in accordance with the statute. Many local communities, Berkeley being among them, can still be
extremely difficult to develop in even with the "as of right" distinction. In fact, as Mr. Kennedy noted that "nothing in Berkeley is as of right", local planning agencies could reduce the entitlement period of projects that conform to the state law, perhaps by approving the project at the staff level, great savings could be realized by the
Berkeleyan, figure B4 indicates that a two year reduction in development time would have resulted in a $666,847 increase in Net Present Value.
Figure B2.
Market Rate discount rates, cap rates and growth rates
development 22.92% based on Geltner Canonical Method construction 4.25% based on risk free rate plus 100 BP stabilized operation 8.75% based on r = y + g
using the WACC
% equity of project cost 30.24%
equity OCC stabilized 14.52%
growth rate of rents Capitalization rate
2.25% 6.50%
rates are taken from market data and historical figures
10 yr Property Before Tax Cash Flow Schedule (assumes 5% vacancy, 5% management fee, 10% capital improvement reserves, insurance andtproperty taxes)
project w/ bonus
project w/o bonus
project w/ bonus project w/o bonus
Y10 w/
Development Time 0 Yrl (time T) Yr2 Yr3 Y4 Y5 Y6 Y7 Y8 Y9 reversion
Period 3.5 yr. based on Y11
(400,000) (5,330,000) $540,154 554,518 569,206 584,224 599,581 615,282 631,337 647,754 664,539 $11,169,434 (400,000) (3,756,420) $459,256 471,181 483,374 495,841 508,589 521,624 534,952 548,580 562,515 $9,450,042
project w/ bonus project w/o bonus 1,097,573 1,236,918 ($139,345) 14.36% 16.81% NPV
Figure B3.
Analysis of Equity Returns to Owner (PBTCF - Debt service)
10 yr Equity Before Tax Cash Flow Schedule (assumes 7% interest only loan, 10 yr ter Development Time 0
Period 3.5 yr. project w/ bonus
project w/o bonus
Yrl (time T) Yr2 (400,000) (1,332,500) $167,054 $181,418 $1 (400,000) (939,105) $196,306 $208,231 $2 m) Y10 W/ Yr3 Y4 Y5 Y6 Y7 Y8 Y9 reversionY11 proiected rents 96,106 $211,124 $226,481 $242,182 $258,237 $274,654 $291,439 $5,466,334 20,424 $232,892 $245,640 $258,675 $272,003 $285,631 $299,566 $5,430,672 project w/ bonus project w/o bonus
$141,598 $378,327
project w/ bonus project w/o bonus
19.24% 24.18% Wealth effect to Equity Owner ($236,729)
Figure B4.
Effect of 2 year delay on project that uses a density bonus.
10 yr Property Before Tax Cash Flow Schedule (assumes 5% vacancy, 5% management fee, 10% capital improvement reserves, insurance and property taxes) Development Time 0
Period Yrl (time T) Yr2
Y10 w/
reversion
Yr3 Y4 Y5 Y6 Y7 Y8 Y9 based on Y11
projected rents project w/ bonus and delay
project w/ bonus no delay
(400,000) (5,330,000) $540,154 554,518 569,206 (400,000) (5,098,009) $516,643 $530,382 $544,431 584,224 599,581 615,282 $558,796 $573,483 $588,502 631,337 647,754 664,539 $11,169,434 $603,858 $619,560 $635,615 $10,683,279 NPV
project w/ bonus and 2 year dele $1,097,573 project w/ bonus and w/o delay $1,764,419 Wealth effect of Delay ($666,847)
project w/ delay project w/o delay NPV
14.36% 14.30%
T
W
A
Demand (medium density MPR)
MC + (WA)
KC
Affordable Price
Qz QM
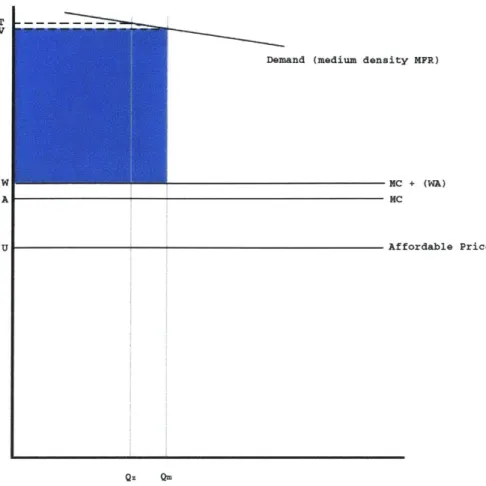
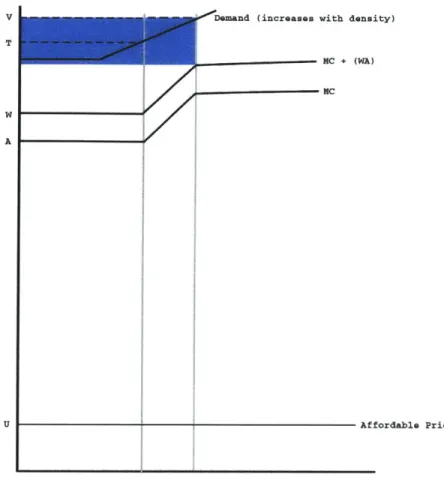
Figure B5. Profit of project with Density Bonus
The rectangle formed by points WRXV is the first year profit of the project with the density bonus. In this case:
Rubin and Seneca Model inputs
rents $/Unit/yr. T $15,536 V $15,633 W $11,782 A $10,926 U $7,500 zoning Qz Qm units/acre
So the area of rectangle WRXV = (V-W) * (Qm) = (15,633-11,782)*(56) = $215,656
Figure B6. Profit of project without Density Bonus
Demand (medium density MFR)
W KC + (WA)
NC
U7
Affordable Price
Figure B6. Profit of project without Density Bonus
The rectangle formed by points AKLT is the first year profit of the project without the density bonus. In this case:
Rubin and rents T V
W
A USeneca Model inputs $/Unit/yr. $15,536 $15,633 $11,782 $10,926 $7,500 zoning Qz Qm units/acre
So the area of rectangle AKLT = (T-A) * (Qz) = (15,536-10,926)*(42) = $193,620
The discrepancy between the results of Figure B5 and B6, which indicate that the use of a density bonus is profitable, and the results of the DCF analysis in Figure B2 is due to the
assumed flat Marginal Construction Cost curve used in the Rubin Seneca model. If we were to adjust for that, as we will in the next case, we would see a more accurate picture.
[
Demand (medium density NFR)w. NC A NC Ul Aft QX QM + (WA) fordabe Price
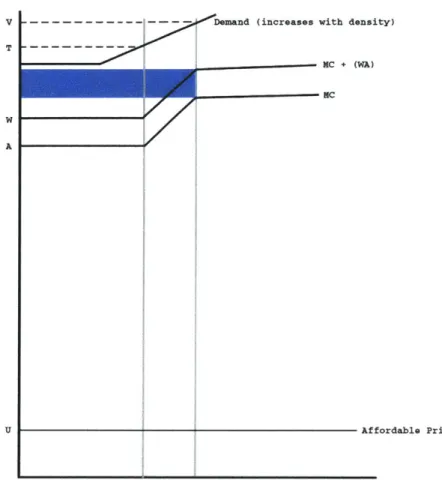
Figure B7. Subsidy of Affordable Units
The rectangle formed by points WANR is the amount of subsidy generated from the Market Rate units. In this case:
Rubin and Seneca Model inputs
rents $/Unit/yr. zoning units/acre
T $15,536 Qz 42
V $15,633 Qm 56
W $11,782
A $10,926
U $7,500
The Egyptian - San Diego, CA
The Egyptian is a multi-family development currently underway in San Diego, California. The project is located in the trendy Hillcrest neighborhood of San Diego. Hillcrest has seen much improvement and gentrification over the last twenty years and home values have risen faster than greater San Diego. The community enjoys close proximity to downtown and a lively entertainment scene of its own. Over the last twenty years, young professionals, artists and the gay community have all flocked to Hillcrest
creating demand for apartments and condos.
CityMark Development was founded committed to focus on small and unique urban properties. The three principals all had backgrounds in large institutional REITs that focused on multi-family real estate. CityMark is committed to projects that benefit the community and are planned with a long-range vision. The selection of the % acre lot Egyptian site at University and Park Blvd. in Hillcrest represents this smaller, infill development strategy. As the case analysis will show, the decision to pursue a density bonus for the inclusion of affordable housing is evidence of CityMark's commitment to community goals rather than its effort to maximize profits.
CityMark acquired the site for $2.8 million in December of 2002. The development team is now completing the entitlement process and expects the total development time to be 1 year and nine months. The expected date for project stabilization is September of 2004.
The land was purchased with an original pro forma of 64 units, which is the maximum zoned number of units without using the density bonus. Early in the entitlement process,
CityMark analyzed the impact of the density bonus and decided to include seven 'very-low' income units in order to use a 25% density bonus increasing the total number of units in the project to eighty. These seven 'very-low' income restricted units would be affordable to tenants earning less than 50% of the Area Median Income (AMI).
CityMark's analysis indicate that while there was no increase in profitability due to the density bonus, there was a substantial benefit to the community. San Diego, like much of coastal California is suffering from a lack of affordable housing and CityMark's long range commitment to the local community encouraged them to use the bonus in spite of its lack of economic benefit.24
The Egyptian is being develop as a seven story building with some ground floor retail and residential units above. While the below market units are
going to be rented, the market rate units are planning to be sold as condominiums. The for market units in The Egyptian development are selling at prices ranging from $300,000 for one bedroom condominiums to over $600,000 for the larger penthouse
condominiums. This building type is slightly larger than the typical development in the Hillcrest area of San Diego.2 5 This building type is consistent with much of what is being