40 TEACHING MATHEMATICS AND ITS APPLICATIONS Volume 12, No. 1, 1993
The Guide and the Asymptote
THEODORE EISENBERG and TOMMY DREYFUS
BEING able to gestalt the graph of an equation is one of the most important goals of the school mathematics curriculum. It would be nice if students were able to
- "see" the minimum of y = x2 + 4 without
having to differentiate the function;
- conclude without computation that J!_ [ xex ' dx
is zero;
- determine that l i m ^ ^ , f(x) = L and g{x) =
f(x + 3), imply limx^m g(x) = L.
Solutions to problems such as these rest upon having a visual concept image of functions and mathematical notions defined on them (e.g., trans-lation or differentiation). Such a visual concept image includes being aware that the graphs of differentiable functions are smooth, that the value of a derivative at a point gives the slope of the line tangent to the function at that point, that definite integrals of positive-valued func-tions can be thought of in terms of areas, that the roots of real-valued functions can be thought of as those points where the function crosses the x-axis, and that equations of the form
a2(x - h)2 + b2(y — k)2 = a2b2 are those of ellipses. The list could be continued indefinitely, but its message is that stressing visual images of functions and notions defined on them could be, and should be, at the heart of the curriculum.
One of the most effective moments to get students to start thinking visually is when sketching the graphs of rational functions y =f(x)/g(x) where
f(x) and g(x) are polynomials that are factorable
into linear terms. This class of functions is particu-larly instructive because an interesting dilemma arises that many experienced teachers seem unable to resolve.
Rational functions
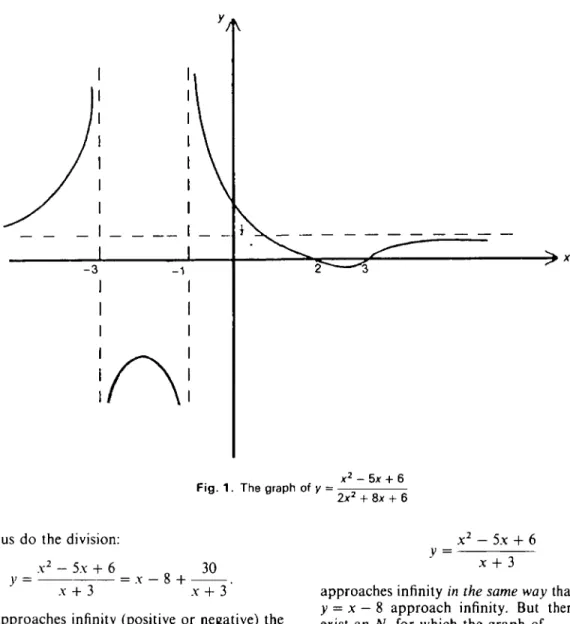
In sketching the graph of, say,
_ x2 - 5.x + 6 _ (x - 2)(.x - 3)
} ~ 2x2 + 8.x + 6 ~ (2.x + 2)(x + 3) an experienced person immediately sees that the
graph goes through the point (0, 1); that 2 and 3 are zeros of y; that x = — 1 and x = — 3 are vertical asymptotes; and that as x approaches negative 1 from the right (x -> — 1+) the values of y approach
+ 00, but as x -> — 1 ~ the values of y approach — co. For very large positive (or small negative) values of x the numerator behaves like x2 and the
denominator behaves like 2x2.
approaches + co, the graph of
Therefore, as x
y =
x2 - 5x + 6
2x2 + 8x + 6
behaves like that of
2x2
The line y = 1/2 is a horizontal asymptote and the graph looks something like that in Fig. 1.
This type of analysis leaves many open questions about the graph; e.g., where is the function increasing and decreasing, does it have extrema, and what are its domains of concavity and convexity. But this type of analysis gives the student an intuitive feeling for the global properties of the graph. We contend that being able to gestalt graphs globally in this manner is an extremely important skill for students to master.
Now consider the expression
y =
x2 - 5x + 6
x + 3
We see that x = — 3 is a vertical asymptote, x = 2 and x = 3 are zeros, and that, for extremely large positive (small negative) values of x, the graph approaches +oo. But how does the graph approach infinity, quickly, slowly, monotonically or not? Using the same type of analysis as above, we see that y = (x2 - 5x + 6)/(x + 3) behaves as
y = x2/x = x. That is, y = (x2 - 5x + 6)/(x + 3)
approaches infinity in the same manner that y = x approaches infinity. Many students then conclude that y = x is a non-vertical asymptote of the graph.
TEACHING MATHEMATICS AND ITS APPLICATIONS Volume 12, No. 1, 1993 41
- 3 - 1
Fig. 1 . The graph of y = x2 - 5x + 6
2x2 + 8x + 6
Let us do the division: .v2 - 5.x + 6
y =
x + 3 = x - 8 +
30
As .x approaches infinity (positive or negative) the fraction 30/(.x + 3) approaches 0. So,
x2 - 5.x + 6
.x + 3 - = x - 8 + 30
behaves like y = x — 8 for large positive (or small negative) values of x. It approaches infinity as
y = x — 8 approaches infinity. Many students then
conclude that y = x — 8 is a non-vertical asymptote of the graph.
Well, which is it: y = x or y = x - 8? When asked, students got confused and even many experienced teachers seemed unsure of themselves on this point.
The guide and the asymptote
The two lines y = x and y = x — 8 are parallel to one another, and the graph of
x2 - 5.x + 6
y =
approaches infinity in the same way that y = x and
y = x — 8 approach infinity. But there does not
exist an No for which the graph of
y =
c2 - 5x + 6
x + 3
is infinitesimally close to that of y = x, for all x > No. That is, the line y = x guides the curve on its route to infinity, but it is not an asymptote for the curve. The line y = x — 8 is its asymptote, because it can be shown that the curve gets infinitesimally close to it as x tends to infinity. That is, for every e > 0, there is an /Vo such that for all
x > JV0 we have
x2 - 5x + 6
x + 3 - (x - 8)
< £.
The requirement of guiding the curve as x tends to infinity is often less stringent than that of being an
42 TEACHING MATHEMATICS AND ITS APPLICATIONS Volume 12, No. 1, 1993
asymptote. For example, for the rational function
y =f(x)Jg{x), if the degree of the polynomial
/ ( x ) = 2^7=o 0f*"~' is n, and the degree of the polynomial g(x) = Y7=o bf*m~' is m, and n > m,
then the guide could thus be denned as the first term in the possibly infinite expansion of the function in terms of powers of x. If we take this as the definition of the guide, then obtaining the guide is usually much easier than obtaining the asymptote, and for the practical purpose of globally sketching a graph it is often good enough.
Obtaining the guide
If the degree of the polynomial / ( x ) = £"_0 a,x""'
is n, and the degree of the polynomial g(x) =
Y7-ob,xm~' is m, then the guide of the rational function y =f{x)/g(x) is
This is a monomial with positive exponent if the degree n of/(x) is larger than m, the degree of g(x); it is a constant if the degrees are equal, and it is monomial with negative exponent if n < m.
Obtaining the asymptote
If the degree n o f / ( x ) is greater than the degree
m of g(x), and if we write / ( x ) = h{x)-g{x) + r(x)
with the degree of r(x) being less than the degree of g(x), then y = h(x) is the asymptote. If n = m, then the horizontal asymptote is identical to the guide. But if n < m, the asymptote is the x-axis.
This notion of the guide versus the asymptote leads to an interesting situation. If n > m, the guide gives less precise information than the asymptote about the behaviour of the function for large x, but it is easy to compute and the information it gives
is usually sufficient for an immediate understanding of how the graph is approaching infinity. If n = m, then the guide and the asymptote are identical. But if n < m, then the guide, which is still very easy to compute, gives more information than the asymptote, for one only knows that the asymptote is the x-axis, but the guide tells one how the graph approaches the x-axis.
Making analyses similar to the above and resolving the apparent dilemmas are important skills for our students to develop. Such exercises bring us one step closer to developing in our students a sense for functions.
Theodore Eisenberg is Professor of Mathematics and of Education at Ben-Gurion University of the Negev. Born and educated in the United States, he completed his PhD degree at the University of Maryland in 1970. He emigrated to Israel in 1977. Academic interests include problem solving, visual processing of mathematical ideas, and mathematical concept formation.
Tommy Dreyfus is Professor of Science Teaching at the Holon Center for Technological Education, an institute that is affiliated with Tel Aviv University. He is also a member of the mathematics group in the Department of Science Teaching at the Weizmann Institute of Science. Born and educated in Switzerland, he completed his Docteur des sciences physiques degree at the University of Geneva in 1975, and then emigrated to Israel. Academic interests include researching cognitive development based on computer microworld environments and visual pro-cessing in mathematical thinking.
Address for correspondence: T. Eisenberg,
Depart-ment of Mathematics, Ben-Gurion University, P.O.B. 653, Beer Sheva 84105, Israel.