COST-BENEFIT ANALYSIS OF
HEPATITIS-B VACCINATION
A Computerized Decision Modei
for Spain
Bengt Jonsson
Linkoping UniversityBruno Horisberger
Interdisciplinary Research Center for Public Health
Miguel Bruguera
University of Barcelona
Lukas Matter
University of Bern
Abstract
The availability and efficacy of recombinant deoxyribonucleic acid yeast-derived hepatitis-B vaccine, at a price much lower than the previously available plasma-derived hepatitis-B vaccines against hepatitis-B virus infections, motivate a new cost-benefit analysis of hepatitis-B vaccination. Spanish data were used to calculate direct and indirect costs of hepatitis-B infection and the costs and benefits of different vaccination strategies in defined risk groups of the Spanish population. A vaccination program will re-duce direct expenditures for hepatitis B if the attack rate in the target population is higher than 4.9%. If indirect costs are included, the threshold for cost saving is reduced to 0.9%. The results are sensitive to the price of the vaccine, the duration of protection, assumptions about consequences for quality of life, and to indirect costs.
Viral hepatitis is a major public health problem. It is an acute inflammation of the liver caused by hepatitis-A, hepatitis-B, hepatitis-C, hepatitis-D, and hepatitis-E viruses. Knowledge of its etiology and epidemiology is limited, mainly because of the high incidence of asymptomatic or anicteric infections. In most countries, hepatitis is un-derreported. Well over 50% and perhaps as much as 75% of infections with hepatitis viruses are not diagnosed.
Viral hepatitis B is clinically the most important type, with the highest rates of complications, morbidity, and mortality. Exposure to hepatitis-B virus (HBV) usually
Valuable help and support was provided by Dr. R. Najera Morrondo and Dr. J. Mateos, Centro Nacional de Microbiologia y Virologia in Majadahonda, Madrid. We are also grateful to F. Andersson and B. Giin-tert for efficient research assistance. Funding from Smith Kline & French is gratefully acknowledged.
Jonsson et al.
results in a self-limiting infection that may be symptomatic (with jaundice) or asymp-tomatic (subclinical) and therefore usually goes unrecognized. The rate of resolution to age dependent (48). In the USA 5-10% of infections do not resolve within 6 months; these individuals become virus carriers.1 A protracted course of infection may lead to cirrhosis of the liver or to hepatocellular carcinoma. According to a report of an international group of experts, it is estimated that there are 200 million carriers of HBV in the world (45).
Viral hepatitis is an occupational hazard for many health care personnel. All coun-tries also report high rates of infection among intravenous drug abusers, prostitutes, and homosexuals. Newborns of HBsAg carrier mothers are at high risk of infection (vertical transmission). The staff of certain closed institutions, such as prisons, may also be exposed to a higher risk of infection.
Hepatitis B represents a major problem in public health, especially in countries with intermediate and high rates of prevalence of the disease. In these countries, neo-natal and childhood infections are frequent, with an especially high risk for chronic sequelae. In addition to its widely recognized medical and epidemiological importance, policymakers and health economists have developed a growing awareness of the eco-nomic burden of the disease on society (16;21;39).
The first vaccine against hepatitis B was introduced in 1982. Because of its very high price, about US $100 per person vaccinated, cost became one of the most impor-tant determinants of vaccination strategies. A well-timed cost-effectiveness study was published in 1982 by Mulley et al. (31). For a summary of different cost-benefit and cost-effectiveness studies of hepatitis-B vaccination, see Jonsson (24). Recently, a new generation of vaccines, produced by recombinant deoxyribonucleic acid (DNA) tech-nology, dramatically increased the availability and reduced the price of the vaccine. This has made it necessary to reexamine existing vaccination strategies and develop new policies. Therefore, it is timely to repeat the cost-benefit studies with new epide-miological data and new prices. At the same time, there is a need to incorporate methodo-logical developments in the economic evaluation of health care technologies.
The purpose of this study is to present a model for benefit and cost-effectiveness analysis of hepatitis-B vaccination and apply the model to the existing epidemiological and economic situation in Spain. The intention is that the study will be helpful in developing rational vaccination strategies for hepatitis-B vaccination.
COST-BENEFIT AND COST-EFFECTIVENESS OF DIFFERENT VACCINATION STRATEGIES
In a review of the literature on benefits and costs of human vaccinations in developed countries, Weisbrod and Huston (46) concluded that the most telling finding from their survey was the absence of a standardized methodology for evaluating vaccina-tion programs. They identified a number of common methodological mistakes; for example, studies overlooked costs in the form of side effects, costs of administration of the vaccine were undervalued, and costs of pain and suffering associated with the disease were omitted from the study.
In this study, we incorporated the methodological standards of Weisbrod et al. as far as available data allowed. We included reduction in health care expenditures, reduction in indirect costs, and improved health as benefits from vaccination. We also included the costs of patients' time even when it was difficult to give an exact price. A general model was used for the cost-benefit estimates and applied to a major risk group, health care personnel. The costs of screening and vaccination were identified,
quantified, and valued. Benefits in terms of a reduction in health care costs, reduced indirect costs, and improved health were introduced successively. Estimates of costs and benefits were undertaken using a computerized decision model, and sensitivity analysis was performed.
EPIDEMIOLOGY OF HBV INFECTION AND THE EFFICACY OF VACCINATION
The prevalence of HBV markers in the unselected Spanish population has been esti-mated between 7% and 22% (average 17%), or 2.7-8.6 (average 6.5) million people (9;10;12;13;18;27;38). According to data from newly recruited blood donors and preg-nant women, the prevalence of HBsAg is 0.5-2.2% (average 1.5%), a number that cor-responds to between 200,000 and 860,000 (average 585,000) people nationwide (8;10;12;13;18;27;38). This fraction of the population includes recent as well as chronic infections. About 32.5 million of the Spanish population are therefore susceptible to HBV infection.
The incidence of HBV infection in the unselected Spanish population has been estimated at about 0.2%, or 65,000 new infections per year (8;42). One fifth, or 13,000, of these are expected to present with jaundice. About half of all new cases occur in under-25-year-olds, and two-thirds are encountered in the economically active strata of the population. More precise information is obtained by estimating the incidence of HBV infection in risk groups that have been studied in detail (9;10;ll;12;13;17;18; 27;28;38).
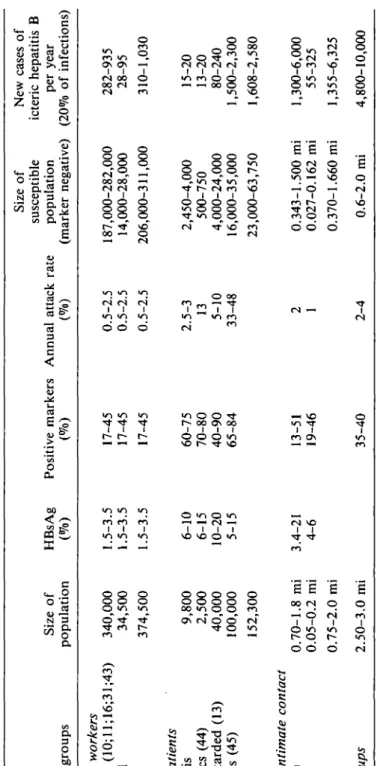
A synopsis of the estimated size of some segments of the Spanish population at increased risk of HBV infection is shown in Table 1. The annual attack rate, that is, the percentage of newly infected persons in a segment of the population per year, and the prevalence of any marker for HBV infection are the bases for this estimate. The attack rate is only rarely obtainable from studies in Spain; therefore, published data from comparable populations in other countries have to be taken into account in ac-cordance with the available information on HBV markers in the corresponding Spanish populations. It is evident that a certain prevalence of positive markers may be attained slowly with a relatively low annual attack rate (e.g., hemodialysis patients) or more rapidly with a higher attack rate (e.g., hemophiliacs, drug addicts).
For health care workers (HCWs), the risk of acquiring an HBV infection depends on their area and type of work. Only very small segments of this group may have an annual attack rate above 2% (9). For about 30% of HCWs, an annual incidence of 1-1.5%, or around five times that of the general population, can be anticipated (8;38), but the majority, 60% of HCWs, has an annual incidence below 1% (38).
Therefore, an average estimate of the attack rate for all HCWs in Spain should not exceed 1%. Vaccination of subgroups of HCWs in special high-risk departments is, however, questionable because frequent changes of personnel between departments make such an approach complicated and inefficient. Young HCWs who are in contact with patients or bodily fluids should be offered the vaccine irrespective of the service on which they are working at a certain time. In order to economize on an immuniza-tion program for HCWs, those with less than 4 years of professional activity should not be screened before vaccination, because such a screening strategy would not be cost-effective (9;38).
In many studies of hepatitis B in HCWs, specialized services such as hemodial-ysis, surgery, or obstetrics may comprise a larger than average proportion of persons with long professional experience (38) who are not readily comparable to younger control
Tabl e 1 . Estimate s o f HB V Infectio n i n Spai n (Selecte d Ris k Groups ) Populatio n group s Health care workers In hospital s (10;ll;16;31;43 ) Nonhospita l Tota l High-risk patients Hemodialysi s Hemophiliac s (44 ) Mentall y retarde d (13 ) Dru g addict s (45 ) Tota l Persons in intimate contact Famil y (8;9 ) No n famil y Tota l All risk groups Siz e o f populatio n 340,00 0 34,50 0 374,50 0 9,80 0 2,50 0 40,00 0 100,00 0 152,30 0 0.70-1. 8 m i 0.05-0. 2 m i 0.75-2. 0 m i 2.50-3. 0 m i HBsA g (% ) 1.5-3. 5 1.5-3. 5 1.5-3. 5 6-1 0 6-1 5 10-2 0 5-1 5 3.4-2 1 4-6 Positiv e marker s (% ) 17-4 5 17-4 5 17-4 5 60-7 5 70-8 0 40-9 0 65-8 4 13-5 1 19-4 6 35-4 0 Annua l attac k rat e (% ) 0.5-2. 5 0.5-2. 5 0.5-2. 5 2.5-3 13 5-1 0 33-4 8 2 1 2-4 Siz e o f susceptibl e populatio n (marke r negative ) 187,000-282,00 0 14,000-28,00 0 206,000-311,00 0 2,450-4,00 0 500-75 0 4,000-24,00 0 16,000-35,00 0 23,000-63,75 0 0.343-1.50 0 m i 0.027-0.16 2 m i 0.370-1.66 0 m i 0.6-2. 0 m i Ne w case s o f icteri c hepatiti s B pe r yea r (20 % o f infections ) 282-93 5 28-9 5 310-1,03 0 15-2 0 13-2 0 80-24 0 1,500-2,30 0 1,608-2,58 0 1,300-6,00 0 55-32 5 1,355-6,32 5 4,800-10,00 0 Abbreviation: m i = million .
groups because their exposure to HBV may have been unrelated to the profession and due rather to an increased incidence of infection in earlier decades (cohort effect). This aspect pertains to estimates of the current incidence of HBV infections in other risk groups as well as the general population (7). Thus, recent campaigns against the spread of HIV promoting the safe handling of patients' bodily fluids (14), rigorous testing and processing of all blood products for safety with respect to viral transmis-sion, advice against sharing of needles by drug addicts, and the promotion of "safer sex" should have an impact on the incidence of HBV infections. But since all available data on hepatitis B originate from studies performed several years ago, the estimates tend to be too high. This aspect must be taken into account by cost-benefit analyses. Large-scale protection of the intimates or family members of patients with hepa-titis B is rather cumbersome because of the need to trace and test individuals who might have been exposed, some of whom may already be in the incubation period of the infection. The addition of hyperimmune gamma globulin to vaccination adds considerably to the cost of such preventive action. Furthermore, active immunization is only needed for contacts of patients with chronic infection; the evaluation of the indication for active and/or passive immunization has to be judged individually by the physician of the index case. The impact of such measures on the overall incidence of hepatitis B nationwide is questionable. Cost-benefit analyses in this group have to take into account the high costs for administration and work time lost. As with other sexually transmitted diseases, attempts at control are fraught with difficulties. An important group of new cases of HBV infections are newborns of HBsAg-positive mothers. Intrauterine infections are extremely rare. The rate of perinatal trans-mission depends on the infectivity of the mother, which is highest in HBeAg-positive mothers. In Spain, only about 7% of carrier mothers are HBeAg positive (18). An estimated average risk of perinatal transmission of 25% results in about 1,000 infected newborns per year. Carriers in Southeast Asia or Africa or drug addicts with HBV infection have a higher rate of HBe antigenemia (50-70%) (32). A target population of special interest in Spain are newborns of gypsy families (3;17). These estimates are consistent with data on the prevalence of HBV markers (31%) in children of HBsAg-positive mothers (18). The importance of HBV infections in this age group lies mainly in the high rate of chronic infection, which helps to perpetuate endemicity (15;26;40). A nationwide vaccination program for these newborns seems feasible, because screening for HBsAg during pregnancy or at term could be organized in accordance with testing of blood donors, thus reducing the costs. In addition, pre- and postnatal care of mothers as well as ongoing vaccination programs for infants will facilitate access to this risk group. Adding hyperimmune gamma globulin to active immunization, al-though not required, does improve protection of perinatally exposed newborns (26). Immunogenicity and Protection of HBV Vaccine
The immunogenicity of plasma-derived as well as recombinant HBV vaccines depends on the age and underlying diseases of the vaccinee as well as the vaccination schedule (41;43). After complete courses of HBV vaccination in healthy young adults, antibody concentrations above 10 IU/L can be expected in at least 95% of the vaccinees. The persistence of antibody levels above this threshold depends on the initial antibody titer achieved (19). Side effects are minimal, and it is even difficult to find statistically sig-nificant differences between vaccinated persons and those treated with placebo (41;43). Protection from all HBV-related events, including asymptomatic seroconversion, has been reported to be between 75% and 86% in healthy persons, depending on the
Jonsson et al.
initial antibody response (range 21-97%) (19;41;43). Some protection has even been observed in nonresponders. HBV infections occurring in spite of vaccination take a more benign course than those in nonvaccinated persons. Thus, the average protection from becoming a chronic carrier has been estimated at about 90% (25-100%) (19). The duration of protection depends on the immune response to the vaccination. In general, immunocompetent vaccinees can expect protection from HBV infection for at least 5 years. This is certainly a reasonable time span to work with in cost-effectiveness analyses. For hemodialysis patients, the protection is only about half that of normal adults.
OUTLINE OF THE MODEL Main Assumptions
The general model includes opportunities for screening, postexposure prophylaxis, and variations in compliance with the vaccination schedule. Because screening is manda-tory in public vaccination programs for hepatitis B in Spain, the model starts with a decision node for the alternatives "screen" and "not screen." The costs of a possible infection with HBV vary according to the patient's history (not screened vs. screened, not vaccinated vs. vaccinated, etc.), and according to the degree of severity of the clin-ical consequences of infection.
Postexposure Prophylaxis
For unvaccinated persons, hepatitis-B vaccine series are initiated after accidental ex-posure. If the source is positive, one dose of hepatitis-B immune globulin is also given (1). Instead of vaccination, it is common to give one dose of HBIG immediately and a second dose of HBIG if screening confirms that the source was positive and the victim negative.
Saenz Gonzalez et al. (37) reported 1,980 cases of accidental exposure per 100,000 hospital employees. Screening of both source (HBsAg) and victim (HBsAg, anti-HBs, and HBc) was undertaken, and HBIG was injected. The result of testing was that 80% of victims and 50% of sources were negative. For zero-negative victims and positive source, a second dose of HBIG was injected; approximately 40% of the victims fit this scenario.
Postexposure prophylaxis with vaccination reduces the costs of screening, as only the source is screened. It also reduces the costs for HBIG. Because the costs of one series of vaccinations are less than one dose of HBIG, the total cost of this strategy is lower. The expected costs for postexposure prophylaxis are 11,650 pesetas for vacci-nation and 16,500 for prophylaxis in the screening/vaccivacci-nation strategy. But discus-sion of this method will only complicate the model and not significantly affect the result of the analysis.
Postexposure prophylaxis is only relevant for hospital staff or other personnel in contact with contaminated material (syringes, needles, blood, etc.).
Compliance with the Vaccination Program
Compliance with a vaccination program is dependent on the target group, the efforts made, and the resources used to produce a high compliance. Studies of compliance have shown that not more than 50% of the hospital staff who were screened and found negative accepted vaccination. One reason for this could have been fear of AIDS. Now that a genetically produced vaccine is available, there should be less fear. Therefore, we will assume a 90% compliance for the first dose, 85% for the second, and 80%
for the third. Sensitivity analysis will be performed with a lower rate of compliance. For vaccination of newborns of carrier mothers, we can probably assume an even higher compliance, close to 100%, because of the special situation in which such a program is implemented. For high-risk patients we can also assume a high compliance rate, while other risk groups, for example, drug addicts, can be assumed to have a rather low com-pliance rate. Because low comcom-pliance means that there are costs without (or with re-duced) benefits, the level of compliance is important for the cost-effectiveness of a vaccination strategy.
We assumed that the probability of infection is reduced 20% after the first dose, 50% after a second dose, and 90% after a third dose. For persons receiving only one dose, this is equivalent to the assumption that they, on average, have received protec-tion for 1 year. Sensitivity analyses will be undertaken with the values 33%, 67%, and 98%, respectively.
Side Effects
When Mulley et al. (31) undertook their study, about 6,000 people had been vacci-nated. No serious adverse effects had been reported, but they estimated that a serious reaction would occur with a frequency of 1 in 100,000 and that 10% of serious reac-tions would be fatal. Approximately 100 episodes of severe illness have been reported among 750,000 vaccinees (31).
Therefore, it is reasonable to conclude that serious side effects of the vaccine have not been underestimated. If one assumes a frequency of 1 in 100,000 for a serious reaction, and the costs of a serious reaction to be 350,000 pesetas (US $1 = 115 pesetas), this will add only 3.5 pesetas to the cost of vaccination.
Minor side effects, such as a transient fever or a sore arm, have occurred among approximately 25% of both vaccine and placebo recipients participating in clinical trials (31). The medical costs associated with these reactions are probably negligible. However, for the sake of completeness, we calculated that 1 person in 10 with a minor side effect will make an extra visit to a physician, which will cost 6,000 pesetas. These complications will add 150 pesetas to the costs of vaccination. Rivera et al. (34) esti-mated the costs of complications at 132 pesetas per vaccinated person, which accounted for 0.9% of an estimated total vaccination cost of 14,108 pesetas.
Externalities: Reduction in the Probability of Secondary Infection
Vaccination reduces not only the probability of infection for the vaccinated person but also the probability of other persons being infected. This benefit is important, particularly in vaccination programs for drug addicts and for children of carrier mothers. It is also important, but to a lesser extent, for health care workers. It was too compli-cated to model this benefit, but it is possible to take it into account by multiplying the costs of infection with a certain factor, for example, 1.15, if we assume that the secondary effect is 15% of the primary effect. Another benefit of vaccination is the prevention of delta infection. Apart from a few exceptions, delta infections occur only in drug addicts (30).
COSTS OF VACCINATION AND SCREENING Cost of Vaccination
Vaccination costs include three doses of vaccine, handling and administration, and travel and time costs for the patient. A problem with costs of administration, travel, and patients' time is that these depend on the design of the vaccination program and the risk groups vaccinated.
Jdnsson et al.
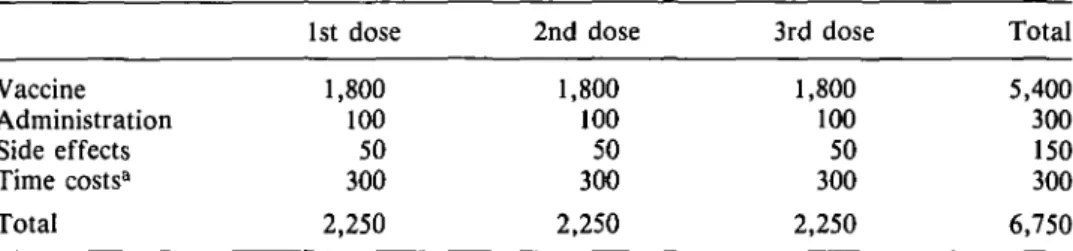
Table 2. Summary of Vaccination Costs, in Pesetas
1st dose 2nd dose 3rd dose Total Vaccine Administration Side effects Time costs3 Total 1,800 100 50 300 2,250 1,800 100 50 300 2,250 1,800 100 50 300 2,250 5,400 300 150 300 6,750 " For hospital personnel.
Costs of handling and administration vary considerably. For individual vaccina-tions, it is reasonable to assume that the costs of administration are equal to the costs of a physician visit. If it is a program of mass vaccination, costs will be lower, but not negligible. Administration costs can be reduced if the vaccine is delivered in, for example, ready-to-use syringes. This will, of course, increase the costs for the producer of the vaccine.
The vaccination costs are shown in Table 2. Costs for administration of the vac-cine were calculated by Rivera et al. (34) to be 189 pesetas for personnel and 15 pesetas for material, in 1982 prices. Rivera et al. calculated direct costs of side effects at 132 pesetas.
Time and travel costs for the patient are dependent on the specific risk group. For hospital staff, we assumed travel costs were zero, and that a maximum of 30 minutes were lost from work for each injection.
Costs of Screening
Saenz Gonzalez et al. (37) give the following costs for screening tests: anti-HBc, 736 pesetas; anti-HBs, 637 pesetas; and HBsAg, 474 pesetas. Given the screening strategy used in Spain (22), the average screening cost will be 952 pesetas per person screened. Time and travel costs for patients who are screened should also be taken into account. For health care workers, we will assume the same costs as for vaccination, 300 pesetas. Total costs per person for screening, therefore, will be 1,250 pesetas for this risk group. The Cost-Effectiveness of Screening in Relation to Vaccination
If one assumes that the problem of false test results can be ignored, the threshold be-tween vaccination and screening is determined by the costs of screening and vaccina-tion. When the prevalence of HBV markers is lower than the ratio of screening costs to vaccination costs, vaccination will be less costly than screening. If one assumes that the costs of vaccination are 5,850 pesetas and the costs of screening are 950 pesetas, the ratio is 0.16. If the expected prevalence of serological markers is higher than this ratio, screening is cost-effective; otherwise, it is not. For health care personnel, the ratio is 1,250/6,750 = 0.19 when time costs are included.
COSTS OF HEPATITIS-B INFECTION Modeling Acute Infection
The first distinction must be made between asymptomatic (subclinical) and clinical cases. Clinical cases can be divided into mild, severe (icteric), and fulminant. The bound-aries between different cases are not very strict. It may, for example, be very difficult to separate asymptomatic and mild cases.
0.5 Subclinical
Infection Oc~"~"~ 0.60 Mild
Figure 1. Model of acute outcome of infection.
Table 3. Probabilities for Different Chronic Outcomes of Hepatitis-B Infection
Outcome Resolution Carrier state Persistent hepatitis Active hepatitis High 0.74 0.12 0.093 0.047 Probability Main 0.9 0.05 0.035 0.015 Low 0.95 0.025 0.0175 0.0075
The basic probabilities are shown in Figure 1. Mild clinical hepatitis is associated with moderate pain and/or impairment and usually requires a visit to a physician. Se-vere symptoms can require a hospitalization. More precise assumptions about the costs of the different acute outcomes are shown in the section on costs.
Modeling Chronic Sequelae
For chronic outcomes, we distinguish between resolution, carrier, persistent, and ac-tive hepatitis. For fulminant hepatitis, we also include the probability of death. Proba-bilities for different chronic outcomes are based on three different assumptions. The first is based on the internationally accepted distribution used, for example, by Mulley et al. (31). We then make a sensitivity analysis using data from the Spanish study by Saenz Gonzalez et al. (37) as the high alternative for chronic outcome and newer data from Italy (6) and Greece (35) as the low alternative. Sensitivity analysis makes it pos-sible for us to understand the importance of the severity of the chronic outcomes for the result of the cost-effectiveness analysis. Table 3 shows the model for chronic out-comes with the different probabilities used.
Direct Health Care Costs
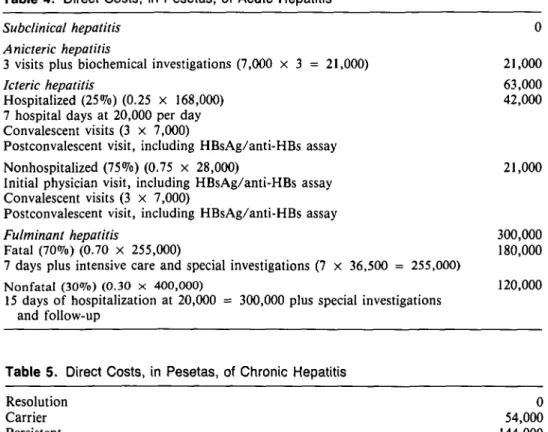
Very few studies are published about the use of health care resources after hepatitis-B infection. This makes it necessary to calculate expected costs based on knowledge about medical management of the disease. Treatment of patients with hepatitis-B infection varies between physicians and hospitals. In addition, the great variability in the conse-quences of the disease for patients makes it difficult to calculate costs of hepatitis-B infection. The estimates in Tables 4 and 5 are based on the best information available and relate to other estimates, such as those by Mulley et al. (31). However, they must be viewed only as a reasonable average. We need more detailed cost studies linked to serious epidemiological investigation in order to answer questions about the conse-quences of hepatitis-B infection. Treatment of patients changes continuously over time because of progress in medical knowledge and treatment methods.
There is no need to discount the costs of acute hepatitis. We assume that the cost
Jonsson et al.
Table 4. Direct Costs, in Pesetas, of Acute Hepatitis
Subclinical hepatitis 0
Anicteric hepatitis
3 visits plus biochemical investigations (7,000 x 3 = 21,000) 21,000
Icteric hepatitis 63,000
Hospitalized (25%) (0.25 x 168,000) 42,000 7 hospital days at 20,000 per day
Convalescent visits (3 X 7,000)
Postconvalescent visit, including HBsAg/anti-HBs assay
Nonhospitalized (75%) (0.75 x 28,000) 21,000 Initial physician visit, including HBsAg/anti-HBs assay
Convalescent visits (3 x 7,000)
Postconvalescent visit, including HBsAg/anti-HBs assay
Fulminant hepatitis 300,000
Fatal (70%) (0.70 x 255,000) 180,000 7 days plus intensive care and special investigations (7 x 36,500 = 255,000)
Nonfatal (30%) (0.30 x 400,000) 120,000 15 days of hospitalization at 20,000 = 300,000 plus special investigations
and follow-up
Table 5. Direct Costs, in Pesetas, of Chronic Hepatitis
Resolution 0 Carrier 54,000 Persistent 144,000 Active 470,000
of resolution is zero. For the carrier state, we can follow Mulley et al. (31) and assume that there will be a physician visit each year plus laboratory tests with HBsAg at a total cost of 7,000 pesetas. If one assumes that the carrier state will last an average of 10 years, total costs will be 54,000 pesetas with a discount rate of 5%. Saenz Gon-zalez et al. (37) estimated the annual medical costs to be 32,052 pesetas for asymptom-atic carriers.
For persistent hepatitis, we assume an initial 3-day hospital visit for a liver biopsy and other tests. We assume an annual physician visit plus laboratory tests:
• 3 days of hospitalization: 3 x 20,000 60,000 pesetas • Liver biopsy 30,000 pesetas • Total hospitalization costs 90,000 pesetas
To this we add one follow-up visit including laboratory testing discounted at 5% for
• 5 years = 4.33 x 7,000 = 30,310 pesetas • 10 years = 7.72 x 7,000 = 54,040 pesetas • 20 years = 12.46 x 7,000 = 87,220 pesetas
At an average follow-up period of 10 years, the total costs for persistent hepatitis is 90,000 + 54,000 = 144,000 pesetas.
For active hepatitis, we assume the same costs as for persistent hepatitis but add that for years 2-10, 20% of the patients have a repeated episode of hospitalization and liver biopsy, and for years 11-20, this share increases to 40%. Total costs discounted at 5% amount to 470,000 pesetas.
Table 5 summarizes our estimates of the direct costs of chronic hepatitis. These estimates can be compared with Saenz Gonzalez et al.'s (37) estimates for chronic hep-atitis (persistent plus active), which were 370,000 pesetas for the first year and 92,417 pesetas for years 2-5. Their figures are somewhat higher, but the order of magnitude is not too different.
Indirect Costs
Indirect costs are resources lost because of morbidity and premature mortality. Be-cause indirect costs are calculated as lost earnings, they are dependent on the age, sex, and employment situation of each risk group. A sample of clinical cases of hepatitis B tested showed that two-thirds of the cases were in the age-group 15-45 years (22). Because hepatitis-B infection is most common among economically active groups, the indirect costs of the disease can be very important. Earlier studies of costs of clin-ical (icteric) hepatitis B have also shown that indirect costs exceed direct costs, for ex-ample, Adler et al. (2) and Rivera et al. (34). The most detailed calculation has been done for the United States by Schatz et al. (39). Total annual cost in the United States is estimated at $365 million. Direct costs amount to $225 million (60%).
Total cost is equally distributed between acute and chronic costs. They assume that an acute, nonhospitalized case is associated with, on average, a loss of 21 days of work. Hospitalized patients lose 43 days of work. For hospital workers, it is partic-ularly relevant to take indirect costs into account, because in this group, by definition, 100% are employed. The unemployment rate is also low, indicating that it is difficult to substitute time lost from work with otherwise unemployed workers.
For patients in mental health hospitals, patients on hemodialysis, drug addicts, and prisoners, the loss of productive time will probably in most cases be very low. However, for family members of HBV carriers, and for recruits in the armed forces, loss of productive time (or loss of training time) can be of importance.
The following estimates for indirect costs are for medical personnel only. Saenz Gonzalez et al. (37) estimated the following number of days of sick leave due to acute hepatitis:
• Resolution 100.5 days ± 59.5 • Carrier 93.7 days ± 31.8 • Chronic hepatitis 215.2 days ± 151.5 • Average 118.4 days ± 88.7
Rivera et al. (34) calculated indirect costs per case of hepatitis to be 631,000 pesetas, equivalent to about 96 days lost from work at 6,569 pesetas per working day. They calculated costs per day assuming 250 working days per year.
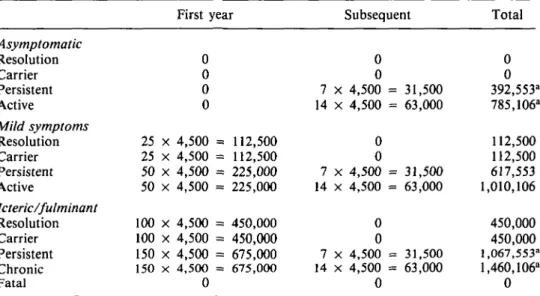
To relate these data to our model, we make a distinction between the first and subsequent years. For the first year, we assume that only the symptomatic cases lose time from work. We then assume that in subsequent years only patients with persistent and active hepatitis lose time from work with an average of 1 and 2 weeks, respectively (see Table 6).
Table 7 summarizes the direct and indirect costs of infection. As is shown in Table
Jonsson et al.
Table 6. Indirect Costs, in Pesetas, of Hepatitis-B Infection
First year Subsequent Total
Asymptomatic Resolution Carrier Persistent Active Mild symptoms Resolution Carrier Persistent Active Icteric/fulminant Resolution Carrier Persistent Chronic Fatal 25 25 50 50 100 100 150 150 X X X X X X X X 0 0 0 0 4,500 = 112,500 4,500 = 112,500 4,500 = 225,000 4,500 = 225,000 4,500 = 450,000 4,500 = 450,000 4,500 = 675,000 4,500 = 675,000 0 7 14 7 14 7 14 X X X X X X 0 0 4,500 = 31,500 4,500 = 63,000 0 0 4,500 = 31,500 4,500 = 63,000 0 0 4,500 = 31,500 4,500 = 63,000 0 0 0 392,553a 785,106a 112,500 112,500 617,553 1,010,106 450,000 450,000 l,067,553a 1,460,106" 0 a Calculated for 20 Table 7. Direct Direct costs Indirect costs Total years discounted at 5%.
and Indirect Costs, in Pesetas, of Hepatitis-B Infection Nonvaccinated High 61,000 207,000 268,000 Main 34,000 153,000 187,000 Low 27,000 138,000 165,000 Vaccinated Main 12,000 65,000 77,000
7, indirect costs far exceed direct costs. This is consistent with other studies from, for example, Spain and the United Kingdom. When we compare these studies with those in the United States, where direct and indirect costs are of the same magnitude, we must remember that the direct costs are much higher in the United States than in Spain and the United Kingdom.
EFFECTS ON QUALITY-ADJUSTED LIFE YEARS
Cost-benefit studies of vaccination programs have rightly been criticized for not in-cluding a measure of health benefit (46). One way to include such a measure is to esti-mate the effect of the vaccination program in terms of quality-adjusted life years (QALYs). One QALY is equal to one fully healthy year of life.
If we know the effect of a vaccination program on QALYs, we can use it in two ways. The first is as an effectiveness measure for calculations of costs per QALY. Such a measure can be used for comparison with other programs or risk groups. Second, we can assign a value to each QALY saved through the program. This makes it possible to add the health benefits to the direct and indirect costs.
Our calculations are done in four stages: (a) an estimate of the effect of infection on life expectancy; (b) an estimate of the effect of infection on quality of life; (c) an
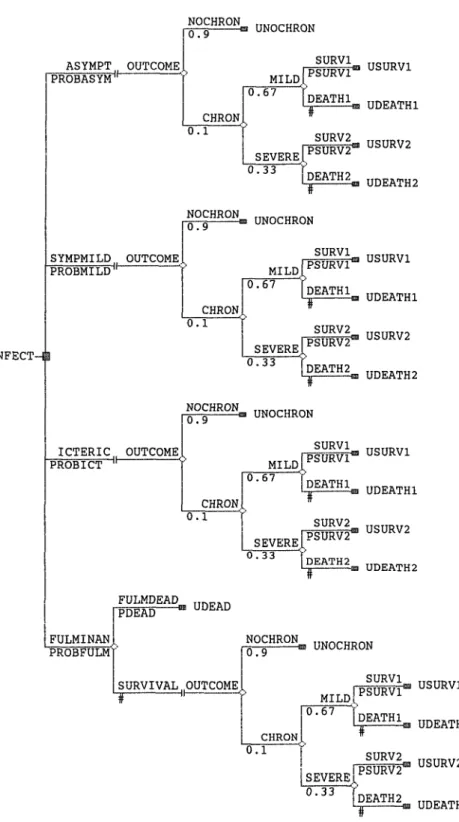
ASYMPT OUTCOME INFECT-II PROBASYMlh UNOCHRON SURV1 MILD CHRON 0.1 USURV1 SURV2 SEVERE.F™ [DEATH2 SYMPMILD OUTCOME 1 PROBMILD1 UNOCHRON SURV1 CHRON 0.1 0.67 SEVERE 0.33 n q I J R V 1 U S U R V 1 UDEATH1 SURV2_ „„„„,,, -PSURV2™ U S U R V 2 UDEATH2 ICTERIC OUTCOME PROBICT
S
•m UNOCHRON SURV1 MILD CHRON 0.1 0.67 nqTIRV1 USURV1 UDEATH1 SURV2 0.33 FULMINAN PROBFULM PDEAD SURVIVAL OUTCOMEH U N 0 C H R 0 N SURV1 MILD CHRON 0.1 USURV1 UDEATH1 USURV2WTH2
Figure 2. Model for calculating loss of life expectancy due to hepatitis-B infection.
Jonsson et al.
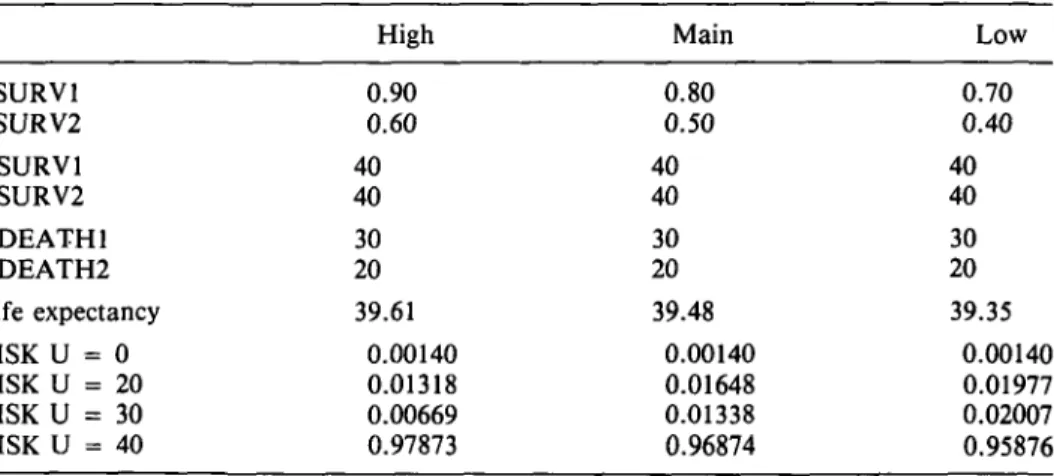
Table 8. Sensitivity Analysis for Life Expectancy after Infection for Different Assumptions about Survival8 PSURV1 PSURV2 USURV1 USURV2 UDEATH1 UDEATH2 Life expectancy RISK U = 0 RISK U = 20 RISK U = 30 RISK U = 40 High 0.90 0.60 40 40 30 20 39.61 0.00140 0.01318 0.00669 0.97873 Main 0.80 0.50 40 40 30 20 39.48 0.00140 0.01648 0.01338 0.96874 Low 0.70 0.40 40 40 30 20 39.35 0.00140 0.01977 0.02007 0.95876 a
See text for explanation of assumptions.
estimate of the loss in QALYs because of infection; and (d) an estimate of the costs of a QALY lost because of hepatitis-B infection.
The model used to estimate the number of years of life lost due to infection is shown in Figure 2. It is assumed that the average age when infected is 35 years for hospital personnel and that life expectancy is 40 more years. Life expectancy at 35 years of age is 39.5 years for men and 44.8 years for women in Spain.
We made the following assumptions:
• PSURV1 = 0.80 (the probability that a mild infection does not reduce life ex-pectancy)
• PSURV2 = 0.50 (the probability that a severe infection does not reduce life ex-pectancy)
• USURV1 = 40
• UDEATH1 = 30 (life expectancy reduced by 10 years) • USURV2 = 40
• UDEATH2 = 20 (life expectancy reduced by 20 years)
With these assumptions, life expectancy after infection is 39.48 years. This means a reduction in length of life by only 1.25%. If we do a risk analysis using these assump-tions, the number of deaths in a cohort of 100,000 infected will be: death from ful-minant hepatitis, 140; death from cirrhosis or PHC, 2,986. This is of the same magni-tude as has been estimated for the United States (2,500).
A sensitivity analysis with higher and lower probabilities of survival is shown in Table 8. We also tried a quality adjustment of years of life lost, using the Rosser/Williams (25) method of quality adjustment. The quality adjustment is made in two steps. First, the patient's health status is classified in two dimensions, disability and distress. Then the different "cells" in the matrix are valued on a scale where healthy = 1.0 and dead = 0. For the full valuation matrix, see Kind et al. (25). It is extremely difficult to clas-sify patients who have an HBV infection according to the Rosser/Williams scale. We make the following assumptions: (a) because the acute phase is short, we do not
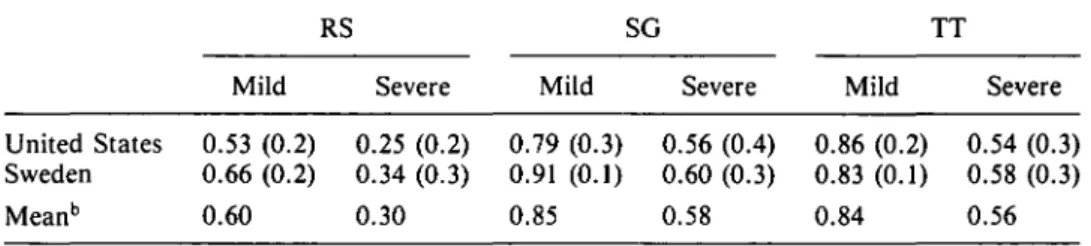
Table 9. Utility Weights with Rating Scale (RS), Standard Gamble (SG), and Time Trade-off (TT) for Mild and Severe Hepatitis8
United Sweden Meanb States 0 0 0 Mild .53 .66 .60 (0. (0. 2) 2) RS 0 0 0 Severe .25 .34 .30 (0.2) (0.3) Mild 0.79 0.91 0.85 (0. (0. 3) 1) SG 0 0 0 Severe .56 .60 .58 (0.4) (0.3) 0 0 0 Mild .86 .83 .84 (0. (0. .2) 1) TT 0 0 0 Severe .54 .58 .56 (0, (0. .3) .3) a
Figures in parentheses are standard deviations.
b Used for calculations.
elude it in our quality adjustment; (b) patients with a mild chronic outcome are as-sumed to be in state IB, with no disability but mild distress (weight 0.995); and (c) patients with a severe chronic outcome are assumed to be in state IIB, with slight social disability and mild distress (weight 0.986).
The reduction in QALYs caused by infection will then be, for mild chronic outcome: • USURV1 0.995 x 40 = 39.8
• UDEATH1 0.995 X 30 = 29.8 and for severe chronic outcome: • USURV2 0.986 X 40 = 39.44 • UDEATH2 0.986 x 20 = 19.72
The expected number of QALYs is 39.45, compared with 39.48 when no quality adjust-ment is made. Thus, adjustadjust-ment for quality of life does not significantly affect our result. One obvious reason for this outcome is that the valuation matrix we used shows rather small reductions in quality of life for those illness states that can be judged relevant after a hepatitis-B infection.
Because of this, we carried out an experimental sensitivity analysis on the quality adjustment. In Sweden and the United States, a small group of university students (11 Swedish students and 10 U.S. students) were asked to value mild and severe hepa-titis. The methods used were rating scale, time trade-off, and standard gamble. The results are shown in Table 9.
The difference between these results and the results obtained with the Rosser/ Williams matrix (25) is striking. It is also interesting to note that the utility weights implied by a rating scale are considerably lower than the weights implied by the stan-dard gamble and time trade-off scaling methods. If we use the average utility weights from the different methods in Table 9 (0.76 for mild and 0.48 for severe), the expected number of QALYs in the model will be 38.35, varying still more from the 39.45 QALYs obtained earlier with the Rosser/Williams method.
RESULTS
Our empirical estimation is for health care personnel, the largest high-risk group for hepatitis B in Spain. We assume that vaccination is undertaken only in combination with a screening program. We further assume that 90% of those screened and found
Jonsson et al.
to be negative will be vaccinated with one dose of vaccine. For the second dose and third dose, compliance is reduced 5% and 10%, respectively.
The attack rate is defined for the screened (and negative) population. When no screening is undertaken, the attack rate has to be adjusted for the proportion of the screened population that is marker positive.
Because vaccination will protect for more than 1 year, we have entered a duration factor D into the model. If we assume that protection lasts for 5 years, D will be given the value 5.0. Because it is appropriate to discount future benefits, the factor D will also be used to incorporate the discount rate in the sensitivity analysis. Costs are as-signed to the terminal nodes; for example, a person not screened, not vaccinated, not exposed, and not infected will end up with zero cost. A person screened and vacci-nated with three doses of vaccine will end up with costs of 1,250 plus 6,750 pesetas, a total of 8,000 pesetas if not infected.
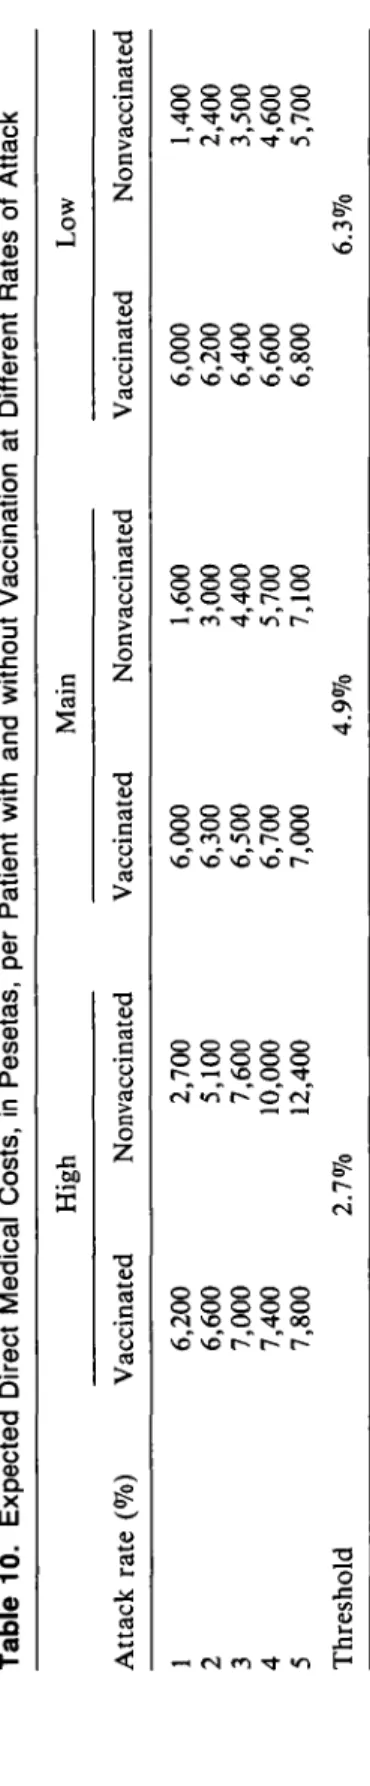
Table 10 summarizes the expected medical costs per patient with and without vac-cination. The cost per patient increases with the attack rate for both vaccinated and unvaccinated persons. However, costs increase faster for those who are not vaccinated, and at an attack rate of 4.9%, both alternatives cost the same. At this threshold value, the cost of the vaccination program is just offset by savings in medical expenditures from fewer cases being infected. The threshold value is 2.7% for the high cost of the infection alternative and 6.3% for the low cost.
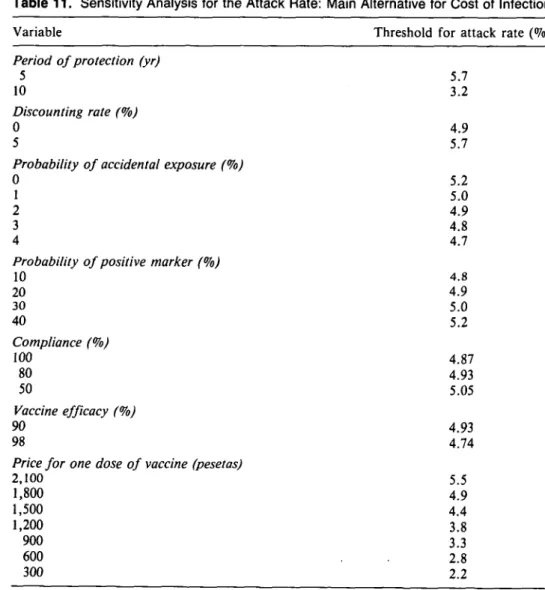
If one assumes that the rate of attack averages 1.0% for health care personnel, the expected costs per person for screening and vaccination are 6,000 pesetas com-pared with 1,600 pesetas if no vaccination is undertaken. This means that the net cost for a vaccination program for all hospital personnel, 340,000 persons, is 340,000 x (6,000 - 1,600) = 1,500 million pesetas. We will now see how sensitive our result is to changes in some of the basic assumptions. This sensitivity analysis is summarized in Table 11.
Discounting does not significantly change the result. However, extending the benefits to 10 years at a 5% discount rate reduces the threshold for the attack rate from 5.7% to 3.2%. The probability of accidental exposure does not affect the result of the analysis, and neither does the assumption about the share of the screened popu-lation that is found to be marker positive. If the probability of markers is less than 0.19, it is less expensive to vaccinate without prior screening.
The result is very sensitive to the cost of the vaccine. A reduction in the price of one dose from 1,800 to 1,500 pesetas reduces the threshold for the attack rate from 4.9% to 4.4%. Improving compliance and the efficacy of the vaccine reduces the threshold, but the sensitivity is not very high.
Table 12 shows the expected cost per patient when indirect costs are included. The expected costs per person are 7,700 pesetas for no screening/no vaccination and 7,200 pesetas for screening/vaccination for hospital personnel at an attack rate of 1.0% and a marker-positive rate of 20%.
These results mean that for 340,000 hospital employees, the screening/vaccina-tion program will save 340,000 x (7,700 - 7,200) = 170 million pesetas. If the high alternative of costs of infection is used, the threshold for the attack rate is reduced to 0.6%. As shown in Table 11, the result is not very sensitive to the high or low esti-mate of indirect costs. However, including indirect costs reduces the threshold for the attack rate from 5% to 1%.
Table 13 presents the effectiveness ratio measured as cost per QALY. The cost-effectiveness ratio is calculated both excluding and including indirect costs. It is also shown for 0% and 5% discount rates. The cost per QALY increases when the risk
Tabl e 10 . Expecte d Direc t Medica l Costs , i n Pesetas , pe r Patien t wit h an d withou t Vaccinatio n a t Differen t Rate s o f Attac k Attac k rat e (% ) 1 2 3 4 5 Threshol d Vaccinate d 6,20 0 6,60 0 7,00 0 7,40 0 7,80 0 Hig h Nonvaccinate d 2.7 % 2,70 0 5,10 0 7,60 0 10,00 0 12,40 0 Vaccinate d 6,00 0 6,30 0 6,50 0 6,70 0 7,00 0 Mai n Nonvaccinate d 4.9 % 1,60 0 3,00 0 4,40 0 5,70 0 7,10 0 Vaccinate d 6,00 0 6,20 0 6,40 0 6,60 0 6,80 0 Lo w Nonvaccinate 6.3 % 1,40 0 2,40 0 3,50 0 4,60 0 5,70 0
Jonsson et al.
Table 11. Sensitivity Analysis for the Attack Rate: Main Alternative for Cost of Infection
Variable Threshold for attack rate (%)
Period of protection (yr)
5 5.7 10 3.2
Discounting rate (%)
0 4.9 5 5.7
Probability of accidental exposure (%)
0 5.2 1 5.0 2 4.9 3 4.8 4 4.7
Probability of positive marker (%)
10 4.8 20 4.9 30 5.0 40 5.2 Compliance (%) 100 4.87 80 4.93 50 5.05 Vaccine efficacy (%) 90 4.93 98 4.74
Price for one dose of vaccine (pesetas)
2,100 5.5 1,800 4 9 1,500 4.4 1,200 3.8 900 3 3 600 . . 2.8 300 2.2
of infection is reduced. The gross domestic product (GDP) per capita in Spain is about 750,000 pesetas. If one assumes that the decision maker values an extra QALY at 750,000 pesetas, risk groups with an attack rate of 0.35% or higher should be vaccinated, if we include both direct and indirect costs and discount at 5%. If only direct costs are counted, the threshold is about 0.5%. We also performed a sensitivity analysis on cost per QALY using the utility weights implied by the experiment illustrated in Table 9. The cost per QALY is extremely sensitive to the method chosen for quality adjust-ment. Our experimental data on quality adjustment implies a cost per QALY at only about a third of that obtained with the Rosser/Williams method (25). If one assumes again that the decision maker values an extra QALY at 750,000 pesetas, risk groups with an attack rate of approximately 0.15% or higher should be vaccinated.
Tabl e 12 . Expecte d Direc t plu s Indirec t Costs , i n Pesetas , pe r Patien t wit h an d withou t Vaccinatio n a t Differen t Rate s o f Attac Attac k rat e (% ) 0. 5 1. 0 1. 5 2. 0 2. 5 Threshol d Vaccinate d 6,70 0 7,60 0 8,50 0 9,50 0 10,40 0 Hig h Nonvaccinate d 0.6 % 5,60 0 11,00 0 16,30 0 21,60 0 27,00 0 Vaccinate d 6,50 0 7,20 0 7,90 0 8,60 0 9,30 0 Mai n Nonvaccinate d 4,00 0 7,70 0 11,50 0 15,20 0 18,90 0 0.9 % Vaccinate d 6,40 0 7,10 0 7,70 0 8,30 0 9,00 0 Lo w Nonvaccinate 3,60 0 6,90 0 10,00 0 13,40 0 16,70 0 1.0 %
Jonsson et al.
Table 13. Cost, in Pesetas at 5% Discount Rate, per QALY at Different Attack Rates
Attack rate (%) 0.1 0.2 0.3 0.4 0.5 0.6 0.7 0.8 0.9 1.0 Direct Rosser/ Williams (25) 3,500,000 1,800,000 1,200,000 900,000 700,000 570,000 480,000 410,000 360,000 320,000 Cost cost only Jonsson et al 1,200,000 600,000 400,000 300,000 230,000 190,000 160,000 140,000 120,000 110,000 per QALY Direct plus Rosser/ Williams (25) 3,200,000 1,500,000 900,000 590,000 400,000 270,000 180,000 110,000 60,000 18,000 indirect costs Jonsson et al. 1,100,000 500,000 200,000 200,000 130,000 91,000 63,000 38,000 20,000 6,000 DISCUSSION
Cost-benefit and cost-effectiveness studies of vaccination against hepatitis-B have gener-ally included only medical costs (20;31). This restriction can be defended if the deci-sion maker's main interest is to know how the program affects the health budget. How-ever, most countries do not have a single health budget; vaccination programs are usually funded separately from medical services. The decision maker in charge of vaccina-tions cannot benefit from calculated savings in health care costs that are due to fewer infections. This fact means that the usual approach to cost-benefit analysis is consis-tent neither with incentives for cost minimization nor with the relevant concept of social cost. Only in situations where savings in health care costs can be assumed to correspond to a minimum value of health improvement that exceeds the cost of preven-tion can a study be used for conclusions about the net social value of the program. Ideally, such a study should also take into account the savings in other preventive ex-penditures due to the protection given by the vaccination. However, since preventive measures against hepatitis-B infection are the same as those against HIV, this has no practical significance in this case. For a more detailed discussion about the relation between cost saving and social benefit, see Berger et al. (5).
The cost-saving approach to prevention has a legitimate place in economic evalu-ation when the decision maker is looking for different alternatives for containing health care expenditures. Ideally, such an approach should also take into account effects on health care expenditures from changes in probabilities of other diseases. However, such financial studies are not a substitute for social cost-benefit studies.
Studies of the economic costs of hepatitis B have revealed that indirect costs due to loss of production are a significant part of the direct costs of hepatitis B. It seems natural to include these costs in a more comprehensive measure of the social cost of hepatitis-B infections and the benefits of vaccination.
This study shows that inclusion of indirect costs reduces the threshold for vacci-nation from a 5% to 1% risk of infection for the largest risk group, hospital personnel. Because the expected attack rate in this high-risk group is estimated to be 1.5%, the inclusion of indirect costs has a significant effect on the outcome of the study.
Direct and indirect costs underestimate the true social costs of hepatitis-B
tion. A measure of health benefit should be included in the estimation. We estimated the increase in QALYs from the vaccination program. This makes it possible to calcu-late net cost per QALY at different risks of infection. Vaccination programs against hepatitis B can then be compared with other interventions that improve the health of the population (44;47).
Ideally, estimates of improvement in quantity and quality of life should be based on data from controlled trials for different risk groups. Lack of such data makes it necessary to make approximations. However, we think it is better to include the best available estimates than to disregard health benefits. There is a need for more careful studies of the quality of life of patients suffering from chronic sequelae of hepatitis-B infections.
Russell (36) has pointed out that including both the value of improved health and increased earnings results in counting some health effects twice. While this is a valid point, it has to be qualified. First, the major health benefit from the vaccination pro-gram is an increase in life expectancy. Because we have not counted any indirect costs due to reduced mortality, this measure counts nothing twice. Second, the degree of double counting depends on how quality of life has been adjusted. We cannot rule out the possibility that the weights in the Rosser/Williams matrix (25) are influenced by opportunities to earn income. However, the existence of health insurance and cash benefits in case of sickness or disability makes it reasonable to assume that respon-dents take only limited account of the effect of their health status on their income when asked to state their preferences for different health states. When performing the valuation experiment, the students were instructed to value "pure" health effects and not include the value of extra earnings. Therefore, we argue that taking indirect costs into account in this study does not imply any double counting.
CONCLUSIONS
Cost and benefits from vaccination against hepatitis B depend on epidemiological, clinical, and economic factors that show significant variation between risk groups and over time. Therefore, a generally applicable computer model was developed as a tool for decision making. The model allows easy changes in basic assumptions as well as opportunities for sensitivity analysis for uncertain variables.
Estimates were undertaken for health care personnel, the major risk group for hepatitis B in Spain. The benefits from vaccination included reductions in direct and indirect costs from fewer infections as well as improvements in length and quality of life. The result shows the importance of including not only savings in medical expendi-tures but also reductions in indirect costs in the estimate of benefit. A vaccination program will reduce the total health care expenditures for hepatitis B only if the attack rate is higher than 4.9%. However, if reductions in indirect costs are included, the threshold for the attack rate is reduced to 0.9%, which is below the estimated average risk of infection of 1.0%.
Calculating the gross and net cost per QALY makes it possible to compare vacci-nation against hepatitis B with other preventive and curative health investments. If one assumes that the decision maker is prepared to use resources for prevention if the cost of producing 1 QALY is less than the average GDP, all hospital personnel with a higher risk than 0.35% should be vaccinated.
NOTE
1
Chronic virus carrier = person who remains actively infected with HBV for more than 6 months.
Jonsson et al. REFERENCES
1. ACIP. Recommendations for protection against viral hepatitis. Morbidity and Mortality
Weekly Report, 1985, 34, 313-35.
2. Adler, M. W., et al. Should homosexuals be vaccinated against hepatitis-B virus? Cost and benefit assessment. British Medical Journal, 1983, 80, 139-48.
3. Aparicio, J. A., Dean, C. A., Tellez, A. R., et al. Aspectos de la transmision intrafamiliar del virus de la hepatitis B en una familia de raza gitana. Medicina Clinica (Barcelona), 1987, 88, 828.
4. Bengoechea, M. G., Cortes, A., Francisco, C , et al. Infection por el virus de la hepatitis B en los odentologos de Guipuzcoa. Medicina Clinica (Barcelona), 1987, 88, 179-81. 5. Berger, M. C , Blomquist, G. C , Kenkel, D., & Tolley, G. S. Valuing changes in health risks:
A comparison of alternative measures. Southern Economic Journal, 1987, 53, 967-84. 6. Bortollotti, A., et al. Chronic evolution of acute hepatitis type B: Prevalence and
predica-tive markers. Infection, 1986, 14, 64-67.
7. Bove, J. R. Transfusion-associated hepatitis and AIDS: What is the risk? New England
Journal of Medicine, 1987, 317, 242-45.
8. Bruguera, M. La hepatitis B en el personal sanitario. Medicina Clinica (Barcelona), 1986, 86, 676-80.
9. Bruguera, M., Ardiaca, C , Semente, M., et al. Epidemiologia de la hepatitis B en personal hospitalario. Revista de Medicina Clinica, 1980, 74, 1-4.
10. Bruguera, M, Caballeria, J., Acero, D., et al. Transmision intrafamiliar del virus de la hep-atitis B. Gastroenerologia y Hepatologia, 1980, 3, 13-18.
11. Bruguera, M., Tapias, J. M. S., Latorre, X., et al. Marcadores serologicos de la hepatitis A y B en los homosexuales masculinos. Medicina Clinica (Barcelona), 1987, 88, 869. 12. Buti, M , Esteban, R., Sanjose, R., et al. Prevalencia de marcadores de infecci6n de los
virus de la hepatitis B: Delta y HLTV-III en deficientes mentales. Revista Clinica Espanola, 1986, 179, 175-77.
13. Caballero, L. R., Lopez, F. V., Manuel, C. A., et al. Prevalencia de los marcadores sericos del virus B de la hepatitis en varones heterosexuales con enfermedas de transmision sexual.
Medicina Clinica (Barcelona), 1986, 87, 309-12.
14. CDC. Recommendations for prevention of HIV transmission in health-care settings.
Mor-bidity and Mortality Weekly Report, 1987, 36, 2S.
15. Coursaget, P., Yvonnet, B., Chotard, J., et al. Age- and sex-related study of hepatitis B virus chronic carrier state in infants from an endemic area (Senegal). Journal of Medical
Virology, 1987, 22, 1-5.
16. Economic aspects of communicable diseases. European Reports and Studies, No. 68. Copen-hagen: WHO Regional Office for Europe, 1982.
17. Fos, E., Dieguez, A., Hierro, F. R., et al. Infecci6n por el virus de la hepatitis B en la pobla-ci6n de raza gitana. Medicina Clinica (Barcelona), 1986, 86, 304.
18. Genesca, J., Esteban, J. I., Esteban, R., et al. Difusi6n intrafamiliar del virus de la hepatitis B. Estudio de contactos familiares de portadores cronicos. Medicina Clinica (Barcelona), 1986, 87, 271-74.
19. Hadler, S. C , Francis, D. P., Maynard, J. E., et al. Long-term immunogenicity and efficacy of hepatitis B vaccine in homosexual men. New England Journal of Medicine, 1986, 315, 209-14.
20. Hatziandreu, E. I., et al. A cost-effectiveness analysis of vaccination against hepatitis-B infection (paper presented at the Third Annual ISTAHC Meeting).
21. Horisberger, B., & Jonsson, B. Economic burden of hepatitis-B in Spain (mimeo). 22. Instituto Nacional de Sanidad, Centro Nacional de Microbiologia, Virologia e Inmunologia
Sanitarias, Majadahonda, Madrid, May 27, 1986.
23. Jauregui, S. J. M., Garay, S. C. F., Odriozola, M. P., et al. Prevalencia de infecci6n por virus de la hepatitis (VHB) en drogadictos asintomaticos. Medicina Clinica (Barcelona), 1984, 82, 13-15.
24. Jonsson, B. Cost-benefit analysis of hepatitis-B vaccination. Postgraduate Medical Journal, 1987, 63(suppl. 2), 27-32.
25. Kind, P., Rosser, R., & Williams, A. Valuation of quality of life: Some psychometric evi-dence. In M. W. Jones-Lee (ed.), The value of life and safety. Amsterdam: Elsevier/North Holland, 1982.
26. Kumar, M. L., Dawson, N. V., McCullough, A. J., et al. Should all pregnant women be screened for hepatitis B? Annals of Internal Medicine, 1987, 107, 273-77.
27. Leal, M., & Lissen, E. Infecci6n por el virus de la hepatitis B en prostitutas: Un problema de la salud piiblica. Medicina Clinica (Barcelona), 1986, 87, 326-27.
28. Leal, M., Ollero, M., Garcia de Pesquera, E, et al. Prevalencia de marcadores sericos de los virus de la hepatitis A y B en varones homosexuales andaluces. Medicina Clinica
(Barce-lona), 1985, 84, 757-58.
29. Miranda, M. L., Lissen, E., Vinuesa, M., et al. Hepatitis vi'rica en pacientes hemofilicos tratados con concentrados comerciales de factor VIII y IX. Medicina Clinica (Barcelona), 1985, 84, 516-19.
30. Moestrup, T., et al. Clinical aspects of Delta infection. British Medical Journal, 1983, 286, 87-89.
31. Mulley, A. G., Silverstein, M. D., & Dienstag, J. L. Indications for use of hepatitis-B vac-cine, based on cost-effectiveness analysis. New England Journal of Medivac-cine, 1982, 307, 644-52.
32. Okada, K., Kamiyama, I., Inomata, M., et al. E antigen and anti-e in the serum of asymp-tomatic carrier mothers as indicators of positive and negative transmission of hepatitis B virus to their infants. New England Journal of Medicine, 1976, 294, 746-49.
33. Remis, R. S., Rossignol, M. A., & Cane, M. A. Hepatitis B infection in a day school for mentally retarded students: Transmission from students to staff. American Journal of Public
Health, 1987, 77, 1183-86.
34. Rivera, R, et al. Analisis costo-beneficia de un programa de vacunati6n contra la hepatitis-B en personal sanitario hospitalario. Medicina Clinica (Barcelona), 1984, 83, 611-14. 35. Roumeliotou-Karayannis, A., et al. How often does chronic liver disease follow acute
hepati-tis-B in adults? Infection, 1985, 13, 174-76.
36. Russell, L. Is prevention better than cure? Washington, DC: The Brookings Institution, 1986. 37. Saenz Gonzalez, M. C , et al. (Groupo Espafiol de Estudio de la Hepatitis B). Hepatitis-B
en personal hospitalario: Morbilidad, exposici6n accidental, vacunaci6n, y analisis de COStes.
Medicina Clinica (Barcelona), 1987, 88, 232-36.
38. Sanchez-Quijano, A., Rivera, R, Lissen, E., et al. Prevalencia de los marcadores sericos del virus B hepatitis en el personal sanitario y no sanitario de un hospital general. Medicina
Clinica (Barcelona), 1984, 83, 1-3.
39. Schatz, B. L., Kane, M. A., & Francis, D. P. The economic effects of hepatitis-B in the United States (mimeo). Phoenix, AZ: Centers for Disease Control.
40. Seeff, L. B., Beebe, G. W, Hoofnagle, J. H., et al. A serologic follow-up of the 1942 epi-demic of postvaccination hepatitis in the United States Army. New England Journal of
Medicine, 1987, 316, 965-70.
41. Stevens, C. E., Alter, H. J., Taylor, P. E., et al. Hepatitis B vaccine in patients receiving hemodialysis — Immunogenicity and efficacy. New England Journal of Medicine, 1984, 311, 496-501.
42. Subero, R. C , Fernandez, R C, Castiel, J. R, et al. Estudio de las enfermedades profe-sionales diagnosticadas en un periodo de cuatro afios al personal del hospital clinico de San Carlos de Madrid. N Arch Fac Med, 1984, 42, 153-59.
43. Szmuness, W., Stevens, C. E., Harley, E. J., et al. Hepaptitis B vaccine in medical staff of hemodialysis units-Efficacy and subtype cross-protection. New England Journal of
Medicine, 1982, 307, 1481-86.
44. Torrance, G. W. Measurement of health state utilities for economic appraisal. Journal of
Health Economics, 1986, 5, 1-30.
Jonsson et al.
45. Viral vaccines and antiviral drugs. WHO Technical Report Series, No. 693. Geneva: WHO, 1983.
46. Weisbrod, B. A., & Huston, J. H. Benefits and costs of human vaccines in developed coun-tries: An evaluative survey. PMA Cost-Effectiveness of Pharmaceuticals, Report 2, 1983. 47. Williams, A. Economics of coronary artery bypass grafting. British Medical Journal, 1985,
291, 326-29.
48. Hollinger, F. B. Hepatitis B virus. In B. N. Fields, D. M. Knipe et al. (eds.), Virology. New York: Raven Press, 1990, 2171-236.