HAL Id: hal-02335420
https://hal.parisnanterre.fr//hal-02335420
Submitted on 28 Oct 2019
HAL is a multi-disciplinary open access
archive for the deposit and dissemination of
sci-entific research documents, whether they are
pub-lished or not. The documents may come from
teaching and research institutions in France or
abroad, or from public or private research centers.
L’archive ouverte pluridisciplinaire HAL, est
destinée au dépôt et à la diffusion de documents
scientifiques de niveau recherche, publiés ou non,
émanant des établissements d’enseignement et de
recherche français ou étrangers, des laboratoires
publics ou privés.
Can carbon-13 in large herbivores reflect the canopy
effect in temperate and boreal ecosystems? Evidence
from modern and ancient ungulates
Dorothée G. Drucker, Anne Bridault, Keith A Hobson, Elwira Szuma, Hervé
Bocherens
To cite this version:
Dorothée G. Drucker, Anne Bridault, Keith A Hobson, Elwira Szuma, Hervé Bocherens. Can
carbon-13 in large herbivores reflect the canopy effect in temperate and boreal ecosystems? Evidence from
modern and ancient ungulates. Palaeogeography, Palaeoclimatology, Palaeoecology, Elsevier, 2008,
266 (1-2), pp.69-82. �10.1016/j.palaeo.2008.03.020�. �hal-02335420�
Can carbon-13 in large herbivores re
flect the canopy effect in temperate and boreal
ecosystems? Evidence from modern and ancient ungulates
Dorothée G. Drucker
a,b,⁎
, Anne Bridault
c, Keith A. Hobson
d, Elwira Szuma
e, Hervé Bocherens
a,fa
Prairie and Northern Wildlife Research Centre, Canadian Wildlife Service, Environment Canada, 115 Perimeter Road, Saskatoon, SK, Canada S7N 0X4
bInstitut für Ur- und Frühgeschichte und Archäologie des Mittelalters, Naturwissenschaftliche Archäologie, Universität Tübingen, Rümelinstr. 23, D-72070 Tübingen Germany c
Equipe d'Archéologies environnementales, Maison de l'Archéologie et de l'Ethnologie René Ginouvès, UMR 7041, case courrier 05, 21 Allée de l'Université, F-92023 Nanterre Cedex, France
d
Environment Canada, 11 Innovation Blvd, Saskatoon, SK, Canada S7N 3H5
e
Mammal Research Institute, Polish Academy of Sciences, ul. A. Waszkiewicza 1, 17-230 Bialowieza, Poland
f
Institut für Geowissenschaften, Biogeologie, Universität Tübingen, Sigwartstr. 10, D-72076 Tübingen, Germany
A B S T R A C T
Keywords: Canopy effect Carbon isotopes
Late-Glacial/Early Holocene transition Large herbivores
Local environmental conditions under dense canopy are known to result in depletion in 13C abundance in
plants compared to an open land context. This canopy effect has been observed in tropical as well as in mid-latitude forest ecosystems. However, the impact of the canopy effect on tissue 13C abundance of temperate
and boreal forest-dwelling herbivores has not been thoroughly explored. Nevertheless, the canopy effect has been suggested to explain a decrease of about 3‰ in collagen δ13C values in ancient large herbivores from
western Europe during the forest expansion of the Late-Glacial–Early Holocene period (ca. 15,000–6000 cal BP). Some papers have considered the 13C decrease in large herbivore as the main result of global change in
atmospheric CO2 content. A detailed review of δ13C values of large herbivores (reindeer, red deer, roe deer,
and bison) from open and closed environments from high and mid-latitudes confirm that the canopy effect observed in plants is passed on to their consumers. In the Paris Basin, the decline in δ13C values of large
herbivores at the Late-Glacial/Early Holocene transition around 10,000 years BP appears to be different according to the considered species, namely red deer, roe deer, and large bovines (bison and aurochs). Moreover, differences in the pattern of decrease in δ13C values are observed in red deer between French
northern Alps and French Jura. These differences among species in their isotopic response through time for a given geographical location, and within species from different locations, suggest variance in ecological responses of species that are associated with the relative use of forested habitat. As a result, 13C abundances
in collagen can be considered as a direct tracker of the degree of closure of the habitat of ancient herbivores.
1. Introduction
Habitat use and dietary preferences of ancient herbivores is an
important question in palaeobiology. In tropical contexts, the use of
carbon isotopic signatures (
δ
13C) of modern and fossil herbivore
tissues is nowadays routinely used to document these issues, since
herbaceous plants in open environments and herbaceous and arboreal
plants from forested contexts use different types of photosynthesis, C
4versus C
3, which exhibit very distinctive carbon isotopic signatures
(e.g.
Ambrose and DeNiro, 1986; van der Merwe et al., 1990; Vogel
et al., 1990; Cerling et al., 1998
). In boreal and temperate ecosystems,
where C
4plants are practically absent, C
3plants exhibit isotopic
contrasts according to environmental conditions (see reviews in
Tieszen, 1991; Heaton, 1999; Dawson et al., 2002
). Variation in
δ
13C
values in C
3plants has been observed in response to soil moisture, low
humidity, irradiance, temperature, nitrogen availability, salinity, and
atmospheric CO
2concentration. Despite these numerous factors
in
fluencing
13C assimilation by C
3
-plants, some systematic patterns
are observed between different plant assemblages. One of those
patterns is the so called
“canopy effect” that corresponds to a vertical
gradient in the
δ
13C values of forest trees, with high
δ
13C values at the
top of the canopy and low values at the bottom, and to a
13C depletion
in plants growing under forested closed canopy relative to the same
plant type subject to more open growing conditions (e.g., reviews in
Broadmeadow and Grif
fiths, 1993; Heaton, 1999
). This
13C depletion in
plants growing under forested closed canopies may be linked to the
combination of two factors: (1) atmospheric CO
2available to plants in
poorly ventilated understory is
13C depleted relative to the general
atmosphere as the result of CO
2recycling from leaf litter (e.g.
Schleser
and Jayasekera, 1985; Gebauer and Schulze, 1991; van der Merwe and
Medina, 1991
), (2) a CO
2concentration gradient and light attenuation
under the forest canopy leads to depleted
13C abundances in
understory plants due to change in photosynthetic activity and
⁎ Corresponding author. Institut für Ur- und Frühgeschichte und Archäologie des Mittelalters, Naturwissenschaftliche Archäologie, Universität Tübingen, Rümelinstr. 23, D-72070 Tübingen. Tel.: +49 (0)7071 29 76 519.
stomatal conductance (e.g.
Francey et al., 1985; Ehleringer et al., 1986;
Gebauer and Schulze, 1991; Broadmeadow et al., 1992
). Some authors
also invoke a higher water availability for plants growing under
canopies relative to plants growing in more exposed sites (
Broad-meadow et al., 1992; Brooks et al., 1997
). Consequently, the intensity of
canopy effect is expected to depend on the characteristics of the
canopy. General trends are that the more complex and denser the
canopy, the greater the extent of light reduction and the degree of
recycling of respired forest
floor CO
2within the understory layers
(
France, 1996
). For a signi
ficant
13C depletion to be observed in
arboreal plant formations, two conditions need to be ful
filled: CO
2produced by plant respiration is con
fined and the gradient of CO
2is
not dissipated by wind turbulence (e.g.,
Broadmeadow and Grif
fiths,
1993; France, 1996; Roche, 1999
), and the light attenuation is suf
ficient
thanks to a high Leaf Area Index (
Broadmeadow and Grif
fiths, 1993;
Buchmann et al., 1997
).
The
“canopy effect” causing changes in
13C abundances of plants is
expected to be passed on to herbivores feeding on understory
vegetation. Indeed, some studies tentatively established links
between
13C abundances in animals and the canopy effect. For
instance, depleted
13C abundance has been shown in tissues from
elephants living in tropical forest compared to those living in
savannah (
van der Merwe et al., 1990; Vogel et al., 1990
), but the
occurrence of C
4plants with
δ
13C values as high as
−12‰ in savanna
grass may contribute to an exaggeration of the difference between the
δ
13C values of both populations. Also, the more negative
δ
13C values
measured in South American monkeys living in closed canopy forest
compared to those living in more open environments presented by
Schoeninger et al. (1997)
may be partly due to differences in dietary
specialisation between the considered species. One recent attempt to
document canopy effect in red deer collagen
δ
13C values based on the
comparative study of
five European populations from C
3contexts
remains unconvincing (
Stevens et al., 2006
), but this outcome is more
due to the dif
ficulty of finding red deer populations unaffected by
anthropogenic interferences rather than on the absence of the canopy
effect (see discussion in the present paper). Finally, there is no ideal
example showing a signi
ficant difference in δ
13C values for two
populations of the same species, one living under a closed-canopy
forest and the other one living in a more open C
3environment.
The potential of
13C measurement of herbivore tissue for tracking
the degree of closure of habitat is an important question to address.
Indeed, climatic
fluctuations in the past has led to major vegetation
changes, as it was the case of the transition from Late-Glacial to Early
Holocene (ca 15,000
–6000 years cal BP) in western Europe. As a result
of global climatic warming, the vegetation composition changed
drastically from steppe
–tundra dominated by grass and herbaceous
dicotyledones to temperate dense deciduous forest through
inter-mediate stages of open boreal-like forests as reconstructed from
pollen records (e.g.
Amman and Lotter, 1989; Beaulieu et al., 1994a,b
).
Among game species, arctic-steppe species like reindeer (Rangifer
tarandus) and bison (Bison priscus) were gradually replaced by
temperate species like aurochs (Bos primigenius), red deer (Cervus
elaphus) and roe deer (Capreolus capreolus) after a period of
co-existence during the Late Glacial Interstadial. Late-glacial and Early
Holocene major change of landscape provoked a change in the
subsistence strategies of prehistoric populations linked to the change
in the habitat of their game. Therefore, it is of high interest to de
fine
the degree of opening of the habitat of ancient herbivores using their
δ
13C values. In this context, the decrease in herbivore
13C abundances
during Late-Glacial
–Early Holocene transition in western Europe has
been attributed to the increasing forest cover at this time (
Drucker
et al., 2003; Noe-Nyggard et al., 2005
). In contrast, some papers
consider that the decrease in
13C abundance of herbivores during this
period essentially results from an increase in CO
2concentration in the
atmosphere along with a decrease in plant
13C abundance (
Richards
and Hedges, 2003; Stevens and Hedges, 2004
).
We wanted to determine whether the canopy effect is a convincing
explanation for the observed decrease in carbon-13 abundance in
herbivores during the Late-Glacial/Early Holocene transition. For this
purpose, we address the following two questions. First, in modern
boreal and temperate environments, can the canopy effect result in
depletion of
13C abundance in tissues of large herbivores regardless of
their forage preferences? Second, during the Late-Glacial and Early
Holocene, did the pattern and timing of the decline in
13C abundance
in herbivores vary according to species and geographical location?
Such variation is expected if a local parameter, such as canopy effect,
rather than a global parameter, such as atmospheric CO
2content, is
primarily involved in the herbivore
13C depletion.
2. Background information on habitat and dietary specialisation
of the studied ruminants
The present study includes carbon isotopic data from modern
representatives of
five herbivore species, all belonging to the
Artiodac-tyla and more speci
fically to the Ruminantia. Three of them are cervids:
reindeer (Rangifer tarandus), roe deer (Capreolus capreolus), red deer
(Cervus elaphus). The two others are bovini: American bison (Bison
bison), and European wisent (Bison bonasus). These species have been
selected on the basis of several factors: (1) a similar digestive physiology
based on rumination, (2) well-monitored populations with minimal
anthropogenic interference, living under closed-canopy and more open
conditions (reindeer, roe deer, red deer), (3) remains of such taxa are
often abundant in the Late-Glacial and/or Early Holocene archaeological
sites from France. Two extinct bovini are also considered here, steppe
bison (Bison priscus) and aurochs (Bos primigenius), and ancient domestic
cattle (Bos taurus), which was used for comparison with its wild relatives
during the Early Holocene.
Reindeer (Rangifer tarandus) is a medium-sized deer adapted to
arctic and boreal environments, with a circum-polar modern
distribution. In Canada, two main ecotypes are recognized, one
dwelling essentially in the arctic tundra, the barren-ground caribou,
the other one dwelling all year long in old-growth mature boreal
forest, the woodland caribou (e.g.
Kelsall, 1968; Russell, 1998
). Wild
reindeer from Siberia dwell in varying habitats, from arctic tundra to
more forested environments. Reindeer are mixed feeders, quite plastic
in their food habits. They consume a large range of vascular plants,
including shrub leaves, forbs, and graminoids (grass, carex). In
contrast with other herbivores, reindeer have the ability to sustain
primarily on large amounts of lichen, in tundra as well as in boreal
forest (e.g.,
Flerov, 1952; Kelsall, 1968; Lindgren et al., 1983; Rettie
et al., 1997; Russell, 1998; de Bellefeuille, 2001
). Living outside the
geographical range of cultivated areas, caribou from mainland North
America is one of the few deer with populations dwelling in
contrasted habitats with similar diet composition, but without
signi
ficant anthropogenic interferences. It is therefore a good
candidate to test the impact of canopy effect on
δ
13C values.
Nonetheless this species disappears from the fossil record at the end
of the Late-Glacial, around 12,000 years ago in France (e.g.,
Bridault
et al., 2000
), whereas it is still documented during the last cold
oscillation of the Late-Glacial in Belgium and northern Germany
(
Charles, 1993; Baales,1996
) and at the beginning of Holocene in Great
Britain and Southern Scandinavia (e.g.,
Coard and Chamberlain, 1999;
Ukkonen et al., 2006; Aaris-Sorensen et al., 2007
).
Red deer (Cervus elaphus), called elk in Eurasia and wapiti in North
America, is a large sized deer with great ecological plasticity, living
under a large diversity of habitats including steppe, boreal and closed
temperate forests (
Geist, 1999
). It is an opportunistic mixed feeder
(
Hoffmann, 1989
), whose diet includes edible portions of trees and
shrubs, forbs, grass and sedges (e.g.,
Gebczynska, 1980; Heptner et al.,
1989; Gebert and Verheyden-Tixier, 2001
). European red deer tend to
favour forbs, foliage and browse, while Siberian and American red
deer consume higher proportions of grass (
Geist, 1999
). In Europe,
most red deer populations live close to areas of human activities,
making it very dif
ficult to avoid anthropogenic interference. However,
this species was present in many parts of France during the Late
Pleistocene and the Holocene without discontinuity.
Roe deer (Capreolus capreolus) is a small deer ranging from Europe
to Siberia (
Geist, 1999
). They are specialised concentrate feeders and
consume selectively the nutrient-rich parts of plants (
Hoffmann,
1989
). They may live in a wide variety of habitats, occurring in almost
all of the natural habitats found in Europe, including deciduous,
coniferous and Mediterranean forests, shrublands, moorlands and
marshes. Only high alpine areas and the most open grasslands are
rarely occupied (
Linnell et al., 1998; Geist, 1999
). As for red deer, most
European roe deer populations live close to areas of human activities,
making it very dif
ficult to avoid anthropogenic interference. This
species was present in southern France since the beginning of the
Bölling (e.g.,
Hufthammer and Aaris-Sorensen, 1998
) and expanded
later in northern areas (
Bridault and Chaix, 2002
).
The bovini considered here belong to several species: American
bison (Bison bison), European wisent (Bison bonasus), steppe bison
(Bison priscus) and aurochs (Bos primigenius). The last two species,
nowadays extinct, are present in the Late-glacial and early Holocene
deposits of France. Both modern bison species have narrowly escaped
extinction during historical periods and correspond to relic or
reintroduced populations. The American bison is found in grassland
and woodland habitats in USA and Canada. American bison are grazers
that consume essentially graminoids (i.e. grass and sedges) (e.g.,
Plumb and Dodd, 1993; Coppedege et al., 1998; Fortin et al., 2003
).
European bison includes some browse in their diet, but a majority of
their forage is composed of graminoids (
Pucek et al., 2002
). Among
ruminants, it is classi
fied as a grass/roughage eater (
Hoffmann, 1989
).
The extinct steppe bison Bison priscus and the aurochs Bos primigenius
were both grass eaters with slightly different ecological preferences,
drier steppes in the case of steppe bison and more wooded and humid
contexts for aurochs (
von Koenigswald, 1999
).
An additional advantage to choose these species is the possibility
to compare carbon isotopic results for specialised feeders, such as roe
deer, with those of more generalists, such as red deer and bison, in the
same environment. The dietary characteristics of these species are
summarized in
Fig. 1
. It will be therefore possible to compare the
carbon isotope variations for species which do not change their diet
between open and closed habitats and for species which can change
their diet when they change habitat.
3. Materials and methods
To investigate evidence for the canopy effect in high and mid-latitude
environments, we used carbon isotopic data from herbivores of modern
ecosystems ranging from open tundra to dense temperate forest. We
concentrated our efforts on those ecosystems for which a maximum of
information was available about the ecology of the animals, especially
their diet and the plant formations where they live, and about the carbon
isotopic data of animals and the plants they fed on.
Fig. 1. Dietary classification of the studied species (modified fromHoffmann, 1989; Kie et al., 2003).
Table 1
Description of the modern ecosystems selected to investigate the impact of the canopy effect on carbon-13 abundances in plants and herbivores
Taxon Material Location–temperature–precipitation Environment References Reindeer Collagen Qamanirjuaq (Nunavut, Canada) 0–200 m asl, 60–64° N,
93–97°W Min temp=−32 °C, max temp=+5 °C Annual prec.b250 mm/year
Arctic tundra Drucker et al. (2001) Reindeer Hair Queen Maud Gulf (Nunavut, Canada) 200–500 m asl, 60–68° N, 105–120°W Min
temp =−32 °C, max temp=+5 °C Annual prec.b250 mm/year
Arctic tundra This study Red deer American
bison Reindeer
Hair Central Saskatchewan, Canada 53°63’N, 106°2'W Mean temp=0.4 °C, min temp =−25 °C, max temp=+25 °C Annual prec.=400–500 mm/year
boreal forest, primarily aspen, spruce, pine, poplar
Urton and Hobson, 2005 Reindeer Collagen Northeastern Yakutia, 0–200 m, 66°N, 150°E Min temp=−40 °C,
max temp = +13 °C Annual prec. = 200 mm/year
Open taiga/tundra Bocherens et al., 1996 Red deer Roe deer Collagen Cis-Baikal, Siberia, 400–3000 m asl, 51°–56°N, 102°–110°E Mean temp=−0.7 °C,
Min temp =−30 °C, max temp=+25 °C Annual prec.=495 mm/year
boreal forest/steppe transitional zone primarily pines, larches, cedars, spruces, firs with a mixture of poplar, birch, aspen
Weber et al., 2002
Red deer Roe deer European bison
Collagen Bialowieza Forest, Poland, 147–172 m asl 52°43'N, 23°50’E mean temp = 6.8 °C, min temp =−4.7 °C, max temp=+17.8 °C annual prec. = 641 mm/year
temperate deciduous forest zone primarily oak, lime, hornbeam with a mixture of ash, maple and elm
Bocherens and Drucker, 2003, and this work Roe deer Collagen Dourdan Forest, France, 100 m asl 48°19'N, 2°01'E mean temp = 11.7 °C,
min temp = 3 °C, max temp = 18.5 °C annual prec. = 630 mm/year
temperate deciduous forest, primarily beech
Rodière et al., 1996
The selected modern specimens and their origin are described in
detail in
Table 1
and the location of the sites is shown on
Fig. 2
. To
avoid anthropogenic in
fluences on the isotopic record of the diet as
much as possible, our selected large herbivores were free-ranging
wild animals. Bone and hair material of modern ruminants comes
from seven localities in North America and Eurasia (
Table 1
;
Fig. 2
).
Caribou and reindeer from open (Queen Maud Gulf, Qamanirjuaq,
Northern Yakutia) and closed forested (Central Saskatchewan)
environments have been selected. Red deer specimens are from
closed forested environments (Central Saskatchewan and Bialowieza
Forest National Park) and more open environments (Cis-Baikal). Roe
deer specimens are also from closed forested environments (Dourdan
forest and Bialowieza Forest National Park) and more open
ments (Cis-Baikal). Bison specimens are from closed forest
environ-ments (Central Saskatchewan and Bialowieza Forest National Park).
Except for Queen Maud Gulf caribou which are unpublished data, all of
the isotopic data were previously published in various works (
Table 1
).
In the present paper, they were corrected from variations of
δ
13C
values in atmospheric CO
2between 1966 and 2003.
Isotopic data from modern large herbivores were obtained for hair
keratin and bone collagen, involving different diet-tissue isotopic
discrimination factors, which prevented direct comparison of
δ
13C
values. Therefore, measured
δ
13C values were converted to diet
δ
13C
values (
δ
13C
diet
) using the average fractionation factor between the
mean diet and the considered tissue inferred from the literature
(
Vogel, 1978; van der Merwe, 1989; Ambrose, 1993; Rodière et al.,
1996; Sponheimer et al., 2003; Ayliffe et al., 2004
) and summarised in
Table 2
. Moreover, since isotopic analyses were performed on
specimens living at different times, we took into account the rapid
changes in
δ
13C value of atmospheric CO
2
linked to modern industrial
activities and deforestation. The
δ
13C
diet
values were thus set to a
similar atmospheric
δ
13C value of
−7‰, the average value during
Upper Pleistocene times (
Leuenberger et al., 1992
) by using a
correction formula presented by
Feng (1998)
.
To examine the decline in
δ
13C values of different species during
the Late-Glacial/Early Holocene transition, we selected ancient bone
specimens of cervids, red deer and roe deer, and large bovines, namely
wild bovine and domestic cattle, from a restricted geographic area, the
Paris Basin. The material comes from seven sites, with chronological
Fig. 2. Map depicting the location of the sites discussed in the text. White stars correspond to modern sites with open environments, black stars correspond to modern sites with closed-canopy environments, white circles correspond to archaeological sites with faunal material documenting the late Glacial to Holocene transition in France.
Table 2 Review of13
C discrimination between hair and collagen of modern large herbivores and their diet
Tissue Taxon Δδ13C tissue-diet Reference
Hair Horse 2.7 Ayliffe et al., 2004 Hair Cattle 2.7 Sponheimer et al., 2003 Hair Goat 3.2 Sponheimer et al., 2003 Hair Alpaca 3.2 Sponheimer et al., 2003 Hair Llama 3.5 Sponheimer et al., 2003 Hair Rabbit 3.4 Sponheimer et al., 2003
MEAN 3.1
SD 0.3
Collagen Bison 5.0 Ambrose, 1993 Collagen Giraffe 5.5 Ambrose, 1993 Collagen C3eater herbivores 5.0 van der Merwe, 1989
Collagen C3eater herbivores 5.3 Vogel, 1978a
Collagen Roe deer 4.5 Rodière et al., 1996
MEAN 5.1
Table 3
Isotopic values for large herbivores from modern ecosystems. Data are fromWeber et al. (2002)for boreal forest–steppe of Siberia, fromRodière et al. (1996)for temperate forest of Dourdan, and fromUrton and Hobson (2005)for boreal forest of western Canada
Species Lab n° Site Habitat Tissue Year δ13C
tissue δ13C diet calculated δ13 C coll— 5.1 δ13 C hair— 3.1 Δ13C atm δ13C diet Calculated corrected Ref.
Reindeer 204 Qamanirjuaq, Nunavut Arctic tundra Collagen 1966 −19.4 −24.5 0.24 −24.2 Drucker et al. (2001) Reindeer 216 Qamanirjuaq, Nunavut Arctic tundra Collagen 1966 −19.5 −24.6 0.24 −24.3 Drucker et al. (2001) Reindeer 692 Qamanirjuaq, Nunavut Arctic tundra Collagen 1967 −19.2 −24.3 0.26 −24.0 Drucker et al. (2001) Reindeer 80 Qamanirjuaq, Nunavut Arctic tundra Collagen 1966 −20.0 −25.1 0.24 −24.8 Drucker et al. (2001) Reindeer 397-1 Qamanirjuaq, Nunavut Arctic tundra Collagen 1967 −19.6 −24.7 0.26 −24.4 Drucker et al. (2001) Reindeer 397-2 Qamanirjuaq, Nunavut Arctic tundra Collagen 1967 −18.8 −23.9 0.26 −23.6 Drucker et al. (2001) Reindeer 22882 Queen Maud Gulf, Nunavut Arctic tundra Hair 2002 −22.4 −25.5 1.20 −24.3 This work Reindeer 22883 Queen Maud Gulf, Nunavut Arctic tundra Hair 2002 −23.0 −26.1 1.20 −24.9 This work Reindeer 22884 Queen Maud Gulf, Nunavut Arctic tundra Hair 2002 −22.0 −25.1 1.20 −23.9 This work Reindeer 22885 Queen Maud Gulf, Nunavut Arctic tundra Hair 2002 −22.4 −25.5 1.20 −24.3 This work Reindeer 22886 Queen Maud Gulf, Nunavut Arctic tundra Hair 2002 −22.6 −25.7 1.20 −24.5 This work Reindeer 22968 Queen Maud Gulf, Nunavut Arctic tundra Hair 2003 −22.9 −26.0 1.23 −24.7 This work Reindeer 22969 Queen Maud Gulf, Nunavut Arctic tundra Hair 2003 −23.1 −26.2 1.23 −24.9 This work Reindeer 22970 Queen Maud Gulf, Nunavut Arctic tundra Hair 2003 −22.5 −25.6 1.23 −24.3 This work Reindeer 22971 Queen Maud Gulf, Nunavut Arctic tundra Hair 2003 −22.4 −25.5 1.23 −24.3 This work Reindeer 22972 Queen Maud Gulf, Nunavut Arctic tundra Hair 2003 −22.8 −25.9 1.23 −24.7 This work Reindeer 22973 Queen Maud Gulf, Nunavut Arctic tundra Hair 2003 −22.8 −25.9 1.23 −24.7 This work Reindeer 22974 Queen Maud Gulf, Nunavut Arctic tundra Hair 2003 −23.1 −26.2 1.23 −24.9 This work Reindeer 22975 Queen Maud Gulf, Nunavut Arctic tundra Hair 2003 −22.0 −25.1 1.23 −23.9 This work Reindeer 22976 Queen Maud Gulf, Nunavut Arctic tundra Hair 2003 −22.9 −26.0 1.23 −24.8 This work Reindeer 22977 Queen Maud Gulf, Nunavut Arctic tundra Hair 2003 −22.4 −25.5 1.23 −24.2 This work Reindeer 22978 Queen Maud Gulf, Nunavut Arctic tundra Hair 2003 −21.9 −25.0 1.23 −23.8 This work Reindeer 22980 Queen Maud Gulf, Nunavut Arctic tundra Hair 2003 −23.4 −26.5 1.23 −25.3 This work Reindeer 22981 Queen Maud Gulf, Nunavut Arctic tundra Hair 2003 −23.0 −26.1 1.23 −24.9 This work Reindeer 22982 Queen Maud Gulf, Nunavut Arctic tundra Hair 2003 −22.8 −25.9 1.23 −24.6 This work Reindeer 22983 Queen Maud Gulf, Nunavut Arctic tundra Hair 2003 −22.3 −25.4 1.23 −24.1 This work Reindeer 22984 Queen Maud Gulf, Nunavut Arctic tundra Hair 2003 −23.0 −26.1 1.23 −24.9 This work Reindeer 22985 Queen Maud Gulf, Nunavut Arctic tundra Hair 2003 −22.2 −25.3 1.23 −24.0 This work Reindeer 28053 Queen Maud Gulf, Nunavut Arctic tundra Hair 2003 −22.1 −25.2 1.23 −23.9 This work Reindeer 28054 Queen Maud Gulf, Nunavut Arctic tundra Hair 2003 −21.7 −24.8 1.23 −23.6 This work
Reindeer 22924 Central Saskatchewan Boreal forest Hair 1992 −23.4 −26.5 0.85 −25.6 Urton and Hobson (2005) Reindeer 22925 Central Saskatchewan Boreal forest Hair 1992 −23.7 −26.8 0.85 −25.9 Urton and Hobson (2005) Reindeer 22928 Central Saskatchewan Boreal forest Hair 1993 −23.7 −26.8 0.88 −25.9 Urton and Hobson (2005) Reindeer 22931 Central Saskatchewan Boreal forest Hair 1996 −23.6 −26.7 0.98 −25.7 Urton and Hobson (2005) Reindeer 22936 Central Saskatchewan Boreal forest Hair 1994 −23.8 −26.9 0.91 −25.9 Urton and Hobson (2005) Reindeer 22939 Central Saskatchewan Boreal forest Hair 1994 −23.6 −26.7 0.91 −25.8 Urton and Hobson (2005) Reindeer 22940 Central Saskatchewan Boreal forest Hair 1994 −23.3 −26.4 0.91 −25.5 Urton and Hobson (2005) Reindeer 22943 Central Saskatchewan Boreal forest Hair 1994 −23.3 −26.4 0.91 −25.5 Urton and Hobson (2005) Reindeer 22946 Central Saskatchewan Boreal forest Hair 1994 −22.9 −26.0 0.91 −25.1 Urton and Hobson (2005) Reindeer 22948 Central Saskatchewan Boreal forest Hair 1994 −23.8 −26.9 0.91 −26.0 Urton and Hobson (2005) Reindeer 22949 Central Saskatchewan Boreal forest Hair 1995 −23.5 −26.6 0.95 −25.6 Urton and Hobson (2005) Reindeer 22951 Central Saskatchewan Boreal forest Hair 1995 −24.0 −27.1 0.95 −26.1 Urton and Hobson (2005) Reindeer 22957 Central Saskatchewan Boreal forest Hair 1995 −23.3 −26.4 0.95 −25.4 Urton and Hobson (2005) Reindeer 22958 Central Saskatchewan Boreal forest Hair 1995 −22.6 −25.7 0.95 −24.7 Urton and Hobson (2005) Reindeer 101300 Northeastern Yakutia Open taiga Collagen 1994 −19.6 −24.7 0.91 −23.8 Bocherens et al. (1996) Reindeer 102300 Northeastern Yakutia Open taiga Collagen 1994 −20.2 −25.3 0.91 −24.4 Bocherens et al. (1996) Reindeer 102800 Northeastern Yakutia Open taiga Collagen 1994 −19.4 −24.5 0.91 −23.6 Bocherens et al. (1996) Reindeer 102900 Northeastern Yakutia Open taiga Collagen 1994 −20.2 −25.3 0.91 −24.4 Bocherens et al. (1996) Reindeer 103000 Northeastern Yakutia Open taiga Collagen 1994 −19.5 −24.6 0.91 −23.7 Bocherens et al. (1996) Red deer 17258 Central Saskatchewan Boreal forest Hair 2002 −25.0 −28.1 1.20 −26.9 Urton and Hobson (2005) Red deer 17259 Central Saskatchewan Boreal forest Hair 2002 −24.8 −27.9 1.20 −26.7 Urton and Hobson (2005) Red deer 17903 Central Saskatchewan Boreal forest Hair 2002 −26.5 −29.6 1.20 −28.4 Urton and Hobson (2005) Red deer 17904 Central Saskatchewan Boreal forest Hair 2002 −26.3 −29.4 1.20 −28.2 Urton and Hobson (2005) Red deer 17906 Central Saskatchewan Boreal forest Hair 2002 −25.6 −28.7 1.20 −27.5 Urton and Hobson (2005) Red deer 17907 Central Saskatchewan Boreal forest Hair 2002 −26.6 −29.7 1.20 −28.5 Urton and Hobson (2005) Red deer 19986 Central Saskatchewan Boreal forest Hair 2002 −27.1 −30.2 1.20 −29.0 Urton and Hobson (2005) Red deer 22557 Central Saskatchewan Boreal forest Hair 2002 −24.2 −27.3 1.20 −26.1 Urton and Hobson (2005) Red deer 22558 Central Saskatchewan Boreal forest Hair 2002 −24.3 −27.4 1.20 −26.2 Urton and Hobson (2005) Red deer 93.052 Cis-Baikal Forest–steppe Collagen 2000 −22.4 −27.5 1.12 −26.4 Weber et al. (2002) Red deer 93.053 Cis-Baikal Forest–steppe Collagen 2000 −20.4 −25.5 1.12 −24.4 Weber et al. (2002) Red deer 93.066 Cis-Baikal Forest–steppe Collagen 2000 −22.7 −27.8 1.12 −26.7 Weber et al. (2002) Red deer 93.149 Cis-Baikal Forest–steppe Collagen 2000 −22.1 −27.2 1.12 −26.1 Weber et al. (2002) Red deer BLW700 Bialowieza Forest Deciduous forest Collagen 1970 −21.7 −26.8 0.31 −26.5 This work Red deer BLW800 Bialowieza Forest Deciduous forest Collagen 1970 −24.2 −29.3 0.31 −29.0 This work Red deer BLW900 Bialowieza Forest Deciduous forest Collagen 1970 −24.1 −29.2 0.31 −28.9 This work Red deer BLW1000 Bialowieza Forest Deciduous forest Collagen 1970 −23.9 −29.0 0.31 −28.7 This work Red deer BLW1100 Bialowieza Forest Deciduous forest Collagen 1970 −23.1 −28.2 0.31 −27.9 This work Red deer ACT500 Bialowieza Forest Deciduous forest Collagen 1994 −24.2 −29.3 0.91 −28.4 This work Roe deer 93.057 Cis-Baikal Forest–steppe Collagen 2000 −20.6 −25.7 1.12 −24.6 Weber et al. (2002) Roe deer 93.058 Cis-Baikal Forest–steppe Collagen 2000 −20 −25.1 1.12 −24.0 Weber et al. (2002) Roe deer 93.059 Cis-Baikal Forest–steppe Collagen 2000 −21.6 −26.7 1.12 −25.6 Weber et al. (2002)
(continued on next page) (continued on next page)
attributions based on archaeological descriptions presented in the
original works. In this paper, the term wild bovine refers to bison
(Bison sp.) and aurochs (Bos primigenius). When the species was
speci
fically identified by osteological analysis, bison and aurochs
provided the same collagen
δ
13C values (
Bocherens et al., 2005a,b
; and
unpublished data). The acquired isotopic data were augmented with
data from
Bocherens et al. (2005a,b
) for the site of Louviers, and from
Balasse (1999)
for the sites of Cuiry-les-Chaudardes and Maizy. To
consider
δ
13C trends through time, we adopted the classical
chronological subdivision of Late-Glacial/Early Holocene into
chron-ozones (see
Mangerud et al., 1974
).
Potential regional effects on herbivore
δ
13C values were examined
using samples of red deer from threes sites in the Jura and four sites in
the northern Alps. Both regions, although geographically close, exhibit
differences in faunal succession during the Late-Glacial/Early Holocene
transition (
Bridault and Chaix, 2002
). AMS radiocarbon dating was
performed at the Radiocarbon Laboratory of the University of Groningen
(The Netherlands) on each sample of collagen red deer, which allowed us
to organise our results chronologically. The radiocarbon dates have been
calibrated to cal years BP using the IntCal04 calibration dataset (
Reimer
et al., 2004
) with the software calib.5.0.1.
Isotopic data from modern caribou from Queen Maud Gulf were
measured on hair, after a cleaning protocol following
Urton and
Hobson (2005)
. Isotopic data from all ancient mammals were
performed on skeletal collagen. Collagen extraction on modern and
ancient material was performed following
Bocherens et al. (1997)
. The
reliability of the isotope values were checked using the carbon and
nitrogen elemental composition of the collagen (C
coll, N
coll). Indeed,
isotopically well-preserved collagen exhibit C/N
collratios ranging from
2.9 to 3.6 and percentage of C
colland N
collhigher than 8% and 3%,
respectively (
Ambrose, 1990
). Elemental composition of the extracted
collagen was measured on a CHN-elemental analyzer (Carlo-Erba
NA15000 and Eurovector) coupled to a VG-Optima continuous-
flow
ratio mass spectrometer used for
13C/
12C measurements at the Earth
Science Department of University P. et M. Curie (Paris, France) and in
the Institut des Sciences de l
’Evolution (Université Montpellier 2,
France). Stable isotope ratios are expressed as
δ
13C values relative to
the international standard VPDB, with an analytical error of 0.1
‰.
4. Results
Values of
δ
13C
diet
calculated from modern large herbivores varied
between
−30.4‰ to −23.6‰ with an inter-individual variation within
a given population that does not exceed 3.1
‰, as measured on bison
from Central Saskatchewan (
Table 3
;
Fig. 3
). Reindeer from Canadian
arctic tundra and Siberian open taiga provided some of the highest
Table 3 (continued)
Species Lab n° Site Habitat Tissue Year δ13
C tissue δ13 C diet calculated δ13 C coll— 5.1 δ13C hair— 3.1 Δ13 C atm δ13 C diet Calculated corrected Ref.
Roe deer 93.060 Cis-Baikal Forest–steppe Collagen 2000 −20.4 −25.5 1.12 −24.4 Weber et al. (2002) Roe deer 93.061 Cis-Baikal Forest–steppe Collagen 2000 −20.4 −25.5 1.12 −24.4 Weber et al. (2002) Roe deer 93.062 Cis-Baikal Forest–steppe Collagen 2000 −22.9 −28.0 1.12 −26.9 Weber et al. (2002) Roe deer 1204 Dourdan Forest Deciduous forest Collagen 1990 −23.4 −28.5 0.79 −27.7 Rodière et al. (1996) Roe deer 7200 Dourdan Forest Deciduous forest Collagen 1990 −25.6 −30.7 0.79 −29.9 Rodière et al. (1996) Roe deer 9200 Dourdan Forest Deciduous forest Collagen 1990 −24.7 −29.8 0.79 −29.0 Rodière et al. (1996) Roe deer 10200 Dourdan Forest Deciduous forest Collagen 1990 −25.1 −30.2 0.79 −29.4 Rodière et al. (1996) Roe deer 11200 Dourdan Forest Deciduous forest Collagen 1990 −26.0 −31.1 0.79 −30.3 Rodière et al. (1996) Roe deer 14200 Dourdan Forest Deciduous forest Collagen 1990 −23.8 −28.9 0.79 −28.1 Rodière et al. (1996) Roe deer 15200 Dourdan Forest Deciduous forest Collagen 1990 −25.7 −30.8 0.79 −30.0 Rodière et al. (1996) Roe deer 20200 Dourdan Forest Deciduous forest Collagen 1990 −23.8 −28.9 0.79 −28.1 Rodière et al. (1996) Roe deer 22200 Dourdan Forest Deciduous forest Collagen 1990 −26.1 −31.2 0.79 −30.4 Rodière et al. (1996) Roe deer 23200 Dourdan Forest Deciduous forest Collagen 1990 −24.9 −30.0 0.79 −29.2 Rodière et al. (1996) Roe deer 24200 Dourdan Forest Deciduous forest Collagen 1990 −25.7 −30.8 0.79 −30.0 Rodière et al. (1996) Roe deer 25200 Dourdan Forest Deciduous forest Collagen 1990 −24.9 −30.0 0.79 −29.2 Rodière et al. (1996) Roe deer 26200 Dourdan Forest Deciduous forest Collagen 1990 −25.6 −30.7 0.79 −29.9 Rodière et al. (1996) Roe deer 27200 Dourdan Forest Deciduous forest Collagen 1990 −23.5 −28.6 0.79 −27.8 Rodière et al. (1996) Roe deer 28200 Dourdan Forest Deciduous forest Collagen 1990 −24.1 −29.2 0.79 −28.4 Rodière et al. (1996) Roe deer 29200 Dourdan Forest Deciduous forest Collagen 1990 −23.8 −28.9 0.79 −28.1 Rodière et al. (1996) Roe deer 30200 Dourdan Forest Deciduous forest Collagen 1990 −24.9 −30.0 0.79 −29.2 Rodière et al. (1996) Roe deer 2203 Dourdan Forest Deciduous forest Collagen 1990 −23.7 −28.8 0.79 −28.0 Rodière et al. (1996) Roe deer BLW1200 Bialowieza Forest Deciduous forest Collagen 1969 −23.2 −28.3 0.29 −28.0 Bocherens and Drucker (2003) Roe deer BLW1300 Bialowieza Forest Deciduous forest Collagen 1970 −24.5 −29.6 0.31 −29.3 Bocherens and Drucker (2003) Roe deer BLW1400 Bialowieza Forest Deciduous forest Collagen 1994 −23.5 −28.6 0.91 −27.7 Bocherens and Drucker (2003) Roe deer BLW1500 Bialowieza Forest Deciduous forest Collagen 1994 −24.0 −29.1 0.91 −28.2 Bocherens and Drucker (2003) Roe deer BLW1600 Bialowieza Forest Deciduous forest Collagen 1995 −24.8 −29.9 0.95 −29.0 Bocherens and Drucker (2003) Bison 17270 Central Saskatchewan Boreal forest Hair 2002 −25.1 −28.2 1.20 −27.0 Urton and Hobson (2005) Bison 17271 Central Saskatchewan Boreal forest Hair 2002 −23.5 −26.6 1.20 −25.4 Urton and Hobson (2005) Bison 17272 Central Saskatchewan Boreal forest Hair 2002 −24.7 −27.8 1.20 −26.6 Urton and Hobson (2005) Bison 19969 Central Saskatchewan Boreal forest Hair 2002 −25.4 −28.5 1.20 −27.3 Urton and Hobson (2005) Bison 19970 Central Saskatchewan Boreal forest Hair 2002 −26.3 −29.4 1.20 −28.2 Urton and Hobson (2005) Bison 19972 Central Saskatchewan Boreal forest Hair 2002 −26.6 −29.7 1.20 −28.5 Urton and Hobson (2005) Bison 19973 Central Saskatchewan Boreal forest Hair 2002 −25.7 −28.8 1.20 −27.6 Urton and Hobson (2005) Bison 19974 Central Saskatchewan Boreal forest Hair 2002 −25.9 −29.0 1.20 −27.8 Urton and Hobson (2005) Bison 19975 Central Saskatchewan Boreal forest Hair 2002 −25.9 −29.0 1.20 −27.8 Urton and Hobson (2005) Bison BLW100 Bialowieza Forest Deciduous forest Collagen 1987 −23.2 −28.3 0.71 −27.6 Bocherens and Drucker (2003) Bison BLW300 Bialowieza Forest Deciduous forest Collagen 1998 −23.0 −28.1 1.05 −27.1 Bocherens and Drucker (2003) Bison BLW400 Bialowieza Forest Deciduous forest Collagen 1998 −23.7 −28.8 1.05 −27.8 Bocherens and Drucker (2003) Bison BLW500 Bialowieza Forest Deciduous forest Collagen 1999 −24.4 −29.5 1.08 −28.4 Bocherens and Drucker (2003) Bison BLW600 Bialowieza Forest Deciduous forest Collagen 1999 −25.6 −30.7 1.08 −29.6 Bocherens and Drucker (2003) Bison ACT400 Bialowieza Forest Deciduous forest Collagen 1994 −23.6 −28.7 0.91 −27.8 Bocherens and Drucker (2003) Tissueδ13
C values correspond to those measured on a given tissue; calculatedδ13
Cdietcorresponds to theδ13C values of the mean diet of the herbivore inferred from the meanΔδ13C
tissue-diet calculated inTable 2.Δ13
C atm stands for the difference in the atmospheric CO2δ13C value between the date of the sampling and the Upper Pleistocene time (−7‰ in
average). Correctedδ13C
δ
13C
diet
values, while roe deer from temperate forests in Europe
exhibited some of the lowest
δ
13C
dietvalues.
For a given species, the populations dwelling in a closed canopy
forest always exhibited signi
ficantly lower δ
13C values than
popula-tions dwelling in a more open environment. This is observed when
comparing woodland caribou on one hand with barren-ground
caribou and open taiga reindeer on the other hand, red deer from
boreal or temperate closed canopy forests with red deer from open
forest
–steppe, roe deer from temperate closed canopy forests with roe
deer from steppe and forest
–steppe (
Fig. 3
;
Table 4
). In contrast, when
dealing with a similar type of habitat, open or closed, no signi
ficant
difference is observed despite clear differences in the geographical
origin, the climatic conditions, and the
floristic composition. For
instance, roe deer from the temperate forest from Dourdan,
dominated by beech and roe deer from Bialowieza forest, dominated
by oak, lime and hornbeam, exhibit equivalent
δ
13C values despite a
difference of 6 °C between the average annual temperatures in both
locations (
Table 1
). Moreover, the
δ
13C values of a given taxon in
closed canopy forest of boreal or temperate type are not signi
ficantly
different, as for bison and red deer from Central Saskatchewan and
Bialowieza Forest (
Fig. 3
;
Table 4
). In open environments,
barren-ground caribou from both Canadian populations and open taiga
reindeer from Yakutia also exhibit equivalent
δ
13C values (
Table 4
).
These results are not affected by the tissue used to calculate the
δ
13C
value of the diet, as well illustrated by barren-ground caribou from
Queen Maud Gulf or Qamanirjuaq herds, which provided equivalent
δ
13C
diet
although hair or collagen were sampled.
During the Late-Glacial/Early Holocene transition, the
δ
13C
dietvalues of cervids and large bovines from Paris Basin exhibited a
signi
ficant decrease (
Table 5
;
Fig. 4
); however, this decrease differed
among species. Indeed, depletion of
δ
13C
diet
values through the
transition was more pronounced for wild bovine (
−3.3‰) than for
red deer (
−2.2‰) and roe deer (−2.7‰). As a result, δ
13C
diet
values of
wild bovine were comparable to those of red deer and roe deer during
the Boreal/early Atlantic transition (ca. 9100
–8000 years cal BP),
whereas they were signi
ficantly higher (Mann–Whitney U-test,
U = 21.0, p
b0.005) during the Bölling time (ca. 14,700–13,900 years
cal BP). The
δ
13C
diet
values of roe deer reached a minimum during the
early Atlantic (ca. 9000
–7000 years cal BP) after which a small
increase was observed. The
δ
13C
diet
values of red deer and wild bovine
changed slightly at the end of the Atlantic, towards less depleted
values for red deer and more depleted values for wild bovine.
Domestic cattle present similar
δ
13C
diet
values as wild bovine during
the early Atlantic. In the late Atlantic, the
δ
13C
diet
values of domestic
cattle changed towards signi
ficantly less-depleted values than wild
bovine (Mann
–Whitney U-test, pb0.0001, U=4.0, nN10).
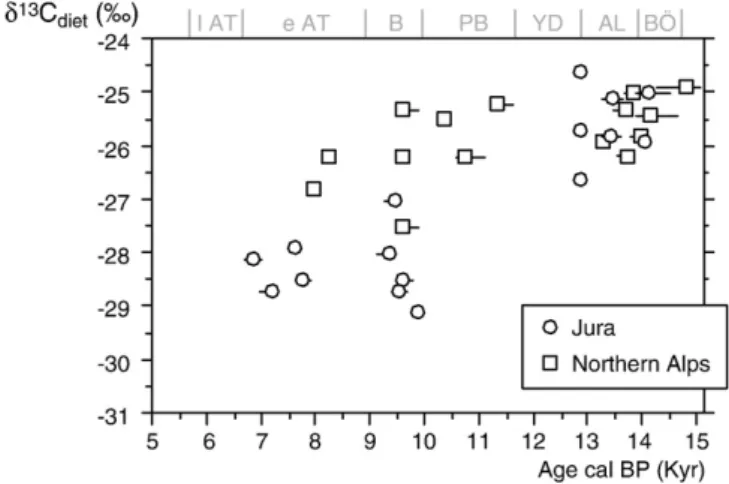
Dated specimens of red deer from Jura and northern Alps exhibited
a general trend of decreasing
δ
13C
dietvalues over the Late-Glacial/
Early Holocene transition (
Tables 6 and 7
;
Fig. 5
). Red deer
δ
13C
dietvalues ranged between
−24‰ and −27‰ during the Bölling/Alleröd
period for both Jura and northern Alps areas. After the Younger Dryas,
red deer
δ
13C
diet
values ranged from
−27‰ to −29.1‰ in the Jura,
while red deer from the northern Alps had
δ
13C
diet
values similar to
those observed before the Younger Dryas. As a result, the Late-Glacial/
Early Holocene trend in red deer towards about 3
‰ lower δ
13C
diet
values is evidenced in the Jura, but not in the northern Alps. This
con
firms that, in addition to global change, local factors can account
for changes in
δ
13C
dietof large herbivores at the Early Holocene.
5. Discussion
5.1. Modern ecosystems
For every species considered, the populations dwelling under
closed canopy habitats exhibit signi
ficantly lower δ
13C values than
those dwelling under more open conditions. This was not simply
linked to shift from grazing to browsing with increasing forest cover,
since it occurred for a specialist feeder like roe deer as well as for a
generalist one like red deer. This was not surprising since vascular
plants show depleted
13C abundances under closed canopy cover
compared to more open conditions. A good illustration of this is the
comparison of
δ
13C values from
Brooks et al. (1997)
for boreal forest
Fig. 3. Review ofδ13Cdietvalues of herbivores from modern ecosystems from North
America and Eurasia. Closed-canopy environments are underlined.
Table 4
Statistical comparisons (Mann–Whitney) of δ13C values obtained on populations from a given species
Taxon Tissue Environments (n) Type Statistical comparison
Rangifer tarandus C/H Qamanirjuaq (arctic tundra) (n = 6) / Queen Maud Gulf (arctic tundra) (n = 24) O/O p = 0.32, U = 53.0 Rangifer tarandus C/C Qamanirjuaq (arctic tundra) (n = 6) / NE Yakutia (open taiga) (n = 5) O/O p = 0.52, U = 11.5 Rangifer tarandus H/C Queen Maud Gulf (arctic tundra) (n = 24) / NE Yakutia (open taiga) (n = 5) O/O p = 0.13, U = 38.5 Cervus elaphus H/C Prince Albert Natl. Park (boreal forest) (n = 9) / Bialowieza Natl. Park (temperate forest) (n = 6) C/C p = 0.19, U = 16.0 Capreolus capreolus C/C Dourdan forest (temperate forest) (n = 18) / Bialowieza Natl. Park (temperate forest) (n = 5) C/C p = 0.19, U = 27.5 Bison sp. H/C Prince Albert Natl. Park (boreal forest) (n = 9) / Bialowieza Natl. Park (temperate forest) (n = 6) C/C p = 0.26, U = 17.5 Rangifer tarandus C + H/H Qamanirjuaq + Queen Maud Gulf (arctic tundra) (n = 30) / Prince Albert Natl. Park (boreal forest) (n = 14) O/C p
<
0.0001,U=10.5 Rangifer tarandus H/H Queen Maud Gulf (arctic tundra) (n = 24) / Prince Albert Natl. Park (boreal forest) (n = 14) O/C P<
0.0001,U=9.5 Cervus elaphus C/C Cis-Baikal (forest–steppe) (n=6) / Bialowieza Natl. Park (temperate forest) (n=6) O/C p=0.02, U=1.0 Cervus elaphus C/H Cis-Baikal (forest–steppe) (n=6) / Prince Albert Natl. Park (boreal forest) (n=9) O/C p=0.02, U=6.0 Capreolus capreolus C/C Cis-Baikal (forest–steppe) (n=6) / Dourdan forest+Bialowieza Natl. Park (temperate forest) (n=23) O/C p=0.0002, U=0.0 Statistically significant results are shown in bold.Table 5
Isotopic results for ancient large herbivores from the Paris Basin. Data are fromBocherens et al. (2005a,b)for Louviers site and fromBalasse (1999)for Cuiry-les-Chaudardes and Maizy sites
Species Lab n° Site Sample Excavation n° Chronozone Ccoll (%) Ncoll (%) C/Ncoll δ13C coll (‰) δ13C diet (‰) Red deer BRG2800 Bois-Ragot (layer 5) Left tibia BR 5 I5 736 Bölling 24.6 8.7 3.3 −20.8 −25.9 Red deer BRG2900 Bois-Ragot (layer 5) Right radius BR 5 I1 434 Bölling 19.5 7.7 2.9 −20.0 −25.1 Red deer BRG3000 Bois-Ragot (layer 5) Left humerus BR 5 H2 1096 Bölling 21.5 7.4 3.4 −21.0 −26.1 Red deer BRG4200 Bois-Ragot (layer 4) Left scapula BR 4 I7 252 Bölling 33.2 12.3 3.1 −20.6 −25.7 Red deer BRG4300 Bois-Ragot (layer 4) Left scapula BR 4 J1 67 Bölling 30.1 11.4 3.1 −21.0 −26.1 Red deer BRG4400 Bois-Ragot (layer 4) Right metacarpal BR 4 H2 249 Bölling 36.8 13.3 3.2 −19.7 −24.8 Red deer BRG4500 Bois-Ragot (layer 4) Right metacarpal BR 4 H6 1 Bölling 30.9 12.0 3.0 −20.5 −25.6 Red deer BRG4600 Bois-Ragot (layer 4) Right metatarsal BR 4 H2 163 Bölling 37.5 13.8 3.2 −20.4 −25.5 Red deer BRG4700 Bois-Ragot (layer 4) Right metatarsal BR 4 J7 68 Bölling 32.4 12.3 3.1 −20.1 −25.2 Red deer BRG4800 Bois-Ragot (layer 4) Right metatarsal BR 4 I1 195 Bölling 24.9 9.7 3.0 −21.3 −26.4 Red deer BRG5900 Bois-Ragot (layer 3) Metatarsal BR 3 J3 Bölling 35.4 12.8 3.2 −20.9 −26.0 Red deer BRG6000 Bois-Ragot (layer 3) Radius BR 3 H7-7 Bölling 38.8 14.7 3.1 −20.3 −25.4 Red deer CLS1000 Le Closeau (locus 46) Left tibia LC97IFP3S6L46 E268 139 Bölling 38.0 13.8 3.2 −20.1 −25.2 Red deer CLS1100 Le Closeau (locus 46) Left tibia LC97IFP3S6L46 E270 67 Bölling 35.4 12.8 3.2 −20.2 −25.3 Red deer CLS1200–3 Le Closeau (locus 46) Left tibia LC97IFP3S6L46 D268 280 Bölling 40.5 14.7 3.2 −20.4 −25.5 Red deer CLS1300 Le Closeau (locus 46) Right tibia LC97IFP3S6L46 E267 13 Bölling 38.1 13.9 3.2 −20.5 −25.6 Red deer CLS1400–1 Le Closeau (locus 46) Right tibia LC97IFP3S6L46 D267 82 Bölling 39.1 14.3 3.2 −20.2 −25.3 Red deer CLS1500 Le Closeau (locus 46) Right tibia LC97IFP3S6L46 Z266 15 Bölling 39.1 14.2 3.2 −20.5 −25.6 Red deer NO100 Noyen-sur-Seine (layer 9) Right radius 84 XVI C150-8 Boreal/Atlantic 41.6 15.1 3.2 −22.8 −27.9 Red deer NO300 Noyen-sur-Seine (layer 7d) Left humerus 84 XV Z153-7 Boreal/Atlantic 39.7 14.2 3.3 −22.7 −27.8 Red deer NO400 Noyen-sur-Seine (layer 9) Left humerus 84 XVI H140-6 Boreal/Atlantic 42.0 15.8 3.0 −22.3 −27.4 Red deer NO600 Noyen-sur-Seine (layer 9) Left radius 84 XVI D144-6 Boreal/Atlantic 41.6 14.8 3.3 −23.1 −28.2 Red deer NO4800 Noyen-sur-Seine (layer 9) Left metacapal 84 XVI E137-12 Boreal/Atlantic 41.8 15.1 3.2 −22.5 −27.6 Red deer NO5000 Noyen-sur-Seine (layer 9) Left metacapal 84 XVI D143-15 Boreal/Atlantic 42.5 15.6 3.2 −22.5 −27.6 Red deer CCF cer 1 Cuiry-les-Chaudardes n.g. n.g. Early Atlantic 40.2 14.7 3.2 −22.8 −27.9 Red deer CCF cer 2 Cuiry-les-Chaudardes n.g. n.g. Early Atlantic 39.9 14.6 3.2 −22.7 −27.8 Red deer CCF cer 3 Cuiry-les-Chaudardes n.g. n.g. Early Atlantic 39.3 14.4 3.2 −23.4 −28.5 Red deer CCF cer 4 Cuiry-les-Chaudardes n.g. n.g. Early Atlantic 32.4 11.8 3.2 −20.6 −25.7 Red deer CCF cer 5 Cuiry-les-Chaudardes n.g. n.g. Early Atlantic 41.3 15.2 3.2 −24.0 −29.1 Red deer MGA cer 1 Maizy n.g. n.g. Late Atlantic 40.5 14.8 3.2 −20.2 −25.3 Red deer MGA cer 2 Maizy n.g. n.g. Late Atlantic 41.8 15.4 3.2 −22.7 −27.8 Red deer MGA cer 3 Maizy n.g. n.g. Late Atlantic 36.9 13.5 3.2 −22.2 −27.3 Red deer MGA cer 4 Maizy n.g. n.g. Late Atlantic 40.8 15.0 3.2 −22.9 −28.0 Red deer B2601 Bercy Humerus QS, L XVI,25 c21 Late Atlantic 39.4 13.3 3.5 −23.0 −28.1 Red deer B5000 Bercy Radius QS, M XV,8 c2 Late Atlantic 39.5 14.6 3.2 −23.3 −28.4 Red deer B5400 Bercy Metapodal QS, M XV,11 Late Atlantic 39.7 14.6 3.2 −21.6 −26.7 Red deer B5200 Bercy Radius QS, M XV,14 c2 Late Atlantic 40.9 15.0 3.2 −23.5 −28.6 Red deer B5100 Bercy Radius QS, M XV,20 c2n3 Late Atlantic 42.1 15.4 3.2 −22.3 −27.4 Red deer B5300 Bercy Humerus QS, M XV,20 c2n4 Late Atlantic 37.5 13.7 3.2 −22.5 −27.6 Red deer B4800 Bercy Tibia QS, M XV,14 c2n4 Late Atlantic 41.5 15.2 3.2 −21.4 −26.5 Red deer Lo3000 Louviers Left humerus A c18 24,84 Late Atlantic 44.2 15.1 3.4 −22.0 −27.1 Red deer Lo3100 Louviers Right radius A c18 24,83 Late Atlantic 44.7 15.5 3.4 −22.4 −27.5 Red deer Lo3200 Louviers Right radius A c18 24,82 Late Atlantic 44.5 15.4 3.4 −22.1 −27.2 Red deer Lo3300 Louviers Left humerus A c16 29,92 Late Atlantic 44.7 15.2 3.4 −22.2 −27.3 Red deer Lo3400 Louviers Right tibia A c16 34,80 Late Atlantic 44.1 14.8 3.5 −22.9 −28.0 Roe deer BRG700 Bois-Ragot (layer 6) Metatarsal BR 6 G4 559 Bölling 35.6 13.3 3.1 −20.2 −25.3 Roe deer BRG800 Bois-Ragot (layer 6) Femur BR 6 G4 508 Bölling 28.1 11.2 2.9 −20.9 −26.0 Roe deer BRG5000 Bois-Ragot (layer 4) Metatarsal BR 4 J2 173 Bölling 36.8 13.9 3.1 −20.4 −25.5 Roe deer BRG5100 Bois-Ragot (layer 4) Metatarsal BR 4 K5 79 Bölling 18.1 6.9 3.1 −19.0 −24.1 Roe deer BRG6300 Bois-Ragot (layer 3) Metacarpal BR 3 J5-110 Bölling 39.2 14.9 3.1 −20.5 −25.6 Roe deer BRG6400 Bois-Ragot (layer 3) Metacarpal BR 3 H1-26 Bölling 37.4 13.9 3.1 −20.9 −26.0 Roe deer NO2100 Noyen-sur-Seine (layer 9) Phalanx I 83 XVI E140 Boreal/Atlantic 42.0 15.5 3.2 −22.7 −27.8 Roe deer NO2200 Noyen-sur-Seine (layer 9) Phalanx I 83 XVI E140 Boreal/Atlantic 42.3 15.5 3.2 −22.4 −27.5 Roe deer NO2400 Noyen-sur-Seine (layer 9) Phalanx I 84 XVI Y151-36 Boreal/Atlantic 41.9 15.2 3.3 −23.1 −28.2 Roe deer NO5300 Noyen-sur-Seine (layer 9) Left femur 84 XV Z151-36 Boreal/Atlantic 41.6 15.1 3.2 −22.9 −28.0 Roe deer NO5400 Noyen-sur-Seine (layer 9) Left tibia 84 XVI G142-6 Boreal/Atlantic 42.2 15.5 3.2 −22.8 −27.9 Roe deer NO5600 Noyen-sur-Seine (layer 9) Phalanx I 84 XVI H132-38 Boreal/Atlantic 42.7 15.7 3.2 −23.2 −28.3 Roe deer NO5500 Noyen-sur-Seine (layer 9) Left tibia 84 XVI E141-2 Boreal/Atlantic 42.8 15.8 3.2 −23.8 −28.9 Roe deer CCF ch 1 Cuiry-les-Chaudardes n.g. n.g. Early Atlantic 39.6 14.4 3.2 −23.4 −28.5 Roe deer CCF ch 2 Cuiry-les-Chaudardes n.g. n.g. Early Atlantic 41.4 15.1 3.2 −23.7 −28.8 Roe deer CCF ch 3 Cuiry-les-Chaudardes n.g. n.g. Early Atlantic 39.8 14.6 3.2 −22.8 −27.9 Roe deer CCF ch 4 Cuiry-les-Chaudardes n.g. n.g. Early Atlantic 41.5 15.2 3.2 −24.5 −29.6 Roe deer CCF ch 5 Cuiry-les-Chaudardes n.g. n.g. Early Atlantic 40.4 14.7 3.2 −24.4 −29.5 Roe deer Lo4700 Louviers Skull c12 42,83 Late Atlantic 40.9 13.6 3.5 −23.9 −29.0 Roe deer B4200 Bercy Jawbone QS, N XIII,13 c,15 st,37 Late Atlantic 38.4 13.7 3.3 −22.3 −27.4 Roe deer B4300 Bercy Scapula QS, M XX,11 c,21 Late Atlantic 39.7 14.3 3.2 −22.2 −27.3 Roe deer B4400 Bercy Scapula QS, M XV,15 c,2n3 Late Atlantic 41.2 15.2 3.2 −23.2 −28.3 Roe deer B4500 Bercy Radius and ulna QS, M XV,14 Late Atlantic 41.1 15.1 3.2 −22.8 −27.9 Wild bovine BRG1400 Bois-Ragot (layer 6) Inf M3 BR 6 H4 242 Bölling 41.8 15.3 3.2 −19.5 −24.6 Wild bovine BRG3100 Bois-Ragot (layer 5) Humerus G BR 5 J4 819 Bölling 41.0 15.2 3.2 −19.5 −24.6 Wild bovine BRG3200 Bois-Ragot (layer 5) Humerus G BR 5 F2 147 Bölling 39.2 15.0 3.1 −19.9 −25.0 Wild bovine BRG3700 Bois-Ragot (layer 4) Radius D BR 4 I5 608 Bölling 39.0 14.8 3.1 −19.4 −24.5 Wild bovine BRG3800 Bois-Ragot (layer 4) Radius D BR 4 J4 706 Bölling 35.5 13.8 3.0 −19.8 −24.9
compared to those from
Barnett (1994)
for arctic tundra (
Fig. 6
).
Vascular plants do not exhibit signi
ficant differences in their δ
13C
values in closed canopy conditions (e.g.,
Gebauer and Meyer, 2003
). It
is therefore not surprising to
find no difference in the δ
13C values of
ruminants dwelling under closed canopy forest, even with different
dietary preferences. Only lichens exhibit systematically more positive
δ
13C values than coeval vascular plants (e.g.,
Fizet et al., 1995; Heaton,
1999; Jahren et al., 2003
). Indeed, reindeer, which consume high
amounts of lichen, had more positive
δ
13C values than coeval
ruminants, as illustrated by our results from central Saskatchewan
and by other works (e.g.,
Szepanski et al., 1999; Bocherens, 2000;
Ben-David et al., 2001; Urton and Hobson, 2005
). However, the
δ
13C values
of reindeer were signi
ficantly lower when they fed in a closed canopy
environment. Therefore, the contrast between open and closed
environment is clearly re
flected in the δ
13C values of ruminants,
independently of their forage preferences.
Our conclusions seem to contradict those presented by
Stevens
et al. (2006)
based on the carbon isotopic study of
five European
populations of red deer. In their study, the results did not show any
signi
ficant differences in δ
13C values although the studied populations
lived under different environmental conditions. Moreover, the
δ
13C
values obtained for red deer populations living in open environments
were claimed to be similar to those of the red deer from the closed
forest of Bialowieza. However, several problems with the study of
Stevens et al. (2006)
make its conclusions problematic. First, the
samples were collected between 1986 and 2002, but no correction for
the shift in the
δ
13C values of atmospheric CO
2
during this period was
performed. As illustrated by
Long et al. (2005)
, such corrections are
Species Lab n° Site Sample Excavation n° Chronozone Ccoll (%) Ncoll (%) C/Ncoll δ13 Ccoll (‰) δ13 Cdiet (‰) Wild bovine BRG3900 Bois-Ragot (layer 4) Phalanx I BR 4 J4 591 Bölling 34.9 13.3 3.1 −20.0 −25.1 Wild bovine BRG4000 Bois-Ragot (layer 4) Humerus BR 4 J3 565 Bölling 35.3 13.6 3.0 −19.1 −24.2 Wild bovine BRG4100 Bois-Ragot (layer 4) Humerus BR 4 J3 677 Bölling 35.5 13.5 3.1 −20.4 −25.5 Wild bovine NO1600 Noyen-sur-Seine (layer 9) Phalanx III 84 XVI C150-8 Boreal/Atlantic 41.4 14.8 3.3 −23.5 −28.6 Wild bovine NO1900 Noyen-sur-Seine (layer 9) Metapodal 84 XVI C149-6 Boreal/Atlantic 41.7 15.2 3.2 −23.4 −28.5 Wild bovine NO2000 Noyen-sur-Seine (layer 9) Metatarsal 84 XV TZ153-9 Boreal/Atlantic 41.5 15.1 3.2 −22.8 −27.9 Wild bovine NO5100 Noyen-sur-Seine (layer 9) Left metatarsal 84 XVI G144-4 Boreal/Atlantic 42.5 15.4 3.2 −22.9 −28.0 Wild bovine NO5200 Noyen-sur-Seine (layer 9) Left tibia 84 XVI B148-14 Boreal/Atlantic 41.7 15.2 3.2 −22.6 −27.7 Wild bovine CCF aur 1 Cuiry-les-Chaudardes n.g. n.g. Early Atlantic 32.0 11.6 3.2 −22.6 −27.7 Wild bovine CCF aur 2 Cuiry-les-Chaudardes n.g. n.g. Early Atlantic 31.1 11.4 3.2 −23.0 −28.1 Wild bovine CCF aur 3 Cuiry-les-Chaudardes n.g. n.g. Early Atlantic 28.1 10.3 3.2 −23.5 −28.6 Wild bovine CCF aur 4 Cuiry-les-Chaudardes n.g. n.g. Early Atlantic 37.0 13.6 3.2 −23.6 −28.7 Wild bovine CCF aur 5 Cuiry-les-Chaudardes n.g. n.g. Early Atlantic 42.5 15.6 3.2 −23.5 −28.6 Wild bovine CCF aur 6 Cuiry-les-Chaudardes n.g. n.g. Early Atlantic 41.1 15.1 3.2 −22.7 −27.8 Wild bovine MGA aur 1 Maizy n.g. n.g. Late Atlantic 40.3 14.8 3.2 −24.0 −29.1 Wild bovine MGA aur 2 Maizy n.g. n.g. Late Atlantic 42.4 15.5 3.2 −23.8 −28.9 Wild bovine MGA aur 3 Maizy n.g. n.g. Late Atlantic 36.9 13.6 3.2 −24.5 −29.6 Wild bovine B2001 Bercy Radius QS, L XV, 15 c21 Late Atlantic 38.3 12.9 3.5 −23.6 −28.7 Wild bovine B2201C Bercy Tibia QS, L XII,13 c21 Late Atlantic 43.0 15.4 3.3 −24.0 −29.1 Wild bovine B5500 Bercy Sacrum QS, M XV,8 c2n4 Late Atlantic 41.7 15.3 3.2 −23.4 −28.5 Wild bovine B5600C Bercy Metatarsal QS, L XV,24 c21 Late Atlantic 42.5 15.3 3.2 −23.4 −28.5 Wild bovine B6100C Bercy Humerus QS, L XV,12 c21 Late Atlantic 42.5 15.3 3.2 −23.7 −28.8 Wild bovine B6200C Bercy Radius and ulna QS, K XVIII,25 c21 Late Atlantic 43.5 15.7 3.2 −23.1 −28.2 Wild bovine Lo3600 Louviers Phalanx I A c18 34,80 Late Atlantic 44.2 15.3 3.4 −23.6 −28.7 Wild bovine Lo3700 Louviers Phalanx I A c18 48,81 Late Atlantic 43.8 15.1 3.4 −22.8 −27.9 Wild bovine Lo3900 Louviers Humerus A c18 53,80 Late Atlantic 43.8 15.0 3.4 −23.0 −28.1 Wild bovine Lo4000 Louviers Right metacarpal A c16 31,82 Late Atlantic 43.9 15.1 3.4 −22.7 −27.8 Cattle CCF303 Cuiry-les-Chaudardes n.g. n.g. Early Atlantic 41.8 15.2 3.2 −23.2 −28.3 Cattle CCF502 Cuiry-les-Chaudardes n.g. n.g. Early Atlantic 42.7 15.5 3.2 −23.5 −28.6 Cattle CCF803 Cuiry-les-Chaudardes n.g. n.g. Early Atlantic 42.6 15.7 3.2 −22.8 −27.9 Cattle CCF1302 Cuiry-les-Chaudardes n.g. n.g. Early Atlantic 42.2 15.4 3.2 −22.2 −27.3 Cattle CCF1403 Cuiry-les-Chaudardes n.g. n.g. Early Atlantic 41.0 14.9 3.2 −23.0 −28.1 Cattle CCF1503 Cuiry-les-Chaudardes n.g. n.g. Early Atlantic 41.5 15.1 3.2 −22.5 −27.6 Cattle CCF1603 Cuiry-les-Chaudardes n.g. n.g. Early Atlantic 40.1 14.8 3.2 −23.5 −28.6 Cattle CCF1701 Cuiry-les-Chaudardes n.g. n.g. Early Atlantic 40.6 14.9 3.2 −23.4 −28.5 Cattle MGA300 Maizy n.g. n.g. Late Atlantic 42.7 15.6 3.2 −22.3 −27.4 Cattle MGA500 Maizy n.g. n.g. Late Atlantic 40.9 15.1 3.2 −22.2 −27.3 Cattle MGA603 Maizy n.g. n.g. Late Atlantic 42.9 15.7 3.2 −21.9 −27.0 Cattle MGA703 Maizy n.g. n.g. Late Atlantic 30.2 10.8 3.3 −21.6 −26.7 Cattle B8600 Bercy Metapodal QS, M XV,10 c2n4 Late Atlantic 41.5 15.3 3.2 −21.6 −26.7 Cattle B8500 Bercy Tibia QS, M XV,14 c2n4 Late Atlantic 40.9 15.0 3.2 −22.7 −27.8 Cattle B7400 Bercy Radius QS, M XVI,22 c22 Late Atlantic 40.3 14.9 3.2 −21.3 −26.4 Cattle B7500 Bercy Radius QS, M XVI,22 c21 Late Atlantic 40.1 14.8 3.2 −21.9 −27.0 Cattle B8700 Bercy Metapodal QS, M XV,8 c2n4 Late Atlantic 41.8 15.4 3.2 −22.0 −27.1 Cattle B8800 Bercy Metapodal QS, M XV,18 c2n4 Late Atlantic 41.6 14.9 3.3 −21.8 −26.9 Cattle B8900 Bercy Tibia QS, M XVI,3 c1 Late Atlantic 41.6 14.8 3.3 −21.8 −26.9 Cattle Lo200 Louviers Right humerus A c12 29,85 Late Atlantic 44.5 15.2 3.4 −21.8 −26.9 Cattle Lo700 Louviers Left radius A c12 54,84 Late Atlantic 43.6 14.8 3.4 −22.5 −27.6 Cattle Lo1300 Louviers Left tibia A c12 35,81 Late Atlantic 45.2 15.1 3.5 −22.6 −27.7 Cattle Lo1400 Louviers Right radius A c12 30,83 Late Atlantic 46.2 15.8 3.4 −22.1 −27.2 Cattle Lo1600 Louviers Right radius A c18 57,79 Late Atlantic 43.0 14.9 3.4 −23.1 −28.2 Cattle Lo1700 Louviers Right radius A c18 22,77 Late Atlantic 44.5 14.9 3.5 −21.2 −26.3 Cattle Lo1900 Louviers Left radius A c18 62,77 Late Atlantic 44.5 14.8 3.5 −22.4 −27.5 Cattle Lo2000 Louviers Right tibia A c18 53,80 Late Atlantic 44.4 14.7 3.5 −21.8 −26.9 Cattle Lo2100 Louviers Right tibia A c18 42,77 Late Atlantic 44.5 15.2 3.4 −22.3 −27.4 Tissueδ13
Ccollvalues correspond toδ13C values measured on skeletal collagen;δ13Cdietvalues correspond to theδ13Ccollvalues−5.1‰. n.g. stands for not given.