HAL Id: hal-02324978
https://hal.archives-ouvertes.fr/hal-02324978
Submitted on 25 Oct 2019
HAL is a multi-disciplinary open access
archive for the deposit and dissemination of
sci-entific research documents, whether they are
pub-lished or not. The documents may come from
teaching and research institutions in France or
abroad, or from public or private research centers.
L’archive ouverte pluridisciplinaire HAL, est
destinée au dépôt et à la diffusion de documents
scientifiques de niveau recherche, publiés ou non,
émanant des établissements d’enseignement et de
recherche français ou étrangers, des laboratoires
publics ou privés.
Adaptation of the human visual system to the statistics
of letters and line configurations
Claire Chang, Christophe Pallier, Denise Wu, Kimihiro Nakamura, Antoinette
Jobert, W.-J. Kuo, Stanislas Dehaene
To cite this version:
Claire Chang, Christophe Pallier, Denise Wu, Kimihiro Nakamura, Antoinette Jobert, et al..
Adap-tation of the human visual system to the statistics of letters and line configurations. NeuroImage,
Elsevier, 2015, 120, pp.428-440. �10.1016/j.neuroimage.2015.07.028�. �hal-02324978�
Adaptation of the human visual system to the statistics of letters and
line con
figurations
Claire H.C. Chang
a,⁎
, Christophe Pallier
b,c,d,e, Denise H. Wu
f, Kimihiro Nakamura
b,c,e,g, Antoinette Jobert
b,c,e,
W.-J. Kuo
a, Stanislas Dehaene
b,c,e,ga
Institute of neuroscience, National Yang-Ming University, Taipei, Taiwan
b
Cognitive Neuroimaging Unit, INSERM, Gif-sur-Yvette, France
c
CEA, DSV, I2BM, NeuroSpin Center, Paris, France
dCentre National de la Recherche Scientifique, Paris, France eUniversity Paris-Sud, Paris, France
f
National Central University, Jhongli, Taiwan
g
Collège de France, Paris, France
a b s t r a c t
a r t i c l e i n f o
Article history: Received 5 May 2015 Accepted 8 July 2015 Available online 17 July 2015
Keywords: Environmental statistics Adaptation Visual recognition Reading Literacy fMRI
By adulthood, literate humans have been exposed to millions of visual scenes and pages of text. Does the human visual system become attuned to the statistics of its inputs? Using functional magnetic resonance imaging, we ex-amined whether the brain responses to line configurations are proportional to their natural-scene frequency. To further distinguish prior cortical competence from adaptation induced by learning to read, we manipulated whether the selected configurations formed letters and whether they were presented on the horizontal meridian, the familiar location where words usually appear, or on the vertical meridian. While no natural-scene frequency effect was observed, we observed letter-status and letter frequency effects on bilateral occipital activation, mainly for horizontal stimuli. Thefindings suggest a reorganization of the visual pathway resulting from reading acqui-sition under genetic and connectional constraints. Even early retinotopic areas showed a stronger response to letters than to rotated versions of the same shapes, suggesting an early visual tuning to large visual features such as letters.
© 2015 Elsevier Inc. All rights reserved.
Introduction
Many neuroscientists and theorists have proposed the idea that the visual system has internalized the statistical properties of the environ-ment (Berkes et al., 2011; Geisler, 2008; Girshick et al., 2011; Long and Purves, 2003; Shepard, 2002; Simoncelli and Olshausen, 2001). For example, environmental statistics have been proposed to be the basis of the Gestalt rules of proximity (Brunswik, 1956) and the princi-ple of good continuation (Gilbert et al., 2001b). The adaptation of the visual system to environmental regularities could occur both at the evo-lutionary scale (Shepard, 2002) and during ontogenetic development (Berkes et al., 2011; Blakemore and Cooper, 1970; Held and Hein, 1963). In the Bayesian perspective, environmental statistics get inter-nalized and later enter as a prior which is used to help disambiguate fu-ture inputs (Kersten et al., 2004; Knill and Pouget, 2004). Classical visual illusions such as the horizontal-vertical illusion (greater apparent size of a vertical bar compared to a horizontal bar) may be explained by scene statistics (Howe and Purves, 2002). This and other illusions may be
accounted for by supposing that early visual neuronal circuits are mod-ified by experience, such that greater populations of cells are assigned to more frequent features of the environment (Girshick et al., 2011) and that their horizontal connections internalize the statistics of feature co-occurrence (Hess et al., 2003).
In the present study, we examined whether the frequency distribu-tion of line configurations in the environment is reflected in the human visual system.Changizi et al. (2006)discovered an interesting statistical regularity in the frequency with which the topological configurations formed by image contours, such as T, L, or X configurations, occur in the visual environment. They counted the frequency of each topological configuration of two or three contour lines in pictures of the natural or artificial human environment, and observed a systematic ordering (Fig. 1a). For instance, amongst the two-line configurations, the “L” con-figuration was always more frequent than “T”, which in turn was more frequent than“X”. Crucially, this is not the case in simple random ar-rangements of lines. Furthermore, human visual signs, as taken from al-phabets, logographic writing systems and other symbol systems, followed the same statistical distribution, such that the frequency ranks of the configurations in these two domains were positively corre-lated (Fig. 1a). In other words, the frequency distribution of line con fig-urations in human cultural signs mimicked that found in natural scenes. ⁎ Corresponding author at: Room 812, 8F, Library, Information, and Research Building,
National Yang-Ming University, No. 155, Sec. 2, Linong Street, Taipei, 112 Taiwan ROC. E-mail address:hcchang73@gmail.com(C.H.C. Chang).
http://dx.doi.org/10.1016/j.neuroimage.2015.07.028
1053-8119/© 2015 Elsevier Inc. All rights reserved.
Contents lists available atScienceDirect
NeuroImage
Such a strong link between environmental statistics and cultural inven-tions is in agreement with the "neuronal recycling hypothesis" whereby novel cultural acquisition such as writing maps onto pre-existing corti-cal systems, thus constraining the range of cross-cultural variations (Dehaene and Cohen, 2011). According to this hypothesis,Changizi et al.’s (2006)finding implies that configurations that are frequently ob-served in the natural environment are more likely to be selected as visu-al signs, because they are better encoded in the visuvisu-al system (Dehaene, 2009).
The above argument is based solely on statistical evidence, and lacks direct evidence that line configuration statistics are encoded in the visu-al system. Neurophysiologicvisu-al evidence does suggest that neurons in the primate infero-temporal cortex can be sensitive to specific line configu-rations that form non-accidental topological properties (Brincat and Connor, 2004, 2006; Tanaka, 2003). However, these studies have not yet investigated whether the cortical representation of these features mimics their distribution in natural scenes. Here, we used fMRI in humans to investigate this issue. Our hypothesis was that visual activa-tion in response to line configurations should be directly proportional to their natural-scene frequency.
Where in the visual pathway might this effect occur? A prediction for the locus of the natural-scene frequency effect could be made based on hierarchical models of visual recognition (Dehaene et al., 2005; DiCarlo et al., 2012; Rolls and Stringer, 2006; Serre et al., 2007; Ullman, 2007). All of these models assume that the ventral occipito-temporal pathway comprises a hierarchy of neural detectors with progressively larger receptivefields, each tuned to increasingly complex and abstract combinations of visual features. In humans, the Local Com-bination Detectors model (Dehaene et al., 2005) assumes that written word recognition rests on a reorientation of this architecture towards the detection of letters and their combinations. Based on several prior fMRI experiments (Dehaene et al., 2004; Vinckier et al., 2007), the model proposes specific cortical areas for each step: line configurations and letter fragments in area V2 and V4, abstract letter identities and their combinations in the more anterior visual word form area (VWFA) (Cohen et al., 2002). Under the neuronal recycling hypothesis, even prior to reading acquisition, these areas may already exhibit a bias for recognizing line configurations, which would make it particularly suit-able for recognition of written words (Dehaene et al., 2005; Dehaene, 2009; Szwed et al., 2011).
In addition to V2, V4 and VWFA, one should also consider the possi-bility that the primary visual cortex itself may exhibit sensitivity, not
only to elementary contours, but also to their frequent combinations. Recent electrophysiological (McManus et al., 2011) and imaging (Sigman et al., 2005) studies have revealed that training in shape detec-tion changes cortical responses even in the calcarine cortex, indicating that experience could induce a sensitivity to complex visual features in early retinotopic areas V1 and/or V2. fMRI studies of reading indicate that even area V1 is more activated by letter strings than by scrambled stimuli with matched visual features (Szwed et al., 2011, 2014). Indeed, the calcarine cortex, at the location of area V1, shows a stronger response to horizontal checkerboards in literate, who used to read horizontally, than in illiterate subjects (Dehaene et al., 2010). Those findings suggest that reading acquisition may lead to perceptual learn-ing for frequent letter shapes in area as early as V1. In this case, an effect of the natural-scene frequencies of line configurations might also be observed in early retinotopic cortex.
In summary, we aim to test whether the frequency distribution of simple line configurations in natural scenes is reflected in the visual cortex. In Experiment 1, we study the fMRI responses to the line con fig-urations studied byChangizi et al. (2006). Given that the most frequent configurations in natural scenes are also those most frequently used in human writing systems, the existence of such effect may support the view that human writing systems have evolved from prior cortical com-petence. Furthermore, in literate adults, the adaptation to environmen-tal statistics includes a novel cultural environment: written texts. Thus, one might expect the processing of simple line configurations to also be under the influence of reading experience, a prediction which is further investigated in Experiment 2.
Experiment 1
In Experiment 1, we collected fMRI data in 18 subjects while they simply viewed arrays comprising 15 different types of line con figura-tions, selected to span a broad range of natural-scene frequencies, as computed byChangizi et al. (2006)(Fig. 1). We used a correlation approach to probe the whole brain for activations correlated with the logarithm of natural scene frequencies.
Methods Participants
Eighteen right-handed (9 female), 18–30 year-old native French speakers, participated in the present fMRI experiment. They had no Fig. 1. Stimulus design for Experiment 1. A: Correlation between the frequency of simple line configurations in natural scenes and in writing systems (redraw fromChangizi et al., 2006). The x and y axes indicate the rank of each configuration according to the corresponding frequency. Configurations drawn in dark gray have the lowest ranking in both domains and their coordinates were shifted slightly to allow the display of the whole configurations. B: Examples of stimuli used in fMRI. 15 line configuration types were selected. 20 stimuli of the same type (flashed for 200 ms, separated by 200 ms blanks) were presented in short blocks of 8 seconds, separated by 6–8 s resting periods. The subject’s task was to respond to the single-line con-figuration (top left) which appeared occasionally inside the blocks.
history of neurological or psychiatric disease, and had normal or corrected-to-normal vision. Written informed consents were given. The project was approved by the local ethics committee.
Stimuli
Fifteen configurations were selected from the paper byChangizi et al. (2006), which provides the frequencies of line configurations in pictures of the human environment (landscapes, cities, etc.). In this study, we use as a short-hand the expression‘natural-scene frequency’ to refer to the logarithm of the average frequencies of line con figura-tions in such pictures.
For each type of line configuration, we used a matlab program to generate 10 images, each comprising 35 randomly oriented items of the same type (Fig. 1b). The item width was 0.83-1.22 degrees of visual angle. The images were 18.9 by 18.9 degrees of visual angle. Total contour length and number of“on” pixels were matched (the standard deviation of the numbers of“on” pixels was less than 0.1% across all conditions).
Design and procedure
Each participant took part in six fMRI runs. The total scanning time was around 42 minutes. Each run lasted about 7 minutes and contained 30 mini-blocks of 8 s separated by rest periods of 4–8 s. Each mini-block comprised 20 images of the same type of line configuration, each of which was presented for 200 ms after afixation interval of 200 ms. Each run comprised two mini-blocks of each of the 15 distinct types of line configuration. The 30 blocks were ordered randomly. To maintain the participants’ attention on the visual stimuli with a minimally de-manding task, participants were required to monitor the stimulus stream for the presence of a target probe consisting of a picture with single-line bars, also displayed for 200 ms. The target appeared in half of the mini-blocks, and participants were instructed to press a button as fast as possible upon seeing it. Blocks with a target were randomly chosen. The target always occurred in the middle of blocks (replacing one of the images 6–12 within the block of 20 images). In an effort to maintain attention throughout each 8-second block, subjects were not told that blocks could only contain at most one target.
MRI acquisition
The acquisition was performed with a 3-Tesla Siemens Tim Trio system. One anatomical image (voxel = 1x1x1.1 mm) and a total of 1092 functional images were acquired using an Echo-Planar sequence sensitized to the BOLD effect (TR = 2.4 secs, TE = 30 msecs, Matrix = 64x64; Voxel size = 3x3x3 mm; 40 slices in ascending order). Data analysis
Data processing was performed with SPM8 (Wellcome Department of Cognitive Neurology, software available athttp://www.fil.ion.ucl.ac. uk/spm). The anatomical scan was spatially normalized to the avg152 T1-weighted brain template defined by the Montreal Neurological Institute using the default parameters (nonlinear transformation). Functional volumes were realigned to correct for movements, spatially normalized using the parameters obtained from the normalization of the anatomy, and smoothed with an isotropic Gaussian kernel (FWHM = 5 mm).
In afirst SPM model, experimental effects at each voxel were esti-mated using a multi-run design matrix modeling the 15 configurations, the probe trials, and the 6 movement parameters computed at the re-alignment stage. Each block was modeled as an epoch lasting 8 seconds, and each probe trial as a punctual event. The regressors were created by convolving these epochs by the standard SPM hemodynamic response function. Contrasts averaging the regression weights associated with each configuration were computed.
These estimates of individual effect sizes were entered in a second-level analysis with one regressor for each configuration and each partic-ipant (one-way within-subject ANOVA model). To search for regions
showing an effect of natural-scene frequency, we used a contrast with weights proportional to log natural-scene frequency, testing for increas-ing activation across the configurations in the ANOVA model. We also tested second-level regression models pitting two variables against each other, as described further below. Unless otherwise stated, statis-tics were thresholded at voxel wise pb 0.001 (uncorrected), with an additional correction for multiple comparisons across the whole-brain volume based on cluster extent (pb 0.05, FDR corrected). Regions showing significant effects were labeled with an automated anatomical labeling system (AAL;Tzourio-Mazoyer et al., 2002).
Results
Behavioral results
Reaction times (RT) outside the range of individual mean ± 3 sd were excluded. Across participants, the mean RT was 445 ms (SE = 13 ms, range = 348–633 ms), and the mean accuracy was 97 % (SE = 1 %, range = 82–100%). The RTs and accuracies of each configu-ration were listed inAppendix Table 1. Repeated one-way ANOVAs re-vealed small but significant differences between configurations in RT (F (14, 238) = 2.73; pb .01) and accuracies (F(14, 238) = 2.15; pb .05). However, natural-scene frequency was not significantly corre-lated with either RT (r = 0.32, p = .24) or accuracy (r =−0.24, p = .39). The behavioral results confirmed that the participants maintained their attention on the visual presentation.
Imaging results
Whole-brain analysis revealed a bilateral occipital cluster with a sig-nificant positive correlation indicating increasingly stronger activation for configurations with increasingly higher natural-scene frequency in early retinotopic areas (Fig. 2andTable 1).
The scatter plots inFig. 2illustrate how occipital activation varies across the 15 line configurations. Although there is a clear trend as a function of natural-scene frequency, some dispersion in activation is ap-parent. Furthermore, one may observe that configurations correspond-ing to letters (shown in red), which are all of high natural-scene frequency, yield stronger activations than other configurations with nearly-equivalent frequency. To formally assess the effect of letter status, we created a multiple regression model with one regressor per participant and two regressors of interest: natural-scene frequency and letter versus non-letter status (X, T, L, H, Y and F configurations were counted as letters, although note that they often appeared as rotated in the display; this factor will be controlled in Experiment 2). In this model, the effect of natural-scene frequency ceased to reach significance anywhere in the brain, and instead there was a significant effect of letter status in bilateral occipital cortex, including bilateral V1, V2, and left V3 (Fig. 3andTable 2). We also tested the natural-scene fre-quency effect within only the non-letters, again without any significant results. Thus, the results suggest that letter status, rather than frequency, drives occipital fMRI activation in educated human adults.
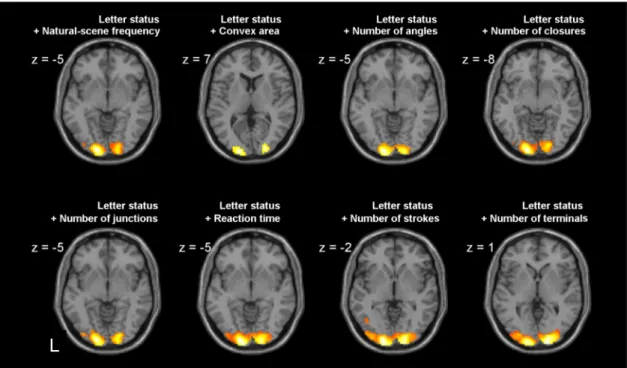
In an effort to confirm this conclusion while controlling for other vi-sual variables that may be confounded with letter/non-letter status and/ or natural-scene frequency, we measured several parameters of the dis-plays: convex area (the surface of the smallest convex polygon that con-tains a single line configuration item), number of line junctions, number of strokes (2 or 3), number of angles, and number of terminals (ending points of a line). The values of the variables for each configuration type are provided inAppendix Table 1. We also added as a potential con-found the average response time for target detection in the correspond-ing block. We created several regression models in which each of these variables was pitted against natural-scene frequency, and observed that in the models including letter status or convex area, the variable 'natu-ral-scene frequency’ no longer yielded a significant effect. In a model with letter status and convex area, we only found higher occipital acti-vation for letters than non-letters (Fig. 3). We further tested this letter status effect in models systematically including letter status and one
of the other variables as regressors of interest. Letter status always sur-vived as the dominant determinant of occipital activation (Fig. 4).
We also tested for a reversed letter-status effect, namely, larger acti-vations for non-letters than letters, as well as the negative correlation between brain activations and natural-scene frequency. No such effects were found in either the ANOVA model or the regression model includ-ing letter status and natural-scene frequency.
Discussion
In Experiment 1, we tested the hypothesis that the natural-scene fre-quencies of line configurations are reflected in the human visual system. As predicted, a positive correlation between natural-scene frequency and brain activation was found only in bilateral occipital visual areas, at an anatomical location corresponding to area V1/V2 and a small part of left V3. However, we also found that this effect could be driven by a partially confounded variable, namely, whether or not a given line configuration forms a letter of the Roman alphabet. As observed byChangizi et al. (2006), in all cultures, the shapes that are used as letters tend to be of high natural-scene frequency. Nevertheless, our stimulus set included some non-letter line configurations with a natural-scene frequency nearly as high as that of the letters. Multiple regression analyses suggested that letter status, not natural-scene fre-quency, was responsible for the changes in occipital activation.
Such an effect of letter status is compatible with prior observations that early visual cortex is modified by literacy acquisition (Dehaene et al., 2010) and becomes sensitive to letters strings more than to other stimuli of matched complexity (Szwed et al., 2011, 2014). Note that this effect is not incompatible with the general hypothesis that the visual system internalizes the statistics of environmental inputs. It should be acknowledged that, for highly literate subjects, the environ-ment most likely includes a high proportion of text, which may there-fore bias the statistics away from those of natural scenes and towards those of the subject’s writing system.
Experiment 1, however, was not specifically designed to test for a let-ter effect, but solely to investigate the effect of natural-scene frequency, and the letter effect was only seen in a post-hoc analysis. In Experiment
2, we therefore aimed to provide a replication in which the effects of natural-scene frequency and letter status were manipulated indepen-dently. To this aim, we capitalized on the fact that, in written texts, letters appear at a specific angle. Beyond about 45 degrees of rotations, the recognition of letters and words becomes severely degraded, accom-panied by a sudden onset of parietal lobe activations suggesting serial Fig. 2. Brain regions showing a significant increase in activation with natural-scene frequency (N = 18, thresholded at T N 3.12, voxelwise p b .001, uncorrected; clusterwise p b 0.05, FDR corrected). The scatterplots show the average fMRI activation for all 15 configurations in left and right occipital peaks. Error bars represent 1 standard error across participants after sub-traction of each participant’s individual mean. Letter-like configurations are displayed in red.
Table 1
Brain regions showing natural-scene frequency effect in Experiment 1.
Cluster Size T X Y Z
659 Occipital Calcarine R 6.32 15 −101 0 Cuneus R 6.06 18 −97 7 Inf. L 5.75 −12 100 −8
L
Fig. 3. Disappearance of the effect of natural-scene frequency once other variables are con-sidered. The results of two regression models are shown, each containing two regressors of interest: the line configuration frequency in natural scenes and either the letter status (whether the configuration forms a letter of the Roman alphabet or not) or the convex area (estimating the surface occupied by an individual line configuration item in the dis-play). Images are SPMt maps (N = 18, thresholded at TN 3.12, voxelwise p b .001, uncor-rected; clusterwise pb 0.05, FDR corrected).
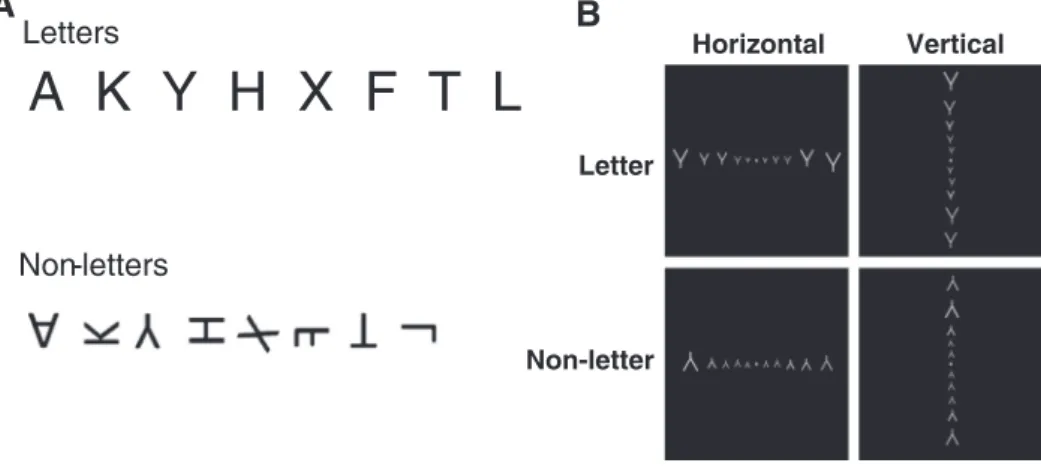
effortful deciphering (Cohen et al., 2008). In Experiment 2, we therefore presented the very same topological line configuration at two different angles, only one of which corresponded to a letter. We selected 8 letters (AKYHXFTL) and created afixed set of 8 corresponding non-letter stim-uli by rotation or symmetry (Fig. 5). Although the range of variation in natural-scene frequency was smaller than that in Experiment 1, the 8 configurations still spanned more than two orders of magnitude in the Changizi et al. scale (Appendix Table 2), thus achieving an orthogonal design with independent factors of letter status and natural-scene frequency.
Experiment 2 also included another manipulation of the retinotopic location of the items. In Experiment 1, we attempted to maximize the effect by covering the available visualfield with many items. In Experi-ment 2, the stimuli were presented in a more restricted part of the visual field, either along the horizontal or the vertical meridian (Fig. 5). Be-cause the Roman alphabetic system is based on horizontal lines read from left to right, expert readers get considerably more training in letter decoding along the horizontal meridian. Although a page of text mayfill a large part of the visualfield, the reader’s attention is typically focused on the letters left and right offixation, and this is likely to have a deter-minant effect on the acquisition of visual expertise. Indeed, behavioral and brain-imaging evidence suggests an enhanced representation of stimuli presented at or near the horizontal meridian in expert readers (Dehaene et al., 2010; Nazir et al., 2004). Accordingly, one may predict a larger effect of letter status in retinotopic cortical regions coding for the horizontal meridian, than in those coding for the vertical meridian.
Conversely, one may hope to find a purer effect of natural-scene frequency, less strongly affected by reading experience, for stimuli presented along the vertical meridian.
Experiment 2 Methods Participants
After exclusion of one subject (see below), 18 right-handed, 18–30 year-old native French speakers (10 female, 8 male) were retained in this fMRI experiment. They had no history of neurological or psychiatric disease and normal or corrected to normal vision. Written informed consents were given. The project was approved by the local ethics committee.
Stimuli
Eight letters were selected: AKYHXFTL. We wrote a matlab program to display them in simple line form. For each letter, we selected a trans-formation (flipping and/or rotation ranging from 55 to 180 degrees) to create a corresponding non-letter. We endeavored to match letters and non-letters for the number of vertical and horizontal lines, with the single exception of configuration “X”. This was done to avoid a confound between letter/non-letter status and line orientation, since it is known that cells whose receptivefields fall near the vertical and horizontal me-ridians exhibit a preference for vertical and horizontal lines, respectively (Furmanski and Engel, 2000).
Pictures corresponding to thirty-two conditions (8 configurations x 2 letter status x 2 presentation orientation) were created (Fig. 5). Each picture contained 10 items of the same line configuration, either horizontally or vertically aligned, with a small spatial jitter (Fig. 5). The size of each item was proportional to the distance fromfixation, in order to compensate for the increase in receptivefield size and the corresponding loss in spatial resolution. The formula we used for item size (item size in degrees = 0.15 x distance from thefixation in degrees + 0.48) was derived fromHarvey and Dumoulin (2011). The pictures were 19.7 by 19.7 degrees of visual angle.
Table 2
Brain regions showing letter status effect in Experiment 1.
Cluster Size T X Y Z 531 Occipital Mid. L 9.11 −18 −94 −5 Mid. L 5.04 −27 −85 10 Mid. L 4.80 −39 −91 4 513 Occipital Mid. R 8.45 24 −91 7 Calcrine R 8.05 18 −100 1 Lingual R 4.58 6 −85 −11
L
Fig. 4. Occipital activation is primarily determined by letter status, even when other confounded variables are taken into account. Each image is a SPMt map from a regression model with two regressors: letter status and one of the other variables (N = 18, thresholded at TN 3.12, voxelwise p b .001, uncorrected; clusterwise p b 0.05, FDR corrected).
Design and procedure
The procedure was similar to Experiment 1, except the number of blocks (32) and the task. In order to better equate task difficulty across the different line configurations, the bar detection task used in Experi-ment 1 was replaced by a color detection task: we asked the participant to press a button whenever they detected a colored item in the pictures. The colored probe appeared 40 times in a pseudo-randomized order, so that the probe never occurred as thefirst or last trial in a block, and that any two probes were separated by at least three trials.
MRI acquisition
The acquisition was performed with a 3 Tesla Siemens Tim Trio sys-tem. One anatomical image (voxel = 1×1×1.1 mm) and a total of 1890 functional images were acquired using a multiband sequence developed by the Center for Magnetic Resonance Research (CMRR) (Feinberg et al., 2010; Moeller et al., 2010; Xu et al., 2013) and sensitized to the BOLD effect (TR = 1.5 secs, TE = 32 msecs, Matrix = 128 × 128; Voxel size = 1.5 × 1.5 × 1.5 mm; 54 axial slices covering the occipital and most inferior part of the temporal lobe).
MRI analyses
The data was preprocessed with the same procedure as in Experi-ment 1. In thefirst level SPM models, experimental effects at each voxel were estimated using a multi-run design matrix modeling the eight configurations, targets in the four position (right, left, upper, lower), and the six movement parameters. Each block was modeled as an epoch lasting 8 seconds, and each probe trial as event with zero duration. The regressors were created by convolving these epochs by the standard SPM hemodynamic response function. Contrasts averaging the regression weights associated with each configuration were computed.
These estimates of the individual effect sizes were entered in a second-level analysis with one regressor for each configuration, as well as each participant. The analysis was done within a mask including the occipital regions, lingual gyrus, and fusiform gyrus from the Wake Forest University (WFU) PickAtlas (Maldjian et al., 2003). Specific re-gions of interest (ROIs) described in the next paragraph were also in-cluded. For the voxel-based analysis, the activations were thresholded at pb .005 and corrected at cluster level FDR p b 0.05.
ROI analyses
To perform the analysis of regions of interest (ROIs), masks of left and right V1/V2, V3/V4, and V5 based on a cytoarchitectonic maximum probability map (Eickhoff, et al., 2005) were generated using SPM
Anatomy Toolbox version 1.8 (http://www.fz-juelich.de/inm/inm-1/ spm_anatomy_toolbox). Masks of left and right FG1 and FG2 as de-scribed inCaspers et al. (2013)were used. The mask of VWFA was a 10 mm sphere around the classical coordinates (MNI [−42, −57, −12]) (Cohen et al., 2002). Weflipped the mask of VWFA to get its counter-part in right hemisphere (rVWFA). The masks of lateral occipi-tal areas (LO) were based on the centroids of LO1 and LO2 provided by Larson and Heeger (Larsson and Heeger, 2006) and generated with Marsbar (Brett et al., 2002).
For the early retinotopic areas (V1/V2 and V3/V4), we localized regions corresponding to the horizontal and vertical meridians by asking the participants to go through a localizer run after the main experiment. The localizer run included 25 blocks offlashing horizon-tal checkerboard and 25 blocks offlashing vertical checkerboard. Within each hemisphere, ROIs more sensitive to stimuli along the horizontal meridian (H meridian) in V1/V2 and V3/V4 were deter-mined by selecting the 30 voxels most responsive to horizontal than to vertical checkerboards. These subject-specific ROIs were then used to extract response to horizontally presented stimuli. Con-versely, ROIs more sensitive to stimuli along the vertical meridian (V meridian) were determined by selecting the 30 most active voxels showing the opposite pattern. These subject-specific ROIs were then used to extract responses to the vertically presented stimuli. For higher visual regions,fixed subject-independent masks were used, because in those regions the meridian localizer no longer pro-vided systematic distinctions of horizontal and vertical meridians within each subject, consistent with previous publications on retinotopy (Engel et al., 1997; Wotawa et al., 2005).
To test the effect of letter status in the ROI analysis, a paired T-test was applied to each ROI under the horizontal and vertical presentation conditions. To test the frequency effect and the interaction between let-ter status and the other factors, we used a mixed model with partici-pants as random effects and letter status, orientation of presentation, natural-scene frequency, and letter frequency asfixed effects.
Results Behavioral result
Across participants, the mean accuracy of the colored item detection task was 98 % (SE = 0.7 %, range = 88-100%) and the mean RT was 468 ms (SE = 9.17 ms, range = 367–535 ms). The participant with the lowest accuracy (85 %) also yielded the longest RT (624 ms). Consid-ering the difference in performance between this participant and the group average, this participant was excluded from further analysis.
Horizontal
Vertical
Letter
Non-letter
B
A
Letters
Non-letters
A K Y H X F T L
Fig. 5. Stimulus design for Experiment 2. The experiment was designed to test the hypothesis that early visual cortices would be especially responsive to letters presented in their normal orientation and at the usual horizontal location. A: Eight line configurations corresponding to letter shapes were selected and were presented either in normal upright form (letter con-dition), or in an unusual rotated form (non-letter condition). B: Sample displays illustrating the 2 x 2 factorial design manipulating letter status (letter vs non-letter) and orientation of presentation (identical configurations were presented along the vertical or the horizontal meridian).
Imaging results
Letter status effect. In the early retinotopic areas, ROI analysis revealed larger activation for letters than non-letters only in the horizontal pre-sentation condition and only in the left V1/V2 area (t(17) = 2.7, p = .016). In this region, letters induced 8% more activation than non-letters (Fig. 6a).
The corresponding whole-brain SPM analysis revealed an interac-tion between letter status and orientainterac-tion, namely, larger activainterac-tion for letters than non-letters when presented in the horizontal meridian than in the vertical meridian, at an occipital site corresponding to left V1/V2 (94% of the whole volume of the cluster)(Fig. 6b andTable 3).
In the higher visual cortex, the ROI analysis revealed larger activa-tion for non-letters in all ROIs except the left FG1 and FG2 (Fig. 7a). This effect was found only for horizontal presented stimuli in left V5
(t(17) =−3.0, p = .008), LO1 (t(17) = −2.8, p = .014), LO2 (t(17) =−3.3, p = .004), VWFA (t(17) = −2.1 p = .046), right V5 (t(17) = −2.5, p = .023), LO1 (t(17) = −3.5, p = .002), LO2 (t(17) =−4.1, p = .0007), FG1 (t(17) = −3.3, p = .003), FG2 (t(17) =−2.9, p = .011), and rVWFA (t(17) = −2.6, p = .018). Larger activation for letters than non-letters was found only in right V5 (t(17) = 2.1, p = .047) for vertically presented stimuli.
A significant Interaction between orientation and letter status was found in the left V5 (t(547) =−2.5, p = .01),VWFA (t(547) = −2.2, p = .03), right V5 (t(547) =−2.7, p = .007), LO2 (t(547) = −2.6, p = .009), FG1 (t(547) =−3.0, p = .003), FG2 (t(547) = −2.6, p = .01), and rVWFA (t(547) =−3.0, p = .005).
Consistent with the ROI analyses, results of whole-brain SPM analy-ses also revealed larger activation for non-letters than letters (Table 3, non-letters vs. letters) and an interaction between letter status and
B
A
Horizontal(Letters - Non-letters)
>
Vertical(Letters - Non-letters)
L
Fig. 6. fMRI responses to letter and non-letter stimuli in early retinotopic areas. A: ROI analysis within anatomically-defined probabilistic maps for V1/V2 and for V3/V4, subject-specific voxels were selected based on their stronger responses to horizontal than to vertical checkerboards (H) or vice-versa (V) in the localizer run. The graphs show the average response of these voxels to letter and non-letter stimuli presented in the same orientation (H or V) in the independent line configuration runs (* indicates significance difference between letters and non-letters, pb .05). B: Whole-brain search for the predicted interaction between letter status and presentation orientation. SPMt map for a greater difference between letters and non-letters for horizontal than for vertical stimuli (N = 18, thresholded at TN 3.12, voxelwise p b .005, uncorrected; clusterwise p b 0.05, FDR corrected).
orientation in higher visual cortex (Table 3, horizontal(non-letters vs. letters) N vertical(non-letters vs. letters)). This interaction again showed that the increased activations to non-letters than letters were mainly found with the horizontal stimuli.
Natural-scene frequency and letter frequency effects. The fact that we failed to observed increasing brain activation for configurations with in-creasingly higher natural-scene frequency, either in SPM analyses or in ROI analyses, could result from the fact that after learning to read, the vi-sual system is more sensitive to the frequencies of line configurations in texts rather than in the natural environment. To further test this idea, we examined the effect of the logarithm of letter frequency. Letter fre-quency was extracted from French texts, the subject’s native language, and was weighted by the frequencies of the carrier words, regardless of case, as provided bywww.LEXIQUE.org(New et al., 2001). Note that the correlation coefficient between natural-scene frequency and French letter frequency was positive but non-significant (r = 0.52, p = .26).
When we included letter status, orientation, natural-scene frequen-cy, and letter frequency in the model for the ROI analysis, a three-way interaction among letter status, orientation, and letter frequency was observed in higher visual cortical areas including left LO1 (t(547) = 2.1, p = .03), LO2 (t(547) = 2.4, p = .02), FG2 (t(547) = 2.3, p = .02), VWFA (t(547) = 2.6, p = .008), right LO1 (t(547) = 2.7, p = .008), LO2 (t(547) = 2.6, p = .01), FG2 (t(547) = 2.7, p = .007), and rVWFA (t(547) = 2.7, p = .006). The profile of this triple-interaction was consistent with an increase in activation with letter frequency, but only for letters and only in the horizontal position (seeFig. 7b). It also showed that non-letters only had larger activations compared to letters with low letter frequencies, but did not differ from high-letter-frequency ones. There was no effect in early retinotopic areas.
We further examined the letter frequency effect separately for hori-zontally presented letters, horihori-zontally presented non-letters, vertically presented letters, and vertically presented non-letters. Significant letter frequency effects were only found in horizontal meridian. For letters, configurations with higher letter frequency elicited larger activation,
while non-letters showed the opposite pattern. The regions showing a positive correlation between letter frequency and brain activation for horizontally presented letters were left LO2 (t(125) = 3.04, p = .003), left FG1 (t(125) = 3.04, p = .003, left FG2 (t(125) = 3.13, p = .002), VWFA (t(125) = 3.50, p = .0006), right V5 (t(125) = 3.18, p = .002, right LO1 (t(125) = 3.50, p = .0006), right LO2 (t(125) = 2.87, p = .005), right FG1 (t(125) = 2.44, p = .02, right FG2 (t(125) = 3.47, p = .0007), and rVWFA (t(125) = 3.80, p = .0002). The regions showing neg-ative correlation between letter frequency and brain activation for hori-zontally presented non-letters were left LO1 (t(125) =−2.45, p = .02), right LO1 (t(125) =−2.36, p = .02), right LO2 (t(125) = −2.37, p = .02), rVWFA (t(125) =−2.00, p = .05).
Consistent with the ROI analyses, voxel-based SPM analyses also showed an interaction between letter frequency and orientation, as well as a three-way interaction among letter frequency, letter status, and presentation orientation (Table 3).
Negative effect of natural-scene frequency and the role of junction number. As reported above, we did not observe any positive correlations between brain activations and natural-scene frequency. Although a negative corre-lation was found in the voxel-based analysis in bilateral ventral occipito-temporal cortex and in the ROI analysis in right LO2 (t(547) =−2.3, p = .02; t(547) = 2.3, p = .03), given the small number of items used, it could be due to confounded factors. One such confound could be the number of line junctions: the correlation coefficient between natural-scene frequen-cy and number of junctions was -.62 (p = 0.10) (Appendix Table 2). In-deed, increased activation for configurations with more junctions was observed in the same regions, at a site plausibly corresponding with area V4 (V4 covered 61% and 30% of the volume of the cluster in right and left hemisphere respectively) (Fig. 8andTable 3), and in a model where both variables were included, the negative correlation between natural-scene frequency and brain activation was no longer significant, while the number of junctions effect remained. We therefore went back to Experiment 1 and tested the number of junction effect. The same re-gions showing an effect of the number of junctions in Experiment 2 were also detected in Experiment 1 at a lower uncorrected threshold (pb .005 voxelwise, uncorrected) (Fig. 8). We therefore conclude that the number of junctions drove this effect. Indeed, thefinding of a bilateral ventral occipito-temporal effect of the presence of line junctions is con-gruent with priorfindings bySzwed et al. (2011).
Discussion
In Experiment 1, we tested the hypothesis that the natural-scene fre-quency distribution of configurations is reflected in the human visual system. We found a positive effect, with bilateral occipital activations increasing with the frequencies of line configurations, but we also found that this effect was most likely due to the fact that many frequent configurations also depicted letters of the alphabet, and that the frequency effect disappeared once letter status was controlled for. In Ex-periment 2, we manipulated independently the effects of natural-scene frequency and letter status. As in Experiment 1, in early retinotopic areas, letters elicited more activation than non-letters. This effect was reversed in the higher visual cortex. Furthermore, no positive natural-scene frequency effect was found. Instead, a letter frequency effect was observed in the higher visual cortex. For letters, letter frequency was positively correlated with brain activations, while for non-letters, a tendency for a negative correlation between letter frequency and brain activations was found. Experiment 2 also included a novel factor, the orientation of presentation of the stimuli, which were arrayed along either the horizontal or the vertical meridian. We predicted that letter status effect would be stronger in brain regions corresponding to the horizontal meridian, which is the location where letter strings are usually presented during reading Indeed, both the letter status effect and the interaction between letter status and letter frequency were mainly found in regions corresponding to the horizontal meridian. Table 3
Brain regions showing significant effects of letter status, orientation, natural-scene frequency, letter frequency, or the interactions between them in Experiment 2.
Cluster Size T X Y Z
horizontal(letters vs. non-letters)N vertical(letters vs. non-letters)
543 Occipital Calcrine L 4.10 −9 −93 −8 Lingual L 3.54 −9 −90 −16 Mid. L 3.48 −15 −99 10 non-letters vs. letters 952 Occipital Mid. L 4.29 −33 −85 3 Inf. L 3.55 −47 −81 −8 horizontal(non-letters vs. letters)N vertical(non-letters vs. letters)
577 Occipital Mid. R 3.96 42 −82 1 Inf. R 3.27 35 −82 −5 Temporal Mid. R 3.48 51 −69 −2 horizontal(letter frequency)N vertical (letter frequency)
419 Occipital Cuneus R 3.74 21 −96 10 Sup. R 3.51 26 −93 19 orientation × letter status × letter frequency
1351 Occipital Inf. L 4.81 −21 −100 −7 Mid. L 4.36 −42 −90 −5 Inf. L 4.28313 −35 −93 −11 825 Occipital Mid. R 4.26 33 −91 4 Mid. R 4.13 38 −88 12 Inf. R 3.83193 39 −91 −5 number of junctions 1346 Occipital Fusiform L 6.88 −39 −77 −16 Inf. L 4.90 −39 −87 −13 885 Inf. R 5.65 38 −79 −17 Inf. R 4.15 44 −75 −10 Fusiform R 3.68 36 −69 −14
Finally, aside from those effects of interest, an increased activation for configurations with more junctions was observed mainly in bilateral V4. Line junctions are thought to be useful visual features of medium size and complexity along the hierarchy from simple line segments to entire objects or words. In this respect, ourfinding that line junctions cause an increased activation in area V4 is consistent with hierarchical models of visual recognition (Dehaene et al., 2005; DiCarlo et al., 2012; Rolls and Stringer, 2006; Serre et al., 2007; Ullman, 2007), which assume that a hierarchy of feature detectors of increasing com-plexity underlies the ventral occipito-temporal“what” pathway. A sim-ilar region was previously reported to respond more strongly to line
drawings where the line junctions were preserved than when they were deleted (Szwed et al., 2011) (peak around y =−70). Behavioral studies also demonstrate that the presence of diagnostic line junctions facilitates the visual identification of objects and words (Beiderman and Cooper, 1991; Biederman, 1987; Szwed et al., 2011).
Ourfinding of larger activation to letters than to non-letters in early retinotopic areas, however, suggests that physical properties such as feature complexity and size are not the only factor determining the cor-tical representation of visual features. Rather, the history of perceptual experience, including literacy, must also be considered. This conclusion fits with studies of perceptual learning, showing that extensive training
A
B
L e ft h e m is p h e re
R ig h t h e m is p h e re
O rie n ta tio n
Letter frequency
Fig. 7. Letter status effect and its interaction with orientation and letter frequency in higher visual cortex. A: Effects of letter status and presentation orientation. Small brackets indicate a significant difference between letters and non-letters, while large brackets indicate a significant interaction between stimulus orientation and letter status (p b .05). A larger activation for non-letters than for letters was found in many higher-level visual areas, only for horizontally presented stimuli. B: Activations evoked by individual line configurations, sorted as a function of letter frequency in the written language of the subjects. Again, an influence of letter frequency was only observed for horizontally presented stimuli.
to detect a T shape yields increased activation in V1/V2 when this shape is presented in the trained orientation compared to untrained orienta-tions (Sigman et al., 2005). In the reading domain, a similar early visual effect was observed when contrasting words versus scrambled words, particularly at an occipital cortical site corresponding to the horizontal meridian in the left hemisphere (Szwed et al., 2011, 2013). Further, this effect was absent for participants who were not native speakers of the tested language (Szwed et al., 2013). Thesefindings, together with ours, support the hypothesis of an orientation- and location- specific adaptation in the early retinotopic areas, which is experience depen-dent and probably driven by the need for fast and parallel processing (Gilbert et al., 2001b; Gilbert and Sigman, 2007).
It is worth noting that letter selectivity has been previously observed in higher region of the ventral visual pathway, in tasks that required an interaction between the perceptual system and higher-order regions within the reading network. Using a semantic judgment task,Thesen et al. (2012)compared brain responses to letters, non-letters (false font), and real words. They found larger brain responses to letter than non-letters in the lateral posterior fusiform gyrus. This increased neural activity was sustained for an extended duration and was concomitant with the activation of a broad lexico-semantic processing network. Thus,Thesen et al. (2012)suggest that the selectivity to letters in this area depends on top-down influences accompanying high level reading tasks. The recentfinding that this area’s response to letter depends not only on previous experience but also on current context again suggests a top-down influence (Grotheer & Kovács, 2014). Conversely, the adoption of a low-level perceptual task may explain why our study, like previous fMRI studies, did not show letter selec-tivity in lateral posterior fusiform gyrus (Tagamets and Novick, 2000; Vinckier et al., 2007).
Interestingly, we found that the letter status effect reversed in higher visual areas, where there was more activation for non-letters than for letters. Similarly, contrasts between T shapes at untrained orientation versus trained orientation (Sigman et al., 2005), pseudo-letters versus real letters (Vinckier et al., 2007), and rotated words versus words in a normal orientation (Cohen et al., 2008) all yielded an increased activa-tion in higher ventral occipito-temporal cortex. Those effects might reflect an on-line top-down influence, such as additional attention to unfamiliar configurations (Vinckier et al., 2007) or, conversely, de-creased activation to familiar configurations, due to the possibility of top-down predictions (Price and Devlin, 2011). Since such top-down in-fluences are known to be context-dependent (Gilbert et al., 2001a; Price and Devlin, 2011), the horizontal presentation could have offered the most appropriate context for letters and increased this top-down
influence, thus providing a tentative explanation for why such an effect was only found with the horizontal stimuli in Experiment 2.
We also found a letter frequency effect in higher visual cortex. Con-sistent with this observation, previous studies found a larger activation for frequent letters and their combinations than for infrequent ones, an effect which grew from posterior to anterior occipital regions (Binder et al., 2006; Vinckier et al., 2007). We also observed, more surprisingly, a negative correlation between letter frequency and brain activations for non-letters. Non-letters with low letter frequencies yielded larger activations and accounted for the reversed letter status effect in higher visual cortex. This might reflect the fact that high-frequency letters are more resistant to rotations, thus facilitating their recognition under rotated conditions. Such resistance to rotation could result from neural representations generalized over broader angles (Ahissar and Hochstein, 2004; Folta, 2003).
While the effects of letter status and letter frequencies were salient, across two experiments, the current study did not provide any evidence for a natural-scene frequency effect. We didfind an effect of natural-scene frequency in early retinotopic areas in Experiment 1, but it seemed to be entirely imputable to the presence of letters amongst the most frequent stimuli, and vanished once this factor was controlled in Experiment 2. Why did reading experience have such a massive im-pact on the visual processing of line configurations, while experience with natural scenes seemed to have no impact? Since we scanned students, one explanation is that letters have become the most frequent line configuration stimuli in their cultural environment, overriding any (putative) prior effect of natural scenes. Another explanation, not in-compatible with thefirst one, is the distinction between active and pas-sive perceptual learning. Attention and task requirements have been shown to deeply influence perceptual learning (Crist et al., 2001; Li et al., 2004, 2008; McManus et al., 2011). In their absence, perceptual learning is very reduced and occurs only under restricted conditions, e.g. when the unattended stimuli are paired up with attended stimuli (Seitz and Watanabe, 2003) or rewards (Seitz and Watanabe, 2009). Thus, letters might have benefited from the active and intensive experi-ence of reading acquisition, while natural scenes are only perceived pas-sively for the most part. The difference and interaction between the neural mechanisms underlying active and passive perceptual learnings are still unclear (Sasaki, Nanez, and Watanabe, 2010; Seitz and Dinse, 2007). Future studies on this subject will help to shed further light on ourfindings.
It is worth noting that although extensive training plays an impor-tant role in shaping early visual areas (Gilbert et al., 2001a; Sigman et al., 2005), there is clearly a limit on early cortical plasticity. Perceptual learning effect in early visual cortex has so far been mostly observed for relatively simple stimuli such as collinear segments (Zhang and Kourtzi, 2010), T shapes (Sigman et al., 2005), moving dots (Watanabe et al., 2002), or gratings (Folta, 2003; Frenkel et al., 2006). Converging evidence indicates that stimuli as complex as whole words, even after extensive reading experience, continue to rely on higher visual areas such as the VWFA (Dehaene and Cohen, 2011; Glezer et al., 2009; Glezer and Riesenhuber, 2013). In the current study, in contrast to the letter status effect in the early retinotopic areas, a bilateral letter fre-quency effect was only found in higher visual cortex. This result is in ac-cordance with the local combination detectors model (Dehaene et al., 2005) and empirical data showing that case- and location-invariance is only achieved in higher visual cortex (Dehaene et al., 2001, 2004). The complexity of the shapes that can be recognized by neurons in a given area is likely to be strongly constrained by the underlying neural circuitry. For example, it is proposed that the horizontal connections between pyramidal cells in V1 (Gilbert and Wiesel, 1989; Stettler et al., 2002) enable subsets of neurons to represent complex visual features by integrating information beyond the classical receptive field (Gilbert et al., 2001b; Li et al., 2006, 2008; McManus et al., 2011). As a consequence, perceptual learning in V1 is likely to be constrained by the spatial extent of these connections, which Fig. 8. Effect of the number of line junctions in Experiments 1 (left) and 2 (right). A
regres-sion model with letter status and number of junctions was used for Experiment 1 (N = 18, thresholded at pb .005, voxelwise p b .005, uncorrected), while a contrast in the ANOVA model was used in Experiment 2 (N = 18, thresholded at TN 3.12, voxelwise p b .005, un-corrected; clusterwise pb 0.05, FDR corrected).
Appendix Table 1
Parameters for each configuration type in Experiment 1. Configuration Log natural-scene
frequency Log letter frequency Number of junctions Number of terminals Number of closures Number of angles Number of strokes Letter status Convex area (pixel) RT Accuracy −1.44 −2.38 1 4 0 4 2 1 448 446 96% −0.67 −1.16 1 3 0 2 2 1 475 460 94% −0.66 −1.25 1 2 0 1 2 1 505 463 97% −4.30 3 2 1 5 3 0 256 446 99% −4.30 3 2 1 6 3 0 230 429 98% −3.07 3 1 1 4 3 0 228 452 94% −2.71 3 2 1 5 3 0 270 449 99% −2.30 1 4 0 4 3 0 357 453 96% −1.77 2 5 0 6 3 0 323 440 99% −1.62 2 4 0 4 3 0 398 442 99% −1.59 2 6 0 8 3 0 312 434 99% −1.51 −2.54 1 3 0 3 3 1 523 447 95% −1.47 −2.05 2 4 0 4 3 1 451 439 98% −1.16 −1.98 2 3 0 3 3 1 379 438 98% −0.94 2 4 0 4 3 0 345 442 97%
extends over about 4 degree of visual space (Stettler et al., 2002), large enough to detect a simple configuration such as a letter, but probably not an entire word.
In summary, our mainfinding, across two experiments, is that the early visual cortex is highly attuned to literacy, to such an extent that learned letters induce a stronger activation than matched line con figura-tions, especially when presented at the usual horizontal location where letters usually appear in written texts. Those results reaffirm the impor-tance of literacy acquisition in shaping the human visual system (Dehaene et al., 2010; Pegado and Nakamura, 2014; Szwed et al., 2012). Nevertheless, the present study suffers from several limitations. First, it would have been useful to obtain a complete subject-specific delineation of visual areas and retinotopic maps. We did use a within-subject localizer in Experiment 2, but given the time available for scan-ning, we were only able to define ROIs corresponding to horizontal and vertical meridians in early visual areas. Replicating the present results and testing their alignment with full retinotopic maps is an important goal for future search. Second, this study is also limited by the fact that only educated adults were recruited. Because the impact of letters is so strong, fMRI studies of educated adults are not ideal to properly evaluate the original hypothesis proposed byChangizi et al. (2006), according to
which the visual system should also be attuned to natural-scene statistics. Future work should endeavor to replicate the present design, searching for natural-scene frequency effects in illiterate subjects (Dehaene et al., 2010), in children prior to the acquisition of reading (Monzalvo et al., 2012), or in monkeys without specific symbol training (Brincat and Connor, 2004; Hung et al., 2012; Yau et al., 2012).
Acknowledgments
We would like to thank the LBIOM team of the NeuroSpin center for their help in subject recruitment and scanning. We gratefully acknowl-edge Alexis Amadon, from NeuroSpin, for his help with high-resolution fMRI scanning, and Kamil Ugurbil, Essa Yacoub, Steen Moeller, Eddie Auerbach and Gordon Junqian Xu, from the Center for Magnetic Resonance Research, University of Minnesota, for sharing their pulse sequence and reconstruction algorithms. This research was funded by INSERM, CEA, Collège de France, University Paris XI, Agence Nationale de Recherche, and by TAIWAN GRANT NSC 99-2911-I-008-507, NSC 100-2911-I-008-505, NSC 102-2410-H-010-004-MY2, and NSC 102-2911-I-010-507.
Appendix A
Appendix Table 2
Parameters for each configuration type in Experiment 2. Configuration Log natural-scene
frequency Log letter frequency Number of junctions Number of terminals Number of closures Number of angles Number of strokes Convex area (pixel) A −1.12 −2.71 3 2 1 5 3 361 F −1.98 −1.16 2 3 0 2 3 388 H −2.05 −1.47 2 4 0 4 3 338 K −3.52 −2.03 1 4 0 3 3 347 L −1.25 −0.66 1 2 0 1 2 520 T −1.16 −0.67 1 3 0 2 2 503 X −2.38 −1.44 1 4 0 4 2 398 Y −2.54 −1.51 1 3 0 3 3 550
References
Ahissar, M., Hochstein, S., 2004. The reverse hierarchy theory of visual perceptual learn-ing. Trends Cogn. Sci. 8 (10), 457–464.http://dx.doi.org/10.1016/j.tics.2004.08.011. Berkes, P., Orbán, G., Lengyel, M., Fiser, J., 2011. Spontaneous cortical activity reveals
hall-marks of an optimal internal model of the environment. Science (New York, N.Y.) 331 (6013), 83–87.http://dx.doi.org/10.1126/science.1195870.
Biederman, I., 1987. Recognition-by-components: a theory of human image understand-ing. Psychol. Rev. 94 (2), 115–147 (Retrieved fromhttp://www.ncbi.nlm.nih.gov/ pubmed/3575582).
Beiderman, I., Cooper, E., 1991. Priming contour deleted images. Cogn. Psychol. 23, 393–419 Retrieved from http://scholar.google.com/scholar?hl=en&btnG= Search&q=intitle:Priming+contour-deleted+images#8.
Binder, J.J.R., Medler, D. a, Westbury, C.F., Liebenthal, E., Buchanan, L., 2006. Tuning of the human left fusiform gyrus to sublexical orthographic structure. NeuroImage 33 (2), 739–748 (Retrieved from http://www.sciencedirect.com/science/article/pii/ S1053811906007075).
Blakemore, C., Cooper, G., 1970. Development of the brain depends on the visual environ-ment. Nature 228 (5270), 477–478.http://dx.doi.org/10.1038/228477a0. Brett, M., Anton, J.-L., Valabrègue, R., Poline, J.-B., 2002.Region of interest analysis using an
SPM toolbox. 8th International Conference on Functional Mapping of the Human Brain. Sendai, Japan.
Brincat, S.L., Connor, C.E., 2004. Underlying principles of visual shape selectivity in posterior inferotemporal cortex. Nat. Neurosci. 7 (8), 880–886.http://dx.doi.org/10.1038/nn1278. Brincat, S.L., Connor, C.E., 2006. Dynamic shape synthesis in posterior inferotemporal
cortex. Neuron 49 (1), 17–24.http://dx.doi.org/10.1016/j.neuron.2005.11.026. Brunswik, E., 1956. Perception and the representative design of psychological
experi-ments. vol. 6 (Retrieved fromhttp://www.google.com.tw/books?hl=zh-TW&lr= &id=xTwwQvk6XCUC&pgis=1).
Caspers, J., Zilles, K., Eickhoff, S.B., Schleicher, A., Mohlberg, H., Amunts, K., 2013. Cytoarchitectonical analysis and probabilistic mapping of two extrastriate areas of the human posterior fusiform gyrus. Brain Struct. Funct. 218 (2), 511–526.
http://dx.doi.org/10.1007/s00429-012-0411-8.
Changizi, M.A., Zhang, Q., Ye, H., Shimojo, S., 2006. The structures of letters and symbols throughout human history are selected to match those found in objects in natural scenes The, S., Naturalist, A., & May, N. Am. Nat. 167 (5), E117–E139.http://dx.doi. org/10.1086/502806.
Cohen, L., Lehéricy, S., Chochon, F., Lemer, C., 2002. Language‐specific tuning of visual cor-tex? Functional properties of the Visual Word Form Area. Brain 125, 1054–1069 Re-trieved fromhttp://brain.oxfordjournals.org/content/125/5/1054.short.
Cohen, L., Dehaene, S., Vinckier, F., Jobert, A., Montavont, A., 2008. Reading normal and de-graded words: contribution of the dorsal and ventral visual pathways. NeuroImage 40 (1), 353–366.http://dx.doi.org/10.1016/j.neuroimage.2007.11.036.
Crist, R., Li, W., Gilbert, C., 2001. Learning to see: experience and attention in primary visu-al cortex. Nat. Neurosci. 4, 519–525 Retrieved fromhttp://www.nature.com/neuro/ journal/v4/n5/abs/nn0501_519.html.
Dehaene, S., 2009. Reading in the brain: The new science of how we read. (Retrieved fromhttp://books.google.com/books?hl=zh-TW&lr=&id=NlYsTqta7SYC&pgis=1). Dehaene, S., Cohen, L., 2011. The unique role of the visual word form area in reading.
Trends Cogn. Sci. 15 (6), 254–262.http://dx.doi.org/10.1016/j.tics.2011.04.003. Dehaene, S., Naccache, L., Cohen, L., Bihan, D.L., Mangin, J.F., Poline, J.B., Rivière, D., 2001.
Cerebral mechanisms of word masking and unconscious repetition priming. Nat. Neurosci. 4 (7), 752–758.http://dx.doi.org/10.1038/89551.
Dehaene, S., Jobert, A., Naccache, L., Ciuciu, P., Poline, J.B., Le Bihan, D., Cohen, L., 2004. Letter binding and invariant recognition of masked words: behavioral and neuroim-aging evidence. Psychol. Sci. 15 (5), 307–313.http://dx.doi.org/10.1111/j.0956-7976. 2004.00674.x.
Dehaene, S., Cohen, L., Sigman, M., Vinckier, F., 2005. The neural code for written words: a proposal. Trends Cogn. Sci. 9 (7), 335–341.http://dx.doi.org/10.1016/j.tics.2005.05.004. Dehaene, S., Pegado, F., Braga, L.W., Ventura, P., Nunes Filho, G., Jobert, A.,…, Cohen, L., 2010. How learning to read changes the cortical networks for vision and language. Science 330 (6009), 1359–1364.http://dx.doi.org/10.1126/science.1194140. DiCarlo, J.J., Zoccolan, D., Rust, N.C., 2012. How does the brain solve visual object
recogni-tion? Neuron 73 (3), 415–434.http://dx.doi.org/10.1016/j.neuron.2012.01.010. Eickhoff, S., Stephan, K., Mohlberg, H., 2005. A new SPM toolbox for combining
probabi-listic cytoarchitectonic maps and functional imaging data. Neuroimage 25 (4), 1325–1335.http://dx.doi.org/10.1016/j.neuroimage.2004.12.034.
Engel, S., Glover, G., Wandell, B., 1997. Retinotopic organization in human visual cortex and the spatial precision of functional MRI. Cereb. Cortex 7 (2), 181–192 Retrieved fromhttp://cercor.oxfordjournals.org/content/7/2/181.short.
Feinberg, D., Moeller, S., Smith, S., 2010. Multiplexed echo planar imaging for sub−second whole brain FMRI and fast diffusion imaging. PloS one 5 (12), e15710 Retrieved from
http://dx.plos.org/10.1371/journal.pone.0015710.
Folta, K., 2003. Neuralfine tuning during Vernier acuity training? Vis. Res. 43 (10), 1177–1185.http://dx.doi.org/10.1016/S0042-6989(03)00041-5.
Frenkel, M.Y., Sawtell, N.B., Diogo, A.C.M., Yoon, B., Neve, R.L., Bear, M.F., 2006. Instructive effect of visual experience in mouse visual cortex. Neuron 51 (3), 339–349.http://dx. doi.org/10.1016/j.neuron.2006.06.026.
Furmanski, C.S., Engel, S.A., 2000. An oblique effect in human primary visual cortex. Nat. Neurosci. 3 (6), 535–536.http://dx.doi.org/10.1038/75702.
Geisler, W.S., 2008. Visual perception and the statistical properties of natural scenes. Annu. Rev. Psychol. 59, 167–192.http://dx.doi.org/10.1146/annurev.psych.58.110405. 085632.
Gilbert, C.D., Sigman, M., 2007. Brain states: top-down influences in sensory processing. Neuron 54 (5), 677–696.http://dx.doi.org/10.1016/j.neuron.2007.05.019.
Gilbert, C.D., Wiesel, T.N., 1989. Columnar specificity of intrinsic horizontal and corticocortical connections in cat visual cortex. J. Neurosci. Off. J. Soc. Neurosci. 9 (7), 2432–2442 (Retrieved fromhttp://www.ncbi.nlm.nih.gov/pubmed/2746337). Gilbert, C.D., Sigman, M., Crist, R., 2001a. The neural basis of perceptual learning. Neuron
31 (5), 681–697 (Retrieved fromhttp://www.sciencedirect.com/science/article/pii/ S089662730100424X).
Gilbert, C.D., Sigman, M., Crist, R.R.E., 2001b. The neural basis of perceptual learning. Neu-ron 31 (5), 681–697 (Retrieved fromhttp://www.sciencedirect.com/science/article/ pii/S089662730100424X).
Girshick, A.R., Landy, M.S., Simoncelli, E.P., 2011. Cardinal rules: visual orientation percep-tion reflects knowledge of environmental statistics. Nat. Neurosci. 14 (7), 926–932.
http://dx.doi.org/10.1038/nn.2831.
Glezer, L.S., Riesenhuber, M., 2013. Individual variability in location impacts orthographic selectivity in the“visual word form area”. J. Neurosci. Off. J. Soc. Neurosci. 33 (27), 11221–11226.http://dx.doi.org/10.1523/JNEUROSCI.5002-12.2013.
Glezer, L.S., Jiang, X., Riesenhuber, M., 2009. Evidence for highly selective neuronal tuning to whole words in the“visual word form area”. Neuron 62 (2), 199–204.http://dx. doi.org/10.1016/j.neuron.2009.03.017.
Grotheer, M., Kovács, G., 2014. Repetition probability effects depend on prior experiences. J. Neurosci. 34 (19), 6640–6646.http://dx.doi.org/10.1523/JNEUROSCI.5326-13.2014. Harvey, B.M., Dumoulin, S.O., 2011. The relationship between cortical magnification factor and population receptivefield size in human visual cortex: constancies in cortical ar-chitecture. J. Neurosci. Off. J. Soc. Neurosci. 31 (38), 13604–13612.http://dx.doi.org/ 10.1523/JNEUROSCI.2572-11.2011.
Held, R., Hein, A., 1963. Movement−produced stimulation in the development of visually guided behavior. J. Comp. Physiol. Psychol. 56 (5), 872–876 Retrieved fromhttp:// citeseerx.ist.psu.edu/viewdoc/summary?doi=10.1.1.211.8253.
Hess, R.F., Hayes, A., Field, D.J., 2003. Contour integration and cortical processing. J. Physiol. Paris 97 (2–3), 105–119.http://dx.doi.org/10.1016/j.jphysparis.2003.09. 013.
Howe, C.Q., Purves, D., 2002. Range image statistics can explain the anomalous perception of length. Proc. Natl. Acad. Sci. U. S. A. 99 (20), 13184–13188.http://dx.doi.org/10. 1073/pnas.162474299.
Hung, C.-C., Carlson, E.T., Connor, C.E., 2012. Medial axis shape coding in macaque inferotemporal cortex. Neuron 74 (6), 1099–1113.http://dx.doi.org/10.1016/j. neuron.2012.04.029.
Kersten, D., Mamassian, P., Yuille, A., 2004. Object perception as Bayesian inference. Annu. Rev. Psychol. 55, 271–304.http://dx.doi.org/10.1146/annurev.psych.55.090902. 142005.
Knill, D.C., Pouget, A., 2004. The Bayesian brain: the role of uncertainty in neural coding and computation. Trends Neurosci. 27 (12), 712–719.http://dx.doi.org/10.1016/j. tins.2004.10.007.
Larsson, J., Heeger, D.J., 2006. Two retinotopic visual areas in human lateral occipital cortex. J. Neurosci. 26 (51), 13128–13142.http://dx.doi.org/10.1523/jneurosci.1657-06.2006. Li, W., Piëch, V., Gilbert, C.D., 2004. Perceptual learning and top-down influences in primary
visual cortex. Nat. Neurosci. 7 (6), 651–657 (Retrieved fromhttp://www.nature.com/ neuro/journal/v7/n6/abs/nn1255.html).
Li, W., Piëch, V., Gilbert, C.D., 2006. Contour saliency in primary visual cortex. Neuron 50 (6), 951–962.http://dx.doi.org/10.1016/j.neuron.2006.04.035.
Li, W., Piëch, V., Gilbert, C.D., 2008. Learning to link visual contours. Neuron 57 (3), 442–451.http://dx.doi.org/10.1016/j.neuron.2007.12.011.
Long, F., Purves, D., 2003. Natural scene statistics as the universal basis of color context effects. Proc. Natl. Acad. Sci. U. S. A. 100 (25), 15190–15193.http://dx.doi.org/10. 1073/pnas.2036361100.
Maldjian, J.a., Laurienti, P.J., Kraft, R.a., Burdette, J.H., 2003. An automated method for neu-roanatomic and cytoarchitectonic atlas-based interrogation of fMRI data sets. NeuroImage 19 (3), 1233–1239.http://dx.doi.org/10.1016/S1053-8119(03)00169-1. McManus, J.N.J., Li, W., Gilbert, C.D., 2011. Adaptive shape processing in primary visual cortex. Proc. Natl. Acad. Sci. U. S. A. 108 (24), 9739–9746.http://dx.doi.org/10.1073/ pnas.1105855108.
Moeller, S., Yacoub, E., Olman, C.A., Auerbach, E., Strupp, J., Harel, N., Uğurbil, K., 2010. Multiband multislice GE-EPI at 7 tesla, with 16-fold acceleration using partial parallel imaging with application to high spatial and temporal whole-brain fMRI. Magn. Reson. Med. 63 (5), 1144–1153.http://dx.doi.org/10.1002/mrm.22361.
Monzalvo, K., Fluss, J., Billard, C., Dehaene, S., Dehaene-Lambertz, G., 2012. Cortical net-works for vision and language in dyslexic and normal children of variable socio-economic status. NeuroImage 61 (1), 258–274. http://dx.doi.org/10.1016/j. neuroimage.2012.02.035.
Nazir, T. a, Ben-Boutayab, N., Decoppet, N., Deutsch, A., Frost, R., 2004. Reading habits, per-ceptual learning, and recognition of printed words. Brain Lang. 88 (3), 294–311.
http://dx.doi.org/10.1016/S0093-934X(03)00168-8.
New, B., Pallier, C., Ferrand, L., Matos, R., 2001. Une base de données lexicales du français contemporain sur internet: LEXIQUE. Annee Psychol. 101 (3), 447–462 (Retrieved fromhttp://dialnet.unirioja.es/servlet/articulo?codigo=3228917&info=resumen& idioma=ENG).
Pegado, F., Nakamura, K., 2014. Literacy breaks mirror invariance for visual stimuli: a be-havioral study with adult illiterates. J. Exp. Psychol. 143 (2), 887–894 Retrieved from
http://psycnet.apa.org/journals/xge/143/2/887/.
Price, C.J., Devlin, J.T., 2011. The interactive account of ventral occipitotemporal contribu-tions to reading. Trends Cogn. Sci. 15 (6), 246–253.http://dx.doi.org/10.1016/j.tics. 2011.04.001.
Rolls, E.T., Stringer, S.M., 2006. Invariant visual object recognition: a model, with lighting invariance. J. Physiol. Paris 100 (1–3), 43–62.http://dx.doi.org/10.1016/j.jphysparis. 2006.09.004.
Sasaki, Y., Nanez, J.E., Watanabe, T., 2010. Advances in visual perceptual learning and plas-ticity. Nat. Rev. Neurosci. 11 (1), 53–60.http://dx.doi.org/10.1038/nrn2737.