HAL Id: hal-01378466
https://hal.archives-ouvertes.fr/hal-01378466
Submitted on 10 Nov 2016
HAL is a multi-disciplinary open access
archive for the deposit and dissemination of
sci-entific research documents, whether they are
pub-lished or not. The documents may come from
L’archive ouverte pluridisciplinaire HAL, est
destinée au dépôt et à la diffusion de documents
scientifiques de niveau recherche, publiés ou non,
émanant des établissements d’enseignement et de
Model-based investigation of the circadian clock and cell
cycle coupling in mouse embryonic fibroblasts:
Prediction of RevErb-α up-regulation during mitosis
Pauline Traynard, Céline Feillet, Sylvain Soliman, Franck Delaunay, François
Fages
To cite this version:
Pauline Traynard, Céline Feillet, Sylvain Soliman, Franck Delaunay, François Fages. Model-based
investigation of the circadian clock and cell cycle coupling in mouse embryonic fibroblasts:
Pre-diction of RevErb-α up-regulation during mitosis.
BioSystems, Elsevier, 2016, 149, pp.59–69.
�10.1016/j.biosystems.2016.07.003�. �hal-01378466�
Model-based Investigation of the
Circadian Clock and Cell Cycle Coupling
in Mouse Embryonic Fibroblasts:
Prediction of RevErb-α Up-Regulation during Mitosis
Pauline Traynarda, C´eline Feilletb, Sylvain Solimana, Franck Delaunayb,
Fran¸cois FagesIa
aInria, Lifeware Group, Saclay, France
bUniversit´e Nice Sophia Antipolis, CNRS, INSERM, Institut de biologie Valrose, Nice,
France
Abstract
Experimental observations have put in evidence autonomous self-sustained cir-cadian oscillators in most mammalian cells, and proved the existence of molec-ular links between the circadian clock and the cell cycle. Some mathematical models have also been built to assess conditions of control of the cell cycle by the circadian clock. However, recent studies in individual NIH3T3 fibroblasts have shown an unexpected acceleration of the circadian clock together with the cell cycle when the culture medium is enriched with growth factors, and the absence of such acceleration in confluent cells. In order to explain these ob-servations, we study a possible entrainment of the circadian clock by the cell cycle through a regulation of clock genes around the mitosis phase. We develop a computational model and a formal specification of the observed behavior to investigate the conditions of entrainment in period and phase. We show that either the selective activation of RevErb-α or the selective inhibition of Bmal1 transcription during the mitosis phase, allow us to fit the experimental data on both period and phase, while a uniform inhibition of transcription during
ICorresponding author.
Email addresses: Pauline.Traynard@gmail.com (Pauline Traynard),
Celine.Feillet@unice.fr(C´eline Feillet), Sylvain.Soliman@inria.fr (Sylvain
Soliman), Franck.Delaunay@unice.fr (Franck Delaunay), Francois.Fages@inria.fr (Fran¸cois FagesI)
mitosis seems incompatible with the phase data. We conclude on the argu-ments favouring the RevErb-α up-regulation hypothesis and on some further predictions of the model.
Keywords: Quantitative biology, Circadian clock, Cell cycle, Model coupling, Data fitting, Oscillations, Formal methods, Model Checking
1. Introduction
In most organisms, from bacteria to plants and animals, spontaneous gene expression oscillations with a period close to 24 hours have been observed. A biochemical circadian clock present in each cell is responsible for maintaining these oscillations at this period, generally in the form of a self-sustained genetic oscillator entrained by the day/night cycle through various input pathways.
This circadian clock has many effects on cell signaling and metabolism [1]. Experimental results have also shown a regulation of the cell division cycle by the circadian clock [2, 3, 4], in particular in mammalian cells with possible applications to cancer chronotherapies [5, 6]. Molecular links between these two cycles have been exhibited to explain this regulation. In particular the regulation of Wee1, an inhibitor of the G2/M transition, by the clock genes has been proposed to explain the circadian gating of mitosis during the liver regeneration process [2] with 48 hours period doubling phenomena for the cell cycle [7]. Other similar molecular links going in the same direction, through p21 [8] and Chk1 and Chk2 [4, 9], have been shown in different cells in the literature. A few models have also been developed to further investigate those hypotheses, by coupling a model of the cell cycle with a model of the circadian clock through those direct molecular links, and analyzing the conditions of entrainment in period [10, 11, 12].
However, in mouse embryonic fibroblasts NIH3T3, several studies using large-scale time-lapse microscopy to monitor circadian gene expression and cell division events in real time and in individual cells during several days have unveiled unexpected behaviors, hinting that the relationship might be more
complex. Nagoshi et al. [7], have first shown that circadian gene expression in fibroblasts continues during mitosis, but with a consistent pattern in circadian period variation relatively to the circadian phase at division, leading them to hypothesize that mitosis elicits phase shifts in circadian cycles. A more recent study of Bieler et al. [13] relating the same experiments on dividing fibroblasts found the two oscillators synchronized in 1:1 mode-locking leading the authors to hypothesize a predominant influence of the cell cycle on the circadian clock in NIH3T3 cells. This is in agreement with another detailed experimental study of Feillet et al. [14] which found several synchronization states in NIH3T3 fi-broblasts in different conditions of culture. In particular, it was observed in [14] that enriching the culture medium with growth factors by increasing the concentration of Foetal Bovine Serum (FBS) not only accelerates the cell di-vision cycle but also the circadian clock. For cells cultured in 10% FBS, both distributions of the cell cycle length and the circadian clock are centered around 22h. For cells cultured in 15 % FBS, both the cell cycle and the circadian clock accelerate, with period distributions centered around 19 hours. However, when cells reach confluence and stop dividing, the circadian clock slows down and the period distribution is then centered around 24 hours. None of the currently available models coupling the cell cycle and the circadian clock can explain these observations since they are based on an unidirectional influence of the circadian clock on the cell cycle [10, 11] and not on the other direction.
In this paper, in order to explain these observations, we investigate the reverse influence of the cell cycle on the circadian clock, using computational modeling tools. We develop a mathematical model of the influence of the cell cycle on the circadian clock through the differential regulation of clock genes around the mitosis phase, and study the conditions in which the cycles are entrained in period and phase as observed in [14]. For this, we use the circadian clock model of Relogio et al. [15] which has been carefully fitted to phase data on suprachiasmatic cells, and a simple model of the cell cycle by Qu et al. [16] which focuses on the mitosis phase. In [17], we have already shown that the uniform inhibition of transcription during mitosis, as observed in eukaryotes [18], could
explain the acceleration of the circadian clock in non-confluent cells when the concentration of FBS increases [14]. In particular, our model could reproduce the same periods for the cell cycle and the circadian clock for different levels of FBS, modeled by different values for the synthesis parameters of the cell cycle model, but with an incorrect time delay between the cell division and the peak of Reverb-α, which seemed impossible to fix under the hypothesis of a uniform inhibition of transcription during mitosis.
Here, we show that these difficulties can be resolved, using a different hy-pothesis of selective regulation of one clock gene during the M phase, either the activation of Reverb-α or the inhibition of Bmal1. Our coupled model under one of these hypotheses is able to reproduce the experimental measures on periods and phases made by Feillet et al. [14] in individual unperturbed fibroblasts. Fur-thermore we argue that the complex behaviors observed with high variability after a treatment by dexamethasone to synchronize cellular clocks, modeled by the induction of a high level of Per and the inhibition of the other clock core genes, can be explained by the perturbation of the clock after this treatment. Indeed, our model shows that the stabilization time after that pulse appears to be greater than the time horizon of 72 hours used in those experiments.
This computational model has been built using the Biocham modeling soft-ware [19] for
1. importing and exporting models in SBML, and modeling the molecular interactions of the coupling of the models,
2. specifying the observed behavior in quantitative temporal logic using pat-tern formulae for periods and phases [20, 21],
3. searching parameter values [22] and measuring robustness and parameter sensitivity indices [23] with respect to the temporal logic specification of the dynamical behavior1.
1The models and the formal specifications used in this paper are available on http://
2. Experimental Data and their Formal Specification in Temporal Logic
2.1. Experimental Observations and Measurements
In this section we explain the single cell experiments and analyses performed in [14] and the conclusions drawn by the authors. The reported experiments have been done using time lapse videomicroscopy and cell tracking using different fluorescent reporters for the cell cycle and the circadian clock observed during 72 hours in proliferating NIH3T3 embryonic mouse fibroblasts. This cell line was modified to include three fluorescent markers of the circadian clock and the cell cycle: the RevErb-α::Venus clock gene reporter [7] for measuring the expression of the circadian protein2 RevErb-α, and the Fluorescence Ubiquitination Cell Cycle Indicators (FUCCI), Cdt1 and Geminin, two cell cycle proteins which accumulate during the G1 and S/G2/M phases respectively, for measuring the cell cycle phases [24].
The cells were left to proliferate in regular medium supplemented with differ-ent concdiffer-entrations of FBS (10% and 15%). Long-term recording was performed in constant conditions with one image taken every 15 minutes during 72 hours. The lengths of the cell cycles were measured as the time interval between two consecutive cell divisions.
The expression traces of RevErb-α proteins were detrended and smoothed. Spectrum resampling was used to estimate the clock period. Cells with less than two RevErb-α peaks within their lifetime, a period length outside the interval between 5 hours and 50 hours or a relative absolute error (RAE) bigger than 0.25 (showing a confidence interval wider than twice the estimated period) were classified as non-rhythmic and discarded, assuming that they do not have a functioning clock. Finally, the delay between cell division and the next clock marker peak was measured. It revealed that RevErb-α-Venus peaked about 7 h after cell division in all conditions, quite consistently with the delay of 5 hours
2In this paper, the genes are distinguished from the proteins by writing the names of the
for Reverb-α without Venus observed in [25] and [13].
The quantitative data on the periods of the cell cycle and the circadian clock and the phase between them are summarised in Table 1 [14]. Surprisingly, increasing FBS from 10% to 15%, not only decreases the mean period of the cell cycle from 21.3 hours to 18.6 hours, but also the clock period from 21.9 hours to 19.4 hours, i.e. to essentially the same period. This shows that both oscillators remain unexpectedly in 1:1 mode locking. While the speedup of the cell cycle can be directly attributed to the growth factors in increasing concentration of FBS, it can not account for the speedup of the clock the same way, since confluent cells keep a 24-hours period for the circadian clock independently of the FBS concentration [14].
Medium Clock period Division period Mean delay FBS 10% 21.9 h ± 1.1 h 21.3 h ± 1.3 h 8.6 h
FBS 15% 19.4 h ± 0.5 h 18.6 h ± 0.6 h 7.1 h
Table 1: Estimated periods of the circadian molecular clock and the cell division cycle mea-sured in [14] in fibroblast cells without treatment by dexamethasone, for two concentrations of FBS. The time delay is between the cell division time and the next peak of RevErb-α protein.
2.2. Experimental Observations after Treatment by Dexamethasone
Furthermore, a series of experiments were done with a pulse of dexametha-sone (abbreviated in the rest of this paper as Dex) before recording. This glucocorticoid agonist is known to exert a resetting/synchronizing effect on the circadian molecular clocks in cultured cells through the induction of Per genes. In that case, the cells were incubated for 2 hours in the same medium supple-mented with Dex, just before returning to a Dex-free medium for the recording. The resulting dynamics in Dex pulsed cells are more complex. Table 2 summarizes the observed period and phase values reported in [14]. The cells in 10% FBS show an increased clock period and a low cell cycle period, with an overall ratio of 5:4. In 20% FBS the cell lineages are dominated by two groups. The first group shows close periods, i.e. a 1:1 mode-locking similarly to the experiments without dexamethasone. The second group shows a high clock
period and a fast cell cycle, with an overall ratio close to 3:2 between the clock and cell cycle, explaining the three-peaks distribution of the circadian phase at division, as already observed by Nagoshi et al.[7] ten years before. It has to be noted that the 20% FBS dexamethasone-synchronized experiment was repeated with similar results available in the Supplementary Information of [14], although the distribution of the period ratios for the second group is wider in the interval ranging from 1.2 to 2.
Medium Clock period Division period Mean delay FBS 10% 24.2 h ± 0.5 h 20.1 h ± 0.94 h 10.7 h FBS 20% 21.25 h ±0.36 h 19.5 h ±0.42 h 8.3 h
29 h±1.05 h 16.05 h±0.48 h 6h/12h/22h
Table 2: Estimated periods of the circadian molecular clock and the cell division cycle mea-sured in [14] in fibroblast cells after treatment by dexamethasone, for two concentrations of FBS. The time delay is between the cell division and the next peak of RevErb-α protein. The experiment done with 20% FBS have been clustered by the authors of [14] in two groups with different periods.
In [14], the authors suggest that these observations might be interpreted by the existence of distinct oscillatory stable states coexisting in the cell pop-ulations, in particular with 5:4 and 1:1 phase-locking modes for the condition 10% FBS, and 3:2 and 1:1 phase-locking modes for the condition 20% FBS, and that the dexamethasone could knock the state out of the 1:1 mode toward other attractors.
2.3. Formal Specification of Oscillation Properties in Quantitative Temporal Logic
For the analysis of the dynamical behavior of this complex system, we shall make use of a temporal logic language which allows us to express the relevant system’s oscillatory properties to fit, instead of over-specifying them by provid-ing a precise curve to fit. This allows us to combine qualitative properties of oscillations and quantitative properties on the shapes of the traces such as dis-tances between peaks or peak amplitudes. This is useful to capture the periods on either experimental and simulated traces, even when the traces are irregular and noisy. We use formal constraints on the amplitudes and regularity of the
peaks to filter out ambiguous traces, keeping only sustained oscillations with small irregularities, as depicted for instance in Fig. 10.
More precisely, we use the temporal logic formula patterns described in [20, 21] and implemented in our modeling software Biocham [19] to specify the constraints about the successive peaks of concentrations between either the same molecular species (period constraints) or different molecular species (phase constraints). Biocham then provides commands for automatically
• extracting periods and phases from either simulation or experimental nu-merical data time series [26],
• searching the space of the unknown parameters of the model for satisfying period and phase constraints [22],
• measuring parameter sensivity indices and robustness with respect to pe-riod and phase constrainst [23].
For instance, the following command (used in Section 3) computes the va-lidity domain of the variables of a formula pattern used to extract the period of the mitosis promoting factor (MPF) for the cell cycle, and of RevErb-α for the circadian clock, in a trace, together with their relative phase:
validity_domain( Exists([e1,e2,e3],
periodErrors([RevErb_nucl],[periodselect,e1,e2,e3],100) & e1<2 & e2<2 & e3<2))
& period([MPF],[periodMPF])
& phase([MPF,RevErb_nucl],[phase])).
The result for the simulation trace displayed on the bottom of Fig. 6 is periodselect = 20.023, periodMPF = 20.046, phase = 6.765 Since the trace of MPF shows sustained and regular oscillations in all simula-tions, the simple predicate period is used here to extract the mean of the last two peak-to-peak intervals. The predicate phase similarly captures the mean of the last two time intervals between MPF and RevErb-α peaks. On the other hand, the period constraint on the oscillations of RevErb-α is expressed by the
predicate periodErrors which deals with irregular traces. The validity domains of its variables provide the mean of the last two RevErb-α peak-to-peak intervals in the variable periodselect, along with several variables characterizing irregu-larity features of the trace, namely e1 for the irregularities in distances between peaks (it denotes the maximum difference between two intervals), e2 for the ir-regularities in the amplitudes of the peaks (it quantifies the differences between the amplitudes of the peaks), and e3 being a non-null error if the concentration amplitude is too small (below 0.1). Setting thresholds on these variables ensures that irregular traces are filtered out. Furthermore, a transient time of 100h is used to avoid the irregularities caused by the initial state. The logical quantifier Exists projects the validity domain of the variables on the single dimension for periodselect for the answer, and eliminates the other dimensions for e1, e2 and e3.
It is worth noting that for the purpose of parameter search, irregular traces after transient time should not be filtered out in order to orient the search algo-rithm in a promising direction, when oscillations begin to appear for instance. The formula below specifies a constraint on period and phase for parameter search, without constraint on the period errors:
add_search_condition(
periodErrors([RevErb_nucl],[period,e1,e2,e3],100) & Exists([phase], phase([MPF,RevErb_nucl],[phase])
& phase>minphase & phase<maxphase), [period,e1,e2,e3,minphase,maxphase],[21.3,0,0,0,3,5.5], 300,[(kdie,kdie21)]).
This formula is used by the parameter search procedure for testing the param-eter values in different conditions. The condition expressed here, kdie=kdie21, fixes a particular value for the parameter kdie which determines the period of the cell cycle model (detailed in the next Section) in accordance with one of the ex-perimental values for FBS. A time horizon of 300h is specified for the simulation. The validity domains for the variables [period,e1,e2,e3,minphase,maxphase] are compared to the objective values [21.3,0,0,0,3,5.5] in order to determine a score for the constraint (as the Euclidean distance to the objective values). The
addi-tional variables minphase and maxphase are used to score the distance from the phase to the objective interval [3,5.5], enabling some flexibility in the searched value for the phase. For instance, the best set of parameters found as a solu-tion after the calibrasolu-tion procedure detailed in 4.2 has the score 0.54 for this constraint..
Furthermore, the difference between the periods of the cell cycle and the circadian clock is used to score the entrainment in period of the circadian clock by the cell cycle. This is achieved by the following formula with the variable diff :
satisfaction_degree( Exists([p1,p2],
Exists([e1,e2,e3],
periodErrors([RevErb_nucl],[p1,e1,e2,e3],100) & e1<3 & e2<3 & e3<3)
& period([MPF],[p2]) & diff=p2-p1), [diff],[0],300).
This formal specification of entrainment in period is used to compute the satis-faction degrees displayed in Fig. 7. Each value scores the difference between the two periods with a continuous satisfaction degree between 0 (no entrainment) to 1 (null difference, perfect entrainment).
3. Cell Cycle and Circadian Clock Models 3.1. Model of the Cell Cycle
The cell cycle of mammalian cells is composed of five phases: the quiescent phase G0 where cells can stay without dividing, the growth phase G1 for en-tering the cell cycle, the DNA replication phase S, the gap phase G2, and the chromosome segregation and mitosis phase M phase. Each phase is character-ized by a particular protein of the cyclin family, which forms a complex with a cyclin-dependent-kinase (CDK) and determines the activity of the phase. The mouse embryonic fibroblast cells considered in this paper are quickly dividing cells. However, those cells with growth factors also reach confluence and the G0 quiescent phase when they have no more space to divide, i.e. G0 by contact inhibition.
For our purpose of investigating the hypothesis of a regulation of some clock genes around mitosis, it is sufficient to use a cell cycle model focusing on the mitosis phase. We use a model proposed by Qu et al. [16] in which the cell cycle is divided in two different phases: the G1/S/G2 phase and the M phase. Of course, more detailed models distinguishing the four phases of the cell cycle exist, e.g. [10], making possible to represent various regulations of the cell cycle by the circadian clock genes, for instance through p21 and c-Myc on G1, and Wee1 on the G2/M transition. However, since the consequences of those regulations have not been observed in the experimental data considered in this paper, those extra details are irrelevant for our focus on the reverse effect of the cell cycle on the circadian clock by the regulation of clock genes around mitosis. The simpler two phase model of Qu et al. [16] is thus sufficient to investigate this hypothesis. In this model, the M phase is triggered by the complex Cdk1/Cyclin-B. This complex appears in two forms, an active form called MPF (M-phase Pro-moting Factor) and a phosphorylated, inactive form called preMPF. MPF is phosphorylated and inactivated by the kinase Wee1, and dephosphorylated and activated by the phosphatase Cdc25. Both the kinase and phosphatase activ-ities are themselves regulated by MPF, respectively inactivated and activated by the complex, as depicted in Fig. 1.
MPF preMPF Cdc25P Cdc25 Wee1 Wee1P IE APCi APC
Figure 1: Schema of the cell cycle model of Qu et al. [16]. Solid arrows represent biochemical
reactions while dashed arrows denote enzyme catalysis. Red arrows denote an inhibition
through activation of the degradation.
In this model, we assessed the effect of the different reaction rate constants on the period of the cell cycle using sensitivity analysis. We found that two
parameters are able to change widely the range of the cell cycle period without changing significantly the strength of the coupling: kdie, the degradation rate constant of the intermediary enzyme involved in the negative feedback loop between MPF and the proteasome APC, particularly important in G1/S, and kampf, the activation rate constant of MPF by Cdc25p, which plays a role in G2/M. In the supplementary material of [14], both the phases G1 and S/G2/M seem to be shortened in enriched FBS. Therefore there is no reason to prefer kdie (active in G1) or kampf (active in G2/M) to modulate the cell cycle period. We choose kdie as varying parameter affected by FBS because its activity is during the cell growing phase G1. The same results could be obtained with kampf.
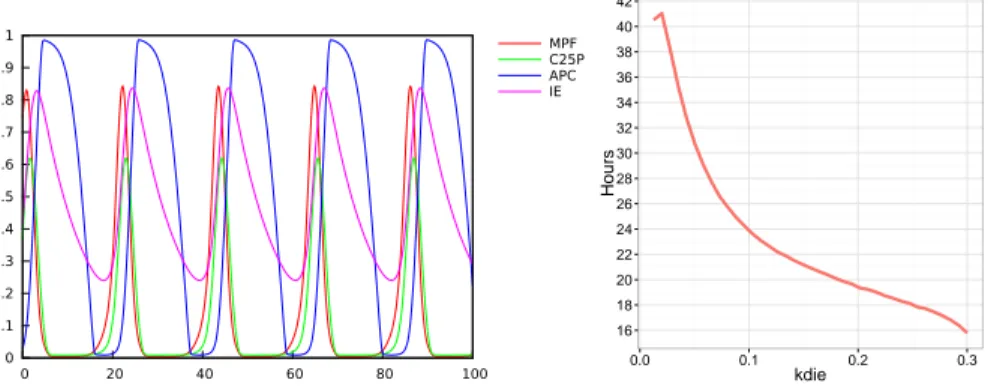
A simple parameter search gives the following values for kdie: 0.147 for a cell division period of 21.3 hours corresponding to 10% FBS, and 0.23 for a period of 18.6 hours corresponding to 15% FBS). 0 0.1 0.2 0.3 0.4 0.5 0.6 0.7 0.8 0.9 1 0 20 40 60 80 100 MPF C25P APC IE 16 18 20 22 24 26 28 30 32 34 36 38 40 42 0.0 0.1 0.2 0.3 kdie Hours
Figure 2: Left: Simulation of the cell division cycle model of Qu et al. Right: Period of the cell division cycle (measured as the distance between successive peaks of MPF) as a function of the parameter kdie for MPF activation by Cdc25p in the model of Qu et al.
3.2. Model of the Circadian Clock
It has been shown in mice that in absence of synchronisation by a central clock, autonomous circadian oscillators are maintained in peripheral tissues, although they are progressively desynchronized [27] because each one of them has its own period, that varies slightly from 24h. This has been confirmed in cultured NIH3T3 cells first in [7] and then in [13] and [14]. In each of those
studies, confluent fibroblasts have a circadian clock period close to 24 hours regardless of the medium concentration.
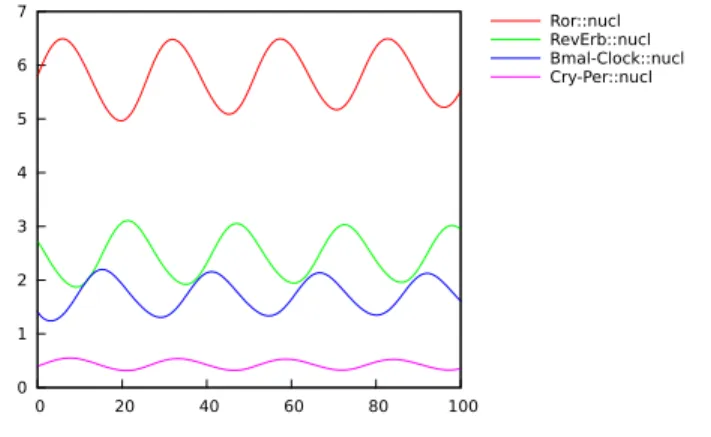
In this paper we use the circadian clock model of Relogio et al. [15] which has been fitted on mouse suprachiasmatic neurons with precise data on the am-plitude and phases of the different components. This model is composed of 20 species, 71 parameters, and several feedback loops. Two major transcription factors, Clock and Bmal1 heterodimerize and activate the transcription of the period (Per1 and Per2 ), cryptochrome (Cry1 and Cry2 ), RevErb-α and Ror clock genes. The Per and Cry proteins associate and inhibit their own expression and that of the RevErb-α and Ror through direct inhibition of the Clock/Bmal1 transcriptional activity. Furthermore, the antagonistic RevErb-α and Ror tran-scription factors regulate the rhythmic trantran-scription of Bmal1 and Clock. These interlocked feedback loops generate robust 24 hours self-sustained oscillations that in turn control the expression of a large set of downstream clock-controlled genes. A simulation trace of this model is shown in Fig. 3.
0 1 2 3 4 5 6 7 0 20 40 60 80 100 Ror::nucl RevErb::nucl Bmal-Clock::nucl Cry-Per::nucl
Figure 3: Simulation trace of the concentrations of the clock gene products in the nucleus over a time horizon of 100h in the model of Relogio et al. [15].
4. Coupled Model
4.1. Hypothesis of a Selective Regulation of Clock Gene Transcription triggered by Mitosis
In this paper, we investigate the hypothesis that a differential inhibition/ac-tivation of some clock genes around the M phase could explain the observations made and reproduce consistent values for the period of the circadian clock and the delay between the divisions and RevErb-α-Venus peaks for the different values of FBS.
To assess this hypothesis, we model the inhibition or activation of clock genes transcription with five multiplicative coefficients I i (i ∈ [1..5]), associated to the synthesis rate parameters of the model of Relogio et al. [15] for each of the five clock genes. Each coefficient takes the value 1, except during a window starting at the beginning of the M phase, where its value is changed with an event triggered by the decrease of MPF. Another event is triggered at the end of the regulation window to reset the coefficient. During this window, whose length is defined by a parameter duration, the coefficient for the circadian core gene i takes the value of the dimensionless parameter coefsynthi, that defines
the inhibition/activation strength of this clock gene. This value is included in the interval [0, 3], where 0 denotes a full inhibition (i.e., strong coupling), 1 marks no effect of the mitosis on the synthesis (no coupling), and more than 1 induces some activation (coupling again). The value of the regulation duration parameter is also considered in the interval [0, 3] hours.
Our coupled model of the cell cycle and the circadian clock thus uses six parameters: the regulation strengths of the clock genes (coefsynthi (i ∈ [1..5])
and the duration of the regulation.
parameter(duration,2). parameter(endMitosis,0).
For each clock gene i: parameter(I_i,1).
parameter(coefsynth_i,0).
add_event([MPF]<0.5,endMitosis,Time+duration). add_event([MPF]<0.5, I_i, coefsynth_i).
add_event(Time>=endMitosis, I_i, 1).
It is worth noting that this way of coupling the models enforces the fact that for quiescent cells, whatever the FBS concentration is, the transcription rate is unaffected by mitosis. As a consequence, the clock necessarily returns to a period of 24 hours in confluent cells, as observed in the experiments.
4.2. Coupling Parameters
In our coupled model, the influence of the cell cycle on the circadian clock is modeled by a set of parameters that express the regulation coefficient (activation or inhibition) of clock gene synthesis during mitosis. We use the parameter search procedure of Biocham based on stochastic optimization [22] to find the sets of values for the coupling parameters that reproduce the entrainment in period and phase observed in the data. Using the behavior specification detailed in Section 2.3, we define a multi-condition objective for the four conditions kdie=0.1, kdie=0.147, kdie=0.18 and kdie=0.23: the period of the circadian clock must be equal to the period of the cell cycle, respectively 24 hours, 21.3 hours, 20h and 18.6 hours. Furthermore, in each condition, the delay between MPF and RevErb-α peaks must be between 6.5 hours and 8.6 hours.
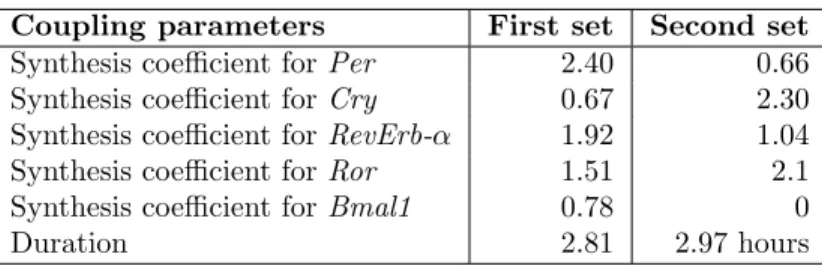
Coupling parameters First set Second set Synthesis coefficient for Per 2.40 0.66 Synthesis coefficient for Cry 0.67 2.30 Synthesis coefficient for RevErb-α 1.92 1.04 Synthesis coefficient for Ror 1.51 2.1 Synthesis coefficient for Bmal1 0.78 0
Duration 2.81 2.97 hours
Table 3: Two sets of synthesis regulation coefficients during mitosis, found by Biocham’s calibration procedure for satisfying the temporal logic specification of period and phase data. The first set was found with initial values equal to 1 for all synthesis coefficients, while the second was found with null initial values.
Essentially, two types of solutions, shown in Table 3, are found. If the initial values are 1 for all synthesis coefficients, corresponding to no inhibition during mitosis, the best result found after 55 iterations on a population of 95 sets of
parameters gives the first set of parameters reported in Table 3. This solution corresponds to an activation of RevErb-α, Per and Ror, while Bmal1 and Cry transcription is weakly inhibited. If the parameter search starts from a full inhibition triggered by mitosis for all clock genes, corresponding to initial values of 0 for all synthesis coefficients, the second set is the best result found after 260 iterations on a population of 95 sets of parameters. In this parameter set, a full inhibition is found for Bmal1 transcription, and a smaller inhibition for Per transcription. Cry and Ror transcriptions are activated while the RevErb-α transcription is mostly unaffected.
The simulation of the model with any of these two sets of parameters shows a delay between the starting time of the mitosis effect and the circadian clock consistent with the experimental data (close to 7 hours for the first set, and between 7 and 8.5 hours for the second one), as well as consistent period values. The stochastic optimization procedure for parameter search returns numerical values for all coupling parameters, however one must check which parameter values are necessary for the correct entrainment, and which parameters have no impact on the satisfaction of the specification of the behavior. To this end, we perform a sensitivity analysis by computing the response curves for the period of the circadian clock and the delay between mitosis and the next RevErb-α peak by varying each coupling parameter, in the condition where the cell cycle has a period of 21 hours.
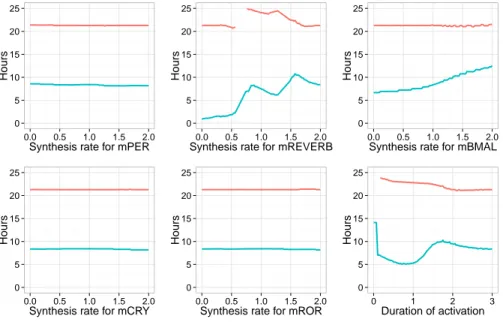
The results for the first set of parameters are shown in Fig. 4. These simu-lation results reveal that the entrainment in period and phase of the circadian clock depends only on the effect of mitosis on RevErb-α and Bmal1, and on the duration of this effect. In the first parameter set, the activation of RevErb-α is crucial for the entrainment in period. On the other hand, varying the synthesis coefficients during mitosis for Per, Cry or Ror has no significant effect on the entrainment in period and phase. More specifically, the clock is entrained to the cell cycle period of 21 hours if the coefficient multiplied to the synthesis rate of RevErb-α is at least 1.7, and the inhibition lasts at least 2 hours. In this con-dition the time delay between divisions and RevErb-α peaks is consistent with
0 5 10 15 20 25 0.0 0.5 1.0 1.5 2.0
Synthesis rate for mPER
Hours 0 5 10 15 20 25 0.0 0.5 1.0 1.5 2.0
Synthesis rate for mCRY
Hours 0 5 10 15 20 25 0.0 0.5 1.0 1.5 2.0
Synthesis rate for mREVERB
Hours 0 5 10 15 20 25 0.0 0.5 1.0 1.5 2.0
Synthesis rate for mROR
Hours 0 5 10 15 20 25 0.0 0.5 1.0 1.5 2.0
Synthesis rate for mBMAL
Hours 0 5 10 15 20 25 0 1 2 3 Duration of activation Hours
Figure 4: Period of the circadian clock (red) and time delay between MPF and RevErb-α proteins peaks (blue) in the coupled model calibrated with the first set of parameters, and when the cell cycle has a period of 21 hours. The peaks on the blue curves on the right figures characterize irregular oscillating traces (due to a partial entrainment in period).
the data, with RevErb-α peaks occuring 7 hours after division. An inhibition of RevErb-α would also preserve the entrainment in period, but the circadian phase at division would become inconsistent with the data, with RevErb-α peaks oc-curring just after mitosis. One can notice that an activation on Bmal1 would also increase the time delay of RevErb-α peaks after division.
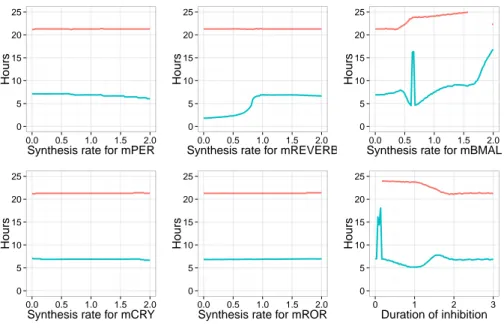
The results for the second set of parameters are shown in Fig. 5. These simulation results reveal similarly that the entrainment in period and phase of the circadian clock depends only on the effect of mitosis on Bmal1 and RevErb-α, and not on Per, Cry or Ror. However in this case the entrainment in period depends on the effect on Bmal1 which has to be inhibited with a coefficient smaller than 0.2 in order for the circadian clock to be entrained at 21 hours with a correct delay after division.
0 5 10 15 20 25 0.0 0.5 1.0 1.5 2.0
Synthesis rate for mPER
Hours 0 5 10 15 20 25 0.0 0.5 1.0 1.5 2.0
Synthesis rate for mCRY
Hours 0 5 10 15 20 25 0.0 0.5 1.0 1.5 2.0
Synthesis rate for mREVERB
Hours 0 5 10 15 20 25 0.0 0.5 1.0 1.5 2.0
Synthesis rate for mROR
Hours 0 5 10 15 20 25 0.0 0.5 1.0 1.5 2.0
Synthesis rate for mBMAL
Hours 0 5 10 15 20 25 0 1 2 3 Duration of inhibition Hours
Figure 5: Period of the circadian clock (red) and phase between the division and RevErb-α protein (blue) in the coupled model calibrated with the second set of parameters, and when the cell cycle has a period of 21 hours.
4.3. Simulation Results for the Selective Activation of RevErb-α during Mitosis The first set of coupling parameter values points toward the hypothesis of a selective activation of the circadian clock gene RevErb-α triggered by mitosis. Thanks to the previous sensitivity analysis, the first coupling parameter set can be simplified to consider a single activation of RevErb-α (corresponding to a coefficient equal to 2), and no effect on the other clock genes.
It is worth noting that an up-regulation of RevErb-α translation during the M phase has already been observed in a genome-wide experimental study inter-rogating the translational lanscape during cell cycle progression using ribosome profiling [28]. This provides one first argument for considering this hypothesis in the first place.
kdie FBS Circadian clock Cell division Phases (h) % period (h) period (h)
0.077 5 26.14 26.12 6.1
0.147 10 21.52 21.28 8.5
0.229 15 18.48 18.60 7.2
Table 4: Periods and time delays measured in the coupled model with different values of kdie for modeling the different culture conditions (the correspondance with 5% FBS is speculative since no significant experiment was done in this condition). The delays are the time observed by simulation between the peaks of concentration of MPF and RevErb-α.
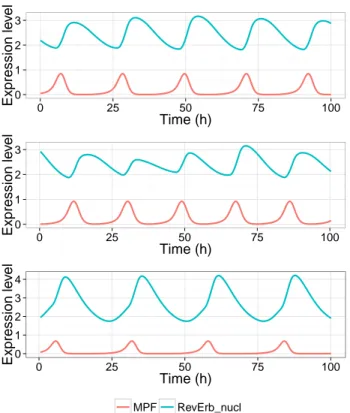
Table 4 shows the periods of the circadian clock and the cell division cycle and the delay between the starting time of the inhibition of RevErb-α, when the peak of MPF overtakes the threshold 0.5, and the following peak of RevErb-α in our model with different values of kdie corresponding to the different culture conditions. As shown in the right panel of Fig. 2, it is possible to simulate the experimental medium enrichment with 10 or 15% FBS by varying the parameter kdie of the cell cycle model to obtain the same values for the period of the cell division cycle. In all cases, the cell division manages to entrain the circadian clock (that has a free period around 24 hours) to its period, simply through this mechanism of selective transcription activation, as depicted in Fig. 6. These simulation results reproduce quite well the data of Table 1 when there is no treatment by Dex.
0 1 2 3 0 25 50 75 100 Time (h) Expression le v el 0 1 2 3 0 25 50 75 100 Time (h) Expression le v el 0 1 2 3 4 0 25 50 75 100 Time (h) Expression le v el MPF RevErb_nucl
Figure 6: Simulation of the model with the activation of the transcription of RevErb-α trig-gered by mitosis, during 72 hours. Top: the cell cycle has a period of 21.3 hours. Middle: the cell cycle has a period of 20.1 hours. Bottom: the cell cycle has a period of 26 hours.
Interestingly, our model can also have a cell division time higher than 24 hours, for instance with kdie=0.077 which might correspond to a concentration of FBS around 5%. In that case the model predicts that the cell cycle will still entrain the circadian clock, lowering its period. Moreover, RevErb-α peaks are predicted to stay just after the mitosis.
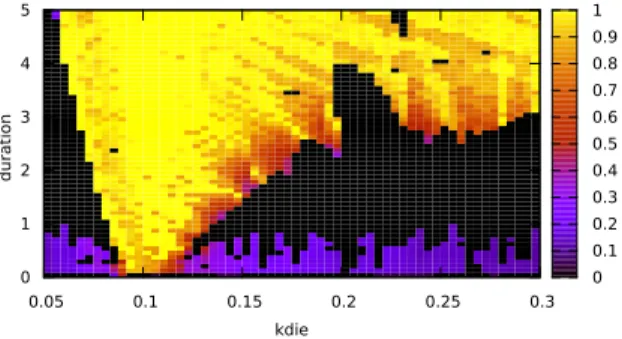
0.05 0.1 0.15 0.2 0.25 0.3 kdie 0 1 2 3 4 5 durat ion 0 0.1 0.2 0.3 0.4 0.5 0.6 0.7 0.8 0.9 1
Figure 7: Absolute difference between the periods of the circadian clock and the cell cycle, as a function of kdie for varying the cell cycle period, duration, the duration of the activation of RevErb-α transcription triggered by mitosis. The landscape is computed as the satisfaction degree of the third formula detailed in 2.3. The color translates the distance from the value found for the period difference diff to the objective 0. Full satisfaction in yellow indicates equal periods for MPF and RevErb-α proteins, while the other colours indicate the abso-lute difference. Black indicates an absence of result for the specification, meaning that the regularity constraints set on the trace of RevErb-α with the function periodErrors were not met.
The landscape in Fig. 7 is computed to assess the role of the inhibition or activation duration. It shows the variation of the difference between the periods of RevErb-α for the circadian clock and MPF for the cell cycle when the two parameters kdie and duration vary. The value of each period is captured with a temporal logic specification as seen in the subsection 2.3. The result for the activation of RevErb-α. is shown in Fig. 7. Three domains can be distinguished in this parameter space. In the domain in yellow, the circadian clock is entrained to the same period as the cell cycle. This domain of entrainment is wider for a long duration of activation. For a short duration, the circadian clock can only be entrained by the cell cycle if the entraining period is close to 24 hours (corresponding to kdie= 0.1). In the purple domain at the bottom (for a low value of duration), the difference between the two periods is high because the
clock is not entrained, hence it keeps its period constant and close to 24 hours. Finally, these two domains are separated by a black domain where the clock oscillations are partially entrained and become irregular.
One can notice that the longer the activation of RevErb-α, the wider the range of values of kdie over which the circadian clock can be entrained. In particular, the clock can be entrained by the cell cycle when kdie = 0.23, corre-sponding to the smallest period (18 hours) reported in the data, if the duration of the activation is at least 3 hours.
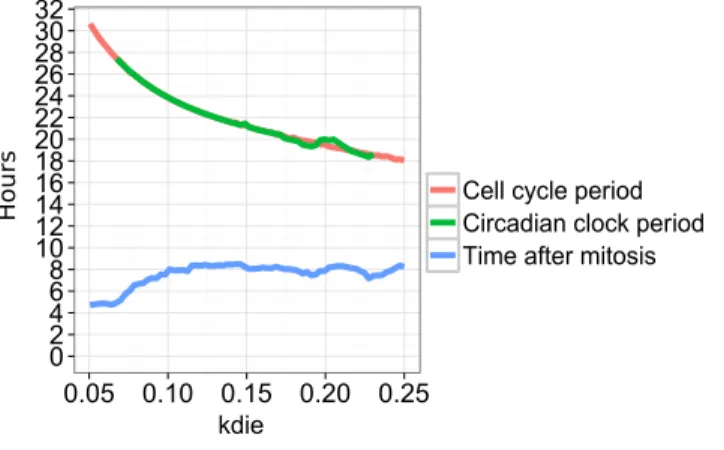
The entrainment both in period and phase with an activating effect during 3 hours is visualized in Fig. 8. It shows the response curve for the periods of the cell cycle and the circadian clock, and the time delay between the peaks of MPF and RevErb-α in the simulations when the parameter kdie varies.
0 2 4 6 8 10 12 14 16 18 20 22 24 26 28 30 32 0.05 0.10 0.15 0.20 0.25 kdie
Cell cycle period Circadian clock period Time after mitosis
Hours
Figure 8: Entrainment in period and phase of the circadian clock when the period of the cell cycle varies with the parameter kdie, with the activation of RevErb-α triggered by mitosis. The blue curve depicts the time delay between peaks of MPF and RevErb-α in the simulations.
4.4. Predictions on the phases in the clock
The experimental data on the phases between clock components in prolifer-ating cells are sparse. The model allows us to investigate whether the coupling from the cell cycle affects the phases between clock mRNAs and proteins. The following in silico experiment has been performed to this end: in the coupled
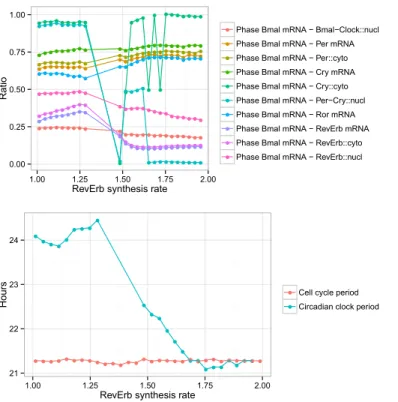
model with a fast cell cycle (21 hours), the strength of the activation of RevErb-α is changed in a set of simulations and the phases between clock components are captured in each simulation, normalised by the clock period. The results are shown in Fig. 9.
● ●● ● ● ● ● ● ● ● ●● ● ● ● ● ● ● ● ● ● ● ● ● ● ●● ● ● ● ●● ● ● ● ● ● ● ● ● ● ● ● ● ● ● ● ● ● ● ● ● ● ● ● ● ● ● ● ● ●● ● ● ● ● ● ● ● ● ● ● ● ● ● ● ● ● ● ●● ● ● ●● ● ● ● ● ● ● ● ● ● ● ● ● ● ● ● ● ● ● ● ● ● ● ● ● ● ● ● ● ● ● ● ● ● ● ● ● ● ●● ● ● ● ● ● ● ● ● ●● ● ● ● ● ● ● ● ● ● ● ● ● ● ● ● ● ● ● ● ● ● ● ●● ● ● ● ● ● ● ● ● ● ● ● ● ● ● ● ● ● ● ● ● ● ● ●● ● ● ● ● ● ● ● ● ● ● ● ●● ●● ● ● ● ● ● ● ● ● ● ● ● ● ● ● ● ● ● ● ● ● ● ● ● ● ● ● ● ● ● ● ● ● ● ●● ● ● ● ● ● ● ● ● 0.00 0.25 0.50 0.75 1.00 1.00 1.25 1.50 1.75 2.00
RevErb synthesis rate
Ratio ● ● ● ● ● ● ● ● ● ●
Phase Bmal mRNA − Bmal−Clock::nucl Phase Bmal mRNA − Per mRNA Phase Bmal mRNA − Per::cyto Phase Bmal mRNA − Cry mRNA Phase Bmal mRNA − Cry::cyto Phase Bmal mRNA − Per−Cry::nucl Phase Bmal mRNA − Ror mRNA Phase Bmal mRNA − RevErb mRNA Phase Bmal mRNA − RevErb::cyto Phase Bmal mRNA − RevErb::nucl
● ●● ●● ● ● ● ● ● ● ● ● ● ● ● ● ● ● ● ● ●● ● ● ● ● ● ● ● ● ● ● ● ● ● ● ●● ● ● ● ● ● ● ● ● ● ● ● ● ● ● ● 21 22 23 24 1.00 1.25 1.50 1.75 2.00
RevErb synthesis rate
Hours
● ●
Cell cycle period Circadian clock period
Figure 9: Circadian clock phases in the coupled model when the cell cycle has a period of 21 hours and the activation of RevErb-α varies. Note that the deep variations between synthesis rates 1.25 and 1.75 can be explained by irregular oscillations caused by partial entrainment, on which measured phases are not reliable.
The simulations reveal that in the entrained condition (when the synthesis rate of RevErb-α is activated with a coefficient higher than 1.75), the phases between clock components are impacted by the periodic activation of RevErb-α resulting from the coupling with the cell cycle, compared to their values in the free clock (when the synthesis rate of RevErb-α is activated with a coefficient close to 1). In particular, the phase between Bmal1 and RevErb-α mRNAs shows a small advance, that impacts similarly the phases between Bmal1 and
RevErb-α in the cytoplasm and in the nucleus. Notably, the other clock genes and proteins targeted by Bmal1 exhibit a phase delay when the synthesis of RevErb-α is activated during mitosis.
The prediction is thus that in dividing cells, the phases between the clock proteins slightly but significantly differ from the phases in quiescent cells. 4.5. Comparison to Experimental Data after Treatment by Dexamethasone
In order to take into account the experiments with dexamethasone, the model can be extended with an event, lasting for two hours, and inducing Per mRNA while inhibiting the other clock genes.
Fig. 10 shows that in our models, regardless of the growth factors in the medium (i.e. of the value of kdie), the Dex pulse results in a perturbation of the clock and then returns to the observed entrainment.
1.6 1.8 2 2.2 2.4 2.6 2.8 3 3.2 3.4 160 180 200 220 240 260 280 300 RevErb_nucl 1.6 1.8 2 2.2 2.4 2.6 2.8 3 3.2 3.4 160 180 200 220 240 260 280 300 RevErb_nucl
Figure 10: Effect of a dexamethasone pulse on the entrainment resulting from the periodic activation of RevErb-α synthesis by the cell cycle. The pulse alters the clock before returning to the previously observed entrainment regime. In the left panel the pulse is from time 162 to 164 while on the right it is from 170 to 172. The left panel’s peak-to-peak distance is in the [18.8; 22.7] interval, while the right one remains in the [20.9; 21.7] interval. This might correspond to the two groups observed in [14]. The time to recover normal entrainment varies but is often larger than 72 hours.
These simulations point us to the possibility that the noisy data reported in Table 1 after the Dex pulse might simply be due to the various cellular states in which the pulse happened and to the time necessary for the cells to recover their clock entrainment, rather than to two different oscillatory attractors of the system. A pulse at time 170h disrupted only slightly our clock, leading to mostly remaining in mode-locking 1 : 1, whereas advancing that same pulse by 8 hours (corresponding to giving the pulse to a cell in a different state) leads
to a bigger disturbance, some peak-to-peak distances close to 23 hours, others to 18 hours, and even if this is transitory, this might correspond to the type of data observed in the Group 2 of Table 1.
One can remark that an alternative hypothesis could be that Dex causes a stress response linked to the cell cycle and the circadian clock. This would still look like noise, but there could be a mechanistic explanation for this effect which could be investigated with a modeling approach. However, to our knowledge, a short treatment by Dex is not known to cause a stress response.
4.6. Simulation Results for the Selective Inhibition of Bmal1 during Mitosis The second solution found by the calibration procedure in section 4.2 is discussed here. Like the activation of RevErb-α transcription, the inhibition of Bmal1 during 3 hours, triggered at mitosis, is able to entrain the circadian clock in a wide range of periods (18-28 hours). The results summarized in Table 5 show a similarly good fit to the experimental data on periods and phases. The resulting traces are displayed in Fig. 11 for different cell cycle length conditions. The entrainment in phase, ie. the duration between mitosis and the following RevErb-α peak, differs between the two couplings, as shown in Fig. 12. In both cases, when the cell cycle has a period smaller than 24 hours, the circadian clock marker RevErb-α peaks 6 hours to 8 hours after mitosis. When the cell cycle period is greater than 24 hours, a notable difference can be seen for the predicted phase: with an activation of RevErb-α, RevErb-α still peaks just after the mitosis. But with an inhibition of Bmal1, RevErb-α peaks 18 to 24 fours after the mitosis. No experimental observations exist in a slowed down cell cycle condition, but [7] and [13] report some cells dividing not long after the circadian peak where the circadian clock was found to be slowed down. On the other hand, the large translational landscape of gene expression during cell-cycle progression reported in [28] does not consider Bmal1 nor any clock gene other than RevErb-α.
0 1 2 0 20 40 60 Time (h) Expression le v el 0 1 2 0 20 40 60 Time (h) Expression le v el 0 1 2 3 0 20 40 60 Time (h) Expression le v el MPF RevErb_nucl
Figure 11: Simulation of the model with the the periodic transcription of Bmal1 activated by mitosis, during 72 hours. Top: the cell cycle has a period of 21.3 hours. Middle: the cell cycle has a period of 20.1 hours. Bottom: the cell cycle has a period of 26 hours.
0 2 4 6 8 10 12 14 16 18 20 22 24 26 28 30 32 0.05 0.10 0.15 0.20 0.25 0 2 4 6 8 10 12 14 16 18 20 22 24 26 28 30 32 0.05 0.10 0.15 0.20 0.25 kdie
Cell cycle period Circadian clock period Time after mitosis
kdie
Hours Hours
Figure 12: Entrainment in period and phase of the circadian clock when the period of the cell cycle varies with the parameter kdie, with the inhibition of Bmal1 (left) or the activation of RevErb-α (right) triggered by mitosis. In the right panel, the circadian clock period is missing for low kdie values because the oscillations are irregular. The blue curves depict the time delay between peaks of MPF and RevErb-α in the simulations.
kdie FBS Circadian clock Cell division Phases (h) % period (h) period (h)
0.077 5 26.09 26.10 23.2
0.147 10 21.28 21.28 6.8
0.229 15 17.99 18.60 6.3
Table 5: Periods and time delays reproduced by the coupled model with different values of kdie for modeling the different culture conditions (the correspondance with 5% FBS is speculative since no experiment was done in this condition). The delays are the time observed by simulation between the peaks of concentration of MPF and RevErb-α.
4.7. Uniform Inhibition of Transcription during Mitosis
It has been shown that in eukaryotes, gene transcription can be significantly inhibited during mitosis [18]. The impact of a global transcription inhibition of clock genes during mitosis on the circadian oscillator has been studied by modeling in [29]. In this study, the authors found that a periodic inhibition of transcription during one hour was able to entrain a model of the mammalian circadian clock, but only when the inhibition period was close to one half, twice or equal to the intrinsic circadian model period. In these cases, a phase locking between the circadian clock and the periodic inhibition was observed, albeit with one or two preferential circadian phases for the inhibition and values that varied greatly with the inhibition period. The discrepancies with the recent data could come from the short inhibition duration considered or from the arbitrarily parameterised model used for the circadian clock, taken from [30].
In [17], we also investigated the uniform inhibition of all clock genes and found that it was sufficient to reproduce the entrainment of the circadian clock by the cell cycle in period, but not in phase. The delay between MPF and RevErb-α remained inconsistent with the data, as depicted in Fig. 13, i.e. the mitosis triggered by MPF occurs just after the peaks of RevErb-α, while the experimental studies consistently report the opposite: peaks of RevErb-α 5-7 hours after divisions. Furthermore, it seemed impossible to find parameter val-ues to reproduce the observed delay under that hypothesis of a uniform inhibi-tion of transcripinhibi-tion during mitosis, which thus cannot explain the experimental data in mouse embryonic fibroblasts NIH3T3 measured in [14].
0 0.5 1 1.5 2 2.5 3 0 50 100 150 200 MPF RevErb::nucl
Figure 13: Entrainment to a period around 21.3 hours with kampf = 3.75 corresponding to a medium enriched with 10% FBS, found in [17].
5. Conclusion
By hypothesizing a selective activation of RevErb-α or a selective inhibition of Bmal1 triggered at the beginning of mitosis, we have been able to build a mechanistic dynamical model which reproduces the somewhat surprising nu-merical data reported in [13, 14] about the acceleration of the circadian clock observed in dividing fibroblasts with high FBS concentrations. These obser-vations suggest that the primary coupling between the cell division cycle and the circadian clock results from an influence of the cell cycle on the circadian clock in those cells. While considering a uniform inhibition of the transcription during mitosis [18] was shown to be sufficient to fit the period data in [17], the phase data reported in [14] seemed to be impossible to reproduce under that uniform inhibition hypothesis. The use of Biocham search algorithms for computing transcription inhibition parameters satisfying the period and phase observations formalized in quantitative temporal logic, led us to the hypothesis that around mitosis, either the transcription of RevErb-α has to be strongly activated, or Bmal1 strongly inhibited with no inhibition of RevErb-α. These two hypotheses differ by their predictions on slow cell cycle cells, possibly ob-tained with low levels of FBS, but for which no quantitative data are currently
available.
Since α is a repressor of Bmal1 and Bmal1 an activator of RevErb-α, these two hypotheses correspond to two alternative mechanisms for a similar effect. Interestingly, an experimental study investigating the translational land-scape of dividing cells reported an up-regulation of RevErb-α translation during the M phase [28].
This is one reason to favour this hypothesis. Furthermore, the activation of RevErb-α might be caused by various mechanisms [31]. For instance, the transcription factor c-Myc displays bursts of transcriptional activity during G1 phase just after mitosis and the S to G2/M transition of the cell cycle [32]. The c-Myc protein regulates its target genes through the same E-box DNA response element as the Clock/Bmal1 heterodimer. It is therefore conceivable that during the G2/M phase of the cell cycle, RevErb-α is positively regulated by c-Myc leading to the transcriptional repression of Bmal1 [33]. In this scenario the E-box regulated Per and Cry genes are expected to be also up-regulated by the higher transcriptional activity of c-Myc. This is compatible with our simulations which show that the phase and period are resilient to variation of the coefficient synthesis for Per and Cry. An additional potential link between RevErb-α and the cell cycle machinery is provided by the recent observation that the Cyclin B-CDK complex can phosphorylate RevErb-α [34].
Our model also postulates a different interpretation of some of the results presented in [14] when cells are treated by a 2 hours pulse of dexamethasone. Indeed, instead of different autonomous cycling regimes, the model predicts temporary perturbations leading to shorter or longer peak-to-peak distances, but returning to the previous entrainment regime after some time, longer than the horizon used in the experiments.
Furthermore, in our coupled model, the phases between some of the clock gene products are shifted when entrained by a fast cell cycle. We are able to quantify these phase shifts and show that they concern mainly RevErb-α whose mRNA peaks are advanced by the periodic activation during mitosis. Other clock mRNAs and proteins are slightly delayed compared to their activator
Bmal1. A prediction of the model is therefore that in quickly dividing cells, these protein peaks are shifted with respect to quiescent cells where such a phenomenon should not be observed.
Acknowledgements.
This work has been partially funded by the ANR HyClock project (ANR-14-CE09-0011), ANR “Investments for the future” LABEX SIGNALIFE program (ANR-11-LABX-0028-01) and the former ERASysBio+ C5Sys project (ANR grant 2009-SYSB-002-02). This work was also granted access to the HPC re-sources of the CINES under the allocation c2015036437 made by GENCI.
References
[1] C. L. Partch, C. B. Green, J. S. Takahashi, Molecular architecture of the mammalian circadian clock, Trends Cell Biol. 24 (2) (2014) 90–99. [2] T. Matsuo, S. Yamaguchi, S. Mitsui, A. Emi, F. Shimoda, H. Okamura,
Control mechanism of the circadian clock for timing of cell division in vivo, Science 302 (5643) (2003) 255–259.
[3] J. W. Barnes, S. A. Tischkau, J. A. Barnes, J. W. Mitchell, P. W. Bur-goon, J. R. Hickok, M. U. Gillette, Requirement of mammalian timeless for circadian rhythmicity, Science 302 (5644) (2003) 439–442.
[4] K. ¨Unsal-Ka¸cmaz, T. E. Mullen, W. K. Kaufmann, A. Sancar, Coupling of human circadian and cell cycles by the timeless protein, Molecular and Cellular Biology 25 (8) (2005) 3109–3116.
[5] A. Ballesta, S. Dulong, C. Abbara, B. Cohen, A. Okyar, J. Clairam-bault, F. Levi, A combined experimental and mathematical approach for molecular-based optimization of irinotecan circadian delivery, PLOS Com-putational Biology 7 (9).
[6] E. De Maria, F. Fages, A. Rizk, S. Soliman, Design, optimization, and predictions of a coupled model of the cell cycle, circadian clock, dna repair
system, irinotecan metabolism and exposure control under temporal logic constraints, Theoretical Computer Science 412 (21) (2011) 2108–2127. [7] E. Nagoshi, C. Saini, C. Bauer, T. Laroche, F. Naef, U. Schibler,
Circa-dian gene expression in individual fibroblasts: cell-autonomous and self-sustained oscillators pass time to daughter cells., Cell 119 (2004) 693–705. [8] A. Gr´echez-Cassiau, B. Rayet, F. Guillaumond, M. Teboul, , F. De-launay, The circadian clock component bmal1 is a critical regulator of p21WAF1/CIP1 expression and hepatocyte proliferation, J Biol Chem 283 (2008) 4535–4542.
[9] S. Gery, N. Komatsu, L. Baldjyan, A. Yu, D. Koo, H. Koeffler, The cir-cadian gene per1 plays an important role in cell growth and dna damage control in human cancer cells, Mol Cell 22 (2006) 375–382.
[10] C. G´erard, A. Goldbeter, Entrainment of the mammalian cell cycle by the circadian clock: Modeling two coupled cellular rhythms, PLoS Comput Biol 8 (21) (2012) e1002516.
[11] L. Calzone, S. Soliman, Coupling the cell cycle and the circadian cycle, Research Report 5835, INRIA (Feb. 2006).
[12] L. Glass, Synchronization and rhythmic processes in physiology, Nature 410 (6825) (2001) 277–84.
[13] J. Bieler, R. Cannavo, K. Gustafson, C. Gobet, D. Gatfield, F. Naef, Ro-bust synchronization of coupled circadian and cell cycle oscillators in single mammalian cells., Molecular systems biology 10 (7) (2014) 739.
[14] C. Feillet, P. Krusche, F. Tamanini, R. C. Janssens, M. J. Downey, P. Mar-tin, M. Teboul, S. Saito, F. L´evi, T. Bretschneider, G. T. J. van der Horst, F. Delaunay, D. A. Rand, Phase locking and multiple oscillating attractors for the coupled mammalian clock and cell cycle., Proceedings of the Na-tional Academy of Sciences of the United States of America 111 (27) (2014) 9928–9833.
[15] A. Rel´ogio, P. O. Westermark, T. Wallach, K. Schellenberg, A. Kramer, H. Herzel, Tuning the mammalian circadian clock: robust synergy of two loops., PLoS computational biology 7 (12) (2011) e1002309.
[16] Z. Qu, W. R. MacLellan, J. N. Weiss, Dynamics of the cell cycle: check-points, sizers, and timers, Biophysics Journal 85 (6) (2003) 3600–3611. [17] P. Traynard, F. Fages, S. Soliman, Model-based investigation of the effect
of the cell cycle on the circadian clock through transcription inhibition during mitosis, in: O. Roux, J. Bourdon (Eds.), CMSB’15: Proceedings of the thirteenth international conference on Computational Methods in Systems Biology, Vol. 9308 of Lecture Notes in BioInformatics, Springer-Verlag, 2015, pp. 208–221.
[18] D. Weisenberger, U. Scheer, A possible mechanism for the inhibition of ribosomal RNA gene transcription during mitosis, Journal of Cell Biology 129 (3) (1995) 561–575.
[19] L. Calzone, F. Fages, S. Soliman, BIOCHAM: An environment for modeling biological systems and formalizing experimental knowledge, Bioinformatics 22 (14) (2006) 1805–1807.
[20] F. Fages, P. Traynard, Temporal logic modeling of dynamical behaviors: First-order patterns and solvers, in: L. F. del Cerro, K. Inoue (Eds.), Log-ical Modeling of BiologLog-ical Systems, John Wiley & Sons, Inc., 2014, Ch. 8, pp. 291–323.
[21] P. Traynard, F. Fages, S. Soliman, Trace simplifications preserving tempo-ral logic formulae with case study in a coupled model of the cell cycle and the circadian clock (best student paper award), in: CMSB’14: Proceedings of the twelth international conference on Computational Methods in Sys-tems Biology, no. 8859 in Lecture Notes in BioInformatics, Springer-Verlag, 2014, pp. 114–128.
[22] A. Rizk, G. Batt, F. Fages, S. Soliman, Continuous valuations of temporal logic specifications with applications to parameter optimization and robust-ness measures, Theoretical Computer Science 412 (26) (2011) 2827–2839. [23] A. Rizk, G. Batt, F. Fages, S. Soliman, A general computational method
for robustness analysis with applications to synthetic gene networks, Bioin-formatics 12 (25) (2009) il69–il78.
[24] A. Sakaue-Sawano, H. Kurokawa, T. Morimura, A. Hanyu, H. Hama, H. Osawa, S. Kashiwagi, K. Fukami, T. Miyata, H. Miyoshi, T. Imamura, M. Ogawa, H. Masai, A. Miyawaki, Visualizing spatiotemporal dynamics of multicellular cell-cycle progression, Cell 132 (3) (2008) 487–498.
[25] C. Feillet, G. T. J. van der Horst, F. Levi, D. A. Rand, F. Delaunay, Coupling between the circadian clock and cell cycle oscillators: Implication for healthy cells and malignant growth, Frontiers in Neurology 6 (May) (2015) 1–7.
[26] F. Fages, A. Rizk, On temporal logic constraint solving for the analysis of numerical data time series, Theoretical Computer Science 408 (1) (2008) 55–65.
[27] S. Yoo, S. Yamazaki, P. Lowrey, K. Shimomura, C. Ko, E. Buhr, S. Siepka, H. Hong, W. Oh, O. Yoo, M. Menaker, J. Takahashi, PE-RIOD2::LUCIFERASE real-time reporting of circadian dynamics reveals persistent circadian oscillations in mouse peripheral tissues, PNAS (2004) 5339–5346.
[28] C. R. Stumpf, M. V. Moreno, A. B. Olshen, B. S. Taylor, D. Ruggero, The translational landscape of the mammalian cell cycle, Molecular Cell 54 (4) (2013) 574–588.
[29] B. Kang, Y.-Y. Li, X. Chang, L. Liu, Y.-X. Li, Modeling the effects of cell cycle m-phase transcriptional inhibition on circadian oscillation, PLoS Comput Biol 4 (3) (2008) e1000019.
[30] J.-C. Leloup, A. Goldbeter, Toward a detailed computational model for the mammalian circadian clock, Proceedings of the National Academy of Sciences 100 (2003) 7051–7056.
[31] P. Loyer, J. H. Trembley, R. Katona, V. J. Kidd, J. M. Lahti, Role of CD-K/cyclin complexes in transcription and RNA splicing, Cellular Signalling 17 (9) (2005) 1033–1051.
[32] A. Seth, S. Gupta, R. J. Davis, Cell cycle regulation of the c-Myc tran-scriptional activation domain, Molecular and cellular biology 13 (7) (1993) 4125–4136.
[33] B. J. Altman, A. L. Hsieh, A. Sengupta, S. Y. Krishnanaiah, Z. E. Stine, Z. E. Walton, A. M. Gouw, A. Venkataraman, B. Li, P. Goraksha-Hicks, et al., MYC disrupts the circadian clock and metabolism in cancer cells, Cell metabolism 22 (16) (2015) 1009–1019.
[34] X. Zhao, T. Hirota, X. Han, H. Cho, L. W. Chong, K. Lamia, S. Liu, A. R. Atkins, E. Banayo, C. Liddle, R. T. Yu, J. R. Yates, S. A. Kay, M. Downes, R. M. Evans, Circadian Amplitude Regulation via FBXW7-Targeted REV-ERBα Degradation, Cell 165 (7) (2016) 1644–1657.
![Figure 1: Schema of the cell cycle model of Qu et al. [16]. Solid arrows represent biochemical reactions while dashed arrows denote enzyme catalysis](https://thumb-eu.123doks.com/thumbv2/123doknet/13523050.417171/12.918.264.649.706.859/figure-schema-solid-arrows-represent-biochemical-reactions-catalysis.webp)