HAL Id: hal-02588929
https://hal.inrae.fr/hal-02588929
Submitted on 15 May 2020HAL is a multi-disciplinary open access
archive for the deposit and dissemination of sci-entific research documents, whether they are pub-lished or not. The documents may come from teaching and research institutions in France or abroad, or from public or private research centers.
L’archive ouverte pluridisciplinaire HAL, est destinée au dépôt et à la diffusion de documents scientifiques de niveau recherche, publiés ou non, émanant des établissements d’enseignement et de recherche français ou étrangers, des laboratoires publics ou privés.
den Wyngaert, P. Koundouri, E. Moors, A. Olsthoorn
To cite this version:
S. Schmidt, D. Inman, E. Preziosi, S. Loubier, K. Tarnacki, et al.. Integrated water balance models for water stress. Aquastress D2.3.1 - Final Report. irstea. 2006, pp.42. �hal-02588929�
A
QUA
S
TRESS
Mitigation of Water Stress through new Approaches to Integrating Management,
Technical, Economic and Institutional Instruments
Integrated Project
2.3.1
D
ELIVERABLE:
I
NTEGRATED WATER BALANCE MODELS FOR WATER STRESSDue date: 31-08-06 (M19)
Actual submission date: 19-09-06
Start date of project: 01-02-05 Duration: 48 months Deliverable Lead contractor:
(Organisation name) University of Osnabrück
Participant(s) (Partner short names) USF, IRSA, ALTERRA, CEMAGREF, CRANFIELD, RWTH, CEH
Author(s): Sonja Schmidt, David Inman, Elisabetta Preziosi, Sebastien Loubier, Katharina Tarnacki,
María Máñez
, Isabel van den Wyngaert Phoebe Koundouri, Eddy Moors Ad OlsthoornContact for queries:
Sonja Schmidt
E: sschmidt@usf.uni-osnabrueck.de Dissemination Level (
PUblic,
Restricted to other Programmes
Participants, REstricted to a group
specified by the consortium,
COnfidential only for members of the
consortium
):PU
Deliverable Status: Final
CemOA
: archive
ouverte
d'Irstea
Doc Name: Deliverable ID: D2.3-1 doc
Date: 19/9/2006
Dissemination level: PU – final report
2
AQUASTRESS... 1
1. Introduction ... 3
1.1 Objective of the report... 3
1.2 Working procedure ... 3
2. Water balance model ... 5
2.1 Objective of the water balance model... 5
2.2 Characterization of the water balance model... 5
2.2.1 Summary of milestone 2.3-1 ... 5
2.2.2 Water balance approach ... 6
2.2.3 Sub systems of the WBM... 7
2.3 Representation of WBM... 9
3. Assessment of water stress ... 10
3.1 Definitions... 10
3.2 Water resources assessment ... 11
3.3 Principle of assessing water stress ... 13
3.4 Water stress in a test site... 13
4. Industrial sector ... 17
4.1 Industrial branches in general... 17
4.1.1 Water cycle of industrial branches ... 17
4.1.2 Industrial water demand... 18
4.1.3 Industrial water stress ... 20
4.1.4 Industrial waste water ... 21
4.2 Tourist branch ... 22
4.2.1 Tourist water demand ... 22
4.2.2 Tourist water stress... 23
4.2.3 Tourist waste water ... 23
5. Domestic sector ... 24
5.1 Water cycle in the domestic sector... 24
5.2 Domestic water demand... 25
5.3 Domestic water stress ... 27
5.4 Domestic waste water... 27
6. Agricultural sector ... 29
6.1 Water cycle of the agricultural sector... 29
6.2 Agricultural water demand... 31
6.2.1 Water demand of livestock... 31
6.2.2 Irrigation water demand ... 31
6.3 Agricultural water stress ... 35
7. (Semi-)natural ecosystems ... 36
7.1 Water cycle in (semi-) natural ecosystems ... 36
7.2 Water demand of (semi-) natural ecosystems ... 36
7.3 Waste water in the environment... 37
7.4 Water stress of (semi-)natural ecosystems... 37
8. Concluding remarks ... 39 9. References... 41 CemOA : archive ouverte d'Irstea / Cemagref
Doc Name: Deliverable ID: D2.3-1 doc
Date: 19/9/2006
Dissemination level: PU – final report
3
1. Introduction
1.1
Objective of the report
This paper is based on the report Milestone 2.3_1 of the Aquastress project, which presented an inventory of examples of water balance models and gave a list of criteria to characterise hydrological models. The objective of this deliverable is:
• to describe the concept of the Water Balance Model (WBM) of Work block 2 (WB 2) of the Aquastress project and
• to describe how the so-called “simplified” water stress assessment is carried out in all the sectors (industrial, agricultural, domestic, tourist and environmental sector) at a test site and in neighbouring areas. In what follows, the environmental sector will be referred to as
(semi-)natural sector.
In the WBM the water stress definition of WB 2 has been used (compare with chapter 3). The assessment of water stress by the WBM is simplified compared to the water stress matrix of WB 2 because it does not incorporate all aspects of water stress which are listed in the definition of WB 2. Thus the WBM does the “simplified water stress assessment” based on water fluxes and water quality, whereas the water stress matrix takes also into account the adaptability of the test site to cope with water stress (compare with chapter 3).
Water balances and/or water balance models can be established for different spatial scales (Molden, 1997). In general, the objective of the water balance model changes according to the spatial scale. It is important to be aware of the advantages and disadvantages of dealing with water stress situations at different spatial scales: the higher the spatial scale, the broader the examination and the larger the number of issues involved, but also, the less detailed in time and space. On a regional (or broad or macro) level a basin or a sub-basin is covered and several uses of water are examined. On a local (or meso or middle) level the water balances deal with service levels such as irrigation or municipal water services. On a site specific (or micro or small) level, the water balance examines for example an agricultural field, a single household or a natural habitat related to a specific water resource. The WBM of Aquastress provides a useful framework to characterise simplified water stress on a regional level. Molden (1997) states that in spite of the limitations of dealing with a regional level, particularly in terms of data availability and uncertainty in systems representation, experience has shown that even a gross estimate of water balances for use in water accounting can be quite useful to managers, farmers, and researchers. In the WBM simplified water stress is assessed in so called “sectors”. The industrial (including tourist), domestic and agricultural sectors comprise calculations of water devoted to human consumption, whereas the environmental sector comprises water needed to sustain the (semi-)natural ecosystems.
1.2 Working
procedure
The WBM is being developed in close cooperation with projects partners in WB 2. The software which is used to run the WBM as well as the first ideas on the concept was presented during a meeting of WB 4 in Delft in February 2006. CemOA : archive ouverte d'Irstea / Cemagref
Doc Name: Deliverable ID: D2.3-1 doc
Date: 19/9/2006
Dissemination level: PU – final report
4
The (semi-)natural sector was discussed with partners from ALTERRA during a meeting in Wageningen in February 2006. In March 2006 the integration of hydrological data was worked out with the partners of the IRSA in Rome. Since December 2005, an exchanges as well as discussions during WB 2 and project meetings were used to elaborate the concept of the agricultural and the domestic sector in cooperation with partners from Cemagref and the University of Cranfield. The concept around the industrial sector was elaborated in cooperation with partners of the University of Aachen during a meeting in Dortmund in May 2006. During the meeting of the joint working team for the case study of Morocco first contacts to one of the test sites teams were established to coordinate future working steps, particularly to validate the calculations of the WBM for a test site.
Besides, the WBM was presented during WB 2 meetings to all work block partners in Osnabrück in December 2005 and in Wallingford in April 2006. This aimed at discussing and agreeing on the concept and the objective of the model and on coordinating activities within WB 2, especially with the development of the indicators for the water stress matrix.
In the future, the WBM will be applied to selected test sites. It is intended to use the WBM of WB 2 and to link it to an agent-based model of WB 3, which will be mainly applied in the Moroccan test site. The WBM will be tested together with stakeholder as well. The major challenge of the WBM will be to represent the water flows of the test site, which is on one hand simplified enough to avoid data-intensive calculations, but that on the other hand provides robust results to characterise water stress. Thus it is very important to validate the WBM in selected test sites.
CemOA
: archive
ouverte
d'Irstea
Doc Name: Deliverable ID: D2.3-1 doc
Date: 19/9/2006
Dissemination level: PU – final report
5
2.
Water balance model
2.1
Objective of the water balance model
The most important objective of the WBM is to assess water stress in different sectors at test site level based on a simplified version of water stress than the water stress matrix. As part of WB 2 it aims at characterising water stress by identifying causes of water stress and interdependencies between the sub-systems (e.g. interdependencies between several water users), and to understand cause and effects. The objective of the WBM is neither to provide future scenario calculation nor to exactly predict the state and quality of water resources on the test site. The main objective of the WBM is to stimulate a discussion on causes of water stress and on cause and effect relationships. The WBM is built to support an understanding of the complex system of water resources and water users in an area under investigation for the layperson. The main challenge is to simplify reality and incorporate local expert knowledge in such a way that crucial elements remain meaningful and that characteristics are still included without forcing the user to go into hydrological details.
The simplified assessment of water stress is based on a comparison of physical units: water resources and water demand (compare chapter 3). In contrast to the water stress matrix, the assessment of simplified water stress of the WBM is restricted to water flows to and from sectors. It does not include for example, the ability of a test site to adapt to the situation or to the institutional setting. The WBM does neither aim at predicting future development nor at assessing water mitigation options although it may assist in identify potential ones.
The WBM focuses on a selection of the components of the water cycle: precipitation, groundwater, surface water and water abstraction. Water imports and diversions are considered as well. The objective of the model is not to calculate unknown components of the water cycle or to predict future development. The approach used in the WBM aims at incorporating knowledge about factors
determining water demand of different sectors and at estimating the impact of water abstraction on water resources.
The linkages between different sub systems, like water demand of an irrigation perimeter and water abstraction from natural water resources are made explicit. Calculations used to describe
interdependencies are mainly based on allocation rules. Network or transition parameters are used to implement allocation rules. They serve to calculate unknown inflows or outflows of single sub systems. For example, in the industrial sector the state of the art of an industrial branch is defined. Depending on the classification in one of the three categories (high, middle or low), the water demand changes. Thus changes in the input and/or output flow of sub systems affect the assessment of water stress in neighbouring elements.
2.2
Characterization of the water balance model
2.2.1
Summary of milestone 2.3-1
The WBM is primarily designed to function at a regional scale. The definition of the spatial boundaries is based on both administrational and hydrological criteria. The former determines the extent of the management area and the availability of information, and the latter, the functional limits of the water cycle. The possibility of a mismatch between these two criteria certainly exists, but this
CemOA
: archive
ouverte
d'Irstea
Doc Name: Deliverable ID: D2.3-1 doc
Date: 19/9/2006
has to be resolved on a case by case basis, depending on the quality and availability of information, and on the main interests.Within the general model there are subsystems that influence each other. The spatial structure that determines the relationships between subsystems is implicitly considered, since a spatially explicit approach requires georeferenced data, which might not always be available. Thus, the WBM can be described as a one-dimensional structure or “column” that represents the entire modelling area. The WBM is based on relatively simple representation of the main water dynamics and water use processes of different sectors in order to estimate water demand characteristics of the system. A monthly basis for time resolution is consistent with the complexity of the modelled processes, the seasonality of life and water cycles, and with data availability.
Models could be classified as empirical, conceptual or theoretical according to the relationship they establish between input and output (Xu & Singh, 1998). The WBM is a combination of empirical and conceptual, which makes it less data intensive than a theoretical model and it can be more easily adapted to different test sites.
2.2.2
Water balance approach
Water balance approaches can be used for several goals. One of the most common uses focuses on estimating unknown parts of single water components of the water balance, which means a relatively stronger emphasis on water accounting and on understanding the functioning of a single system. Additionally, water balances can be used to examine the flows of water between several sub systems, by which the linkages and interdependencies between the water balance components become more important.
In general, the water balance approach is based on the purely physical law of the conservation of water mass for a given area within a defined period of time: water inflow equals water outflow plus storage change. Using a water balance approach to estimate one or more unknown sub systems assumes that enough elements of any significant magnitude are known, e.g. if precipitation and groundwater outflow are given, surface outflow could be calculated. Based on knowledge on the functioning of the system allocation rules might be included as well. Allocation rules describe how input and output flows are related. As an example for the simplest case, the input flow can be divided into two output flows depending on given percentages in mass. Allocation rules are derived from knowledge about the system itself and need to be examined before being implemented in a model.
water balance approach
allocation rules
Y
B=?
A
…if storages do not change… Z=X-Y?
B = 60%*A C= 40%*AZ=? C=?
X
Figure 1: Approaches to calculate input and output flows of a system
Dissemination level: PU – final report
6
CemOA
: archive
ouverte
d'Irstea
Doc Name: Deliverable ID: D2.3-1 doc
Date: 19/9/2006
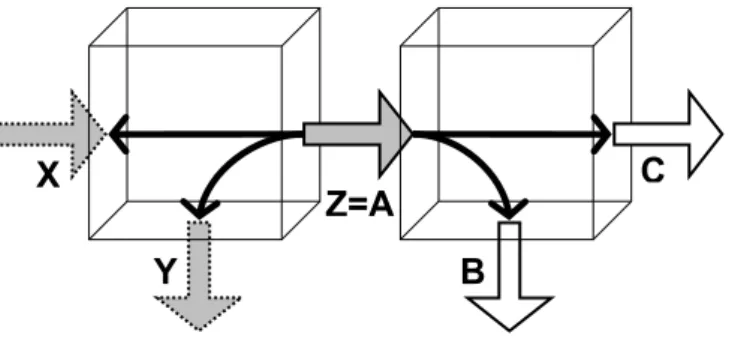
Problems occur if single sub systems of the water balance are difficult to measure or even difficult to estimate. As a result, the calculations remain questionable or unsure. To provide more robust results, water balance models therefore reduce the extent of the system under investigation in time and/or space. For example, instead of calculating the changes in the surface water flow in a river for a whole month only the changes in the surface water level of a river after a rainfall of a defined intensity is calculated.Using a water balance to make the interdependencies between subsystems explicit, it relies on the fact that, due to conservation of mass, changes in single sub systems of the water balance automatically have an impact on neighbouring sub systems in the amount and/or in the direction of flows (compare with Figure 2). This generally applies to all systems, whether they are built up of sub systems being defined by functional criteria like in the WBM, or by spatial criteria as in a grid. In most models the impacts of a selected sub system are transferred to neighbour sub systems following the flow of water. The WBM is able to represent effects in both directions, following the flow of water and against the flow of water, which is necessary to represent interdependencies.
This type of water balance model can be used, for example, to evaluate the effects of a dam on regional water resources. The building of the dam increases the storage capacity of the system. While filling the storage the outflow of the system is reduced and this might cause negative effects
downstream. Additionally it modifies the natural hydrological regime in the intra-annual period and might divert water from the former outward flow. Irrigation with surface water, for example, changes the flow direction of surface water which might cause negative effects such as the rising of the groundwater table and the reduction of the surface outflow downstream. Additionally, water use by human might affect the quality of water components.
Dissemination level: PU – final report
7
Figure 2: Effect of changes in input and output flows of a system on neighbouring sub systems
2.2.3
Sub systems of the WBM
The WBM focuses on a selected number of components of the water cycle. It aims neither at representing the complete water cycle nor at examining single components in detail.
Figure 3
represents all components of the water cycle and uses dotted text frames to indicate which components are included in the WBM. The dotted arrows indicate which relationships between water users and water resources are examined in the WBM.
Z=A
Y
C
B
X
CemOA : archive ouverte d'Irstea / CemagrefDoc Name: Deliverable ID: D2.3-1 doc
Date: 19/9/2006
The WBM performs a simplified water stress assessment in the selected sectors by comparing water supply and water demand of each sector. It links water users to water resources and includes factors affecting both the amount of available water as well as the water demand of a sector. The WBM focuses on the impact of human activities on the natural water resources. For example, it does not calculate the changes in the height of a groundwater table but it calculates storage changes in agroundwater aquifer by comparing inflow and outflow to the aquifer. The water abstractions of sectors as well as the disposal of used water or waste water of the sectors are also incorporated.
lake or dam evaporation evapotranspiration river evaporation precipitation precipitation groundwater soil seepage water run off sea industrial, agricultural, domestic sector groundwater water uses
Sub systems of the Water Balance Model
input and output flows
between sub systems of WBM water resources of WBM
Figure 3: Components of the natural water cycle and sub systems of the WBM
For the test site level the WBM considers the following components:
• as inflow: precipitation, trans-basin diversions, groundwater and river inflow, diversions • as storage change: both reservoir storage change and groundwater storage change • as outflow: river and groundwater outflow, diversions
For single sub systems additional inflows or outflows are examined. Evaporation and
evapotranspiration are not considered on the test site level because the WBM does not aim at balancing the whole water cycle. But for the agricultural sector evapotranspiration is calculated to estimate the water demand of irrigated agricultural areas. For the water supply networks water losses, both to soil and atmosphere, are estimated. Again, this is not done to do the water cycle calculation of the test site but to estimate water losses while supplying abstracted water to agriculture (compare with chapter 4ff).
Surface run-off is generally not included since the WBM is not spatially implicit but lumped. The amount of run-off is strongly depending on the type and duration of a precipitation event, on the soil characteristics, on land use and additional water inflow and the terrain slope.
Dissemination level: PU – final report
8
CemOA
: archive
ouverte
d'Irstea
Doc Name: Deliverable ID: D2.3-1 doc
Date: 19/9/2006
2.3 Representation
of
WBM
In the chapters 4ff the concept of the WBM is explained in detail for single sectors. Graphs show the structure of sub systems using boxes to represent places where water is used or modified and arrows to indicate the flow of water, pollutants and nutrients (Figure 4).
There are three different types of places defined. 1. Places with a number represent the so-called “set screws” which allow allocating outgoing water flows or changing the originating sources of an incoming water flow. For example, if a collective water supply network abstracts water from
groundwater and surface water the proportion of each source (e.g. groundwater 40% and surface water 60%) will be included in such an allocation place. In case water managers decide to change the proportion of a source, the allocation rules could be easily changed to e.g. 50% and 50%. 2. Places where water demand is calculated are indicated with a black frame. For example in the agricultural sector at least two places are defined to calculate water demand: irrigation perimeter and livestock. 3. Places without number and without dark frame represent the modification of water, e.g. a waste water treatment plant or the water supply network.
The arrows indicate the direction of material flow between places. In the WBM water and related materials – nutrients and pollutants – follow these arrows. The WBM generally includes water quality status. For example, information obtained from the literature and reports on the emission loads per capita per day are used to calculate the quality of waste water of the domestic sector. In case waste water is not treated and directly diverted into a surface water body, water stress might occur if thresholds are not met (compare with chapter 7). As a prerequisite thresholds for open surface water body have to be defined. The available amount of water for a test site can be cited as another example. Supplied water is considered to be available for a sector only if it meets the standards of a specific water use of a sector. This means that water of poor quality is not considered to be available and thus water availability of a sector might decrease if the water quality deteriorates.
An arrow includes all the materials flowing between two places. In general the flow direction and the material flow are known. If only one of them is known the arrow is represented by a dotted line to indicate a potential flow direction.
1
place where water demand is calculated place where water is used or modified place where water is allocated or managed flow direction
potential flow direction
Figure 4: Graphical representation of elements of the WBM
Dissemination level: PU – final report
9
CemOA
: archive
ouverte
d'Irstea
Doc Name: Deliverable ID: D2.3-1 doc
Date: 19/9/2006
Dissemination level: PU – final report
10
3.
Assessment of water stress
3.1 Definitions
The report is based on the definition of water stress elaborated in Work block 2 (compare with chapter 3.3) and on the following definitions mainly based on the European Environmental Agency:
• Water resources are defined by the amount of water flowing in rivers and in aquifers, originating either from local precipitation or by water received from neighbouring areas in transboundary rivers and aquifers (which equals to “renewable water resources” in EEA, 1999). This part of the definition is similar to the “natural renewable water resources” defined by World Resources Institute (2006) at the country scale, which states that: the sum of average annual flow of rivers and the recharge of groundwater (aquifers) generated from endogenous precipitation (occurring within the country’s borders), plus natural flows originating outside of the country. In the WBM additionally artificial water imports (diversions, desalination, etc.) are included.
• Water abstraction is the portion of the water resources that is physically removed from its natural site of occurrence (EEA, 1999).
• Water supply is the portion of abstracted water supplied to the domestic, agricultural, tourist and industrial sectors. The water supply does not automatically include water losses. In the WBM water losses during conveyance and distribution of water include evapotranspiration and leakage and are defined as water losses.
• Water losses (non-process depletion) is the amount of water removed from water resources which render unavailable for further use, e.g. water that evaporates from irrigations canals or seepage in a supply network due to leaks.
• Water consumption (process depletion) is the portion of the supplied water that remains in the sectors, e.g. water in agricultural products or water in industrial products. Benefits are derived from the use of this water.
• Return water is the fraction of water abstraction which is used and reintroduced into the natural water cycle, e.g. as discharge. Depending on the quality and quantity of the water the return water might affect the environment.
• Committed water is defined as the part of water which is reserved for other uses (Molden, 1997). Thus the definition of “committed water” requires that at least two water uses are defined and that water is allocated between these two water uses. In the case of the WBM sectors are defined as water uses.
• Sector water supply is the amount of water supplied to a single sector and intended to be used in that sector. This amount of water has been made available for a single sector. It is calculated by taking into account committed water as well as water losses of the water supply network. The amount of sector water supply depends on: the amount of water abstracted from the water resources, on the amount of water which is dedicated to other sectors, on upstream water users, on the losses of the supply network, and on the reuse of water within a sector. • Water demand is defined as the volume of water requested by users to satisfy their needs
(EEA, 1999). It does not automatically equal the amount of used water or the amount of supplied water. In the Aquastress project “user” is not restricted to human beings. The amount of required water is calculated for each sector. The water demand is a theoretical amount of water based on literature results, statistical data and/or on local expertise on water needs of different sectors. CemOA : archive ouverte d'Irstea / Cemagref
Doc Name: Deliverable ID: D2.3-1 doc
Date: 19/9/2006
Figure 5 shows the relationship among the above definitions of water. The sizes of the bars do not indicate a volume or proportion. It shows for example that a portion of abstracted water is lost while being supplied to a sector.water abstraction water supply
return water of sector X
evapo(transpi)ration remaining water
sector water supply ( for a sector X) committed water to other sectors than X water consumption
of sector X
water losses water resources
non abstracted water
Figure 5: Definition of terms
Water resources could be additionally divided into renewable and non-renewable or exploitable and non-exploitable resources. These subcategories are not used in the WBM because they require a further assessment of the water resources. The exploitability of water resources depend on the
technical level of infrastructure and/or on the financial power, as well as on the type of water resource. It might be difficult to assign water resources as being currently exploited, or as currently not
exploited but exploitable in the near future, or as exploitable in the future but not currently, due to a lack of infrastructure or investment.
3.2
Water resources assessment
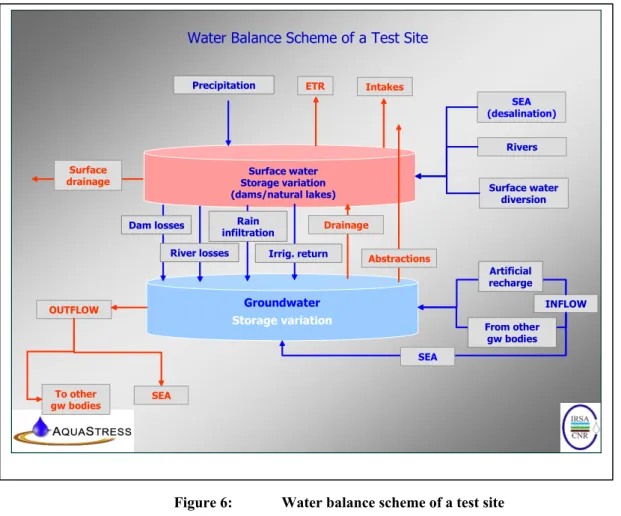
In order to perform an overall evaluation of the water resources for the test sites, the scheme shown in Figure 6 has been adopted. The upper cylinder represents the surface system, the lower one the aquifer/s. Possible “inputs” and “outputs” to the site are represented by blue and red arrows
respectively; exchanges between surface water and groundwater are also shown. The main aim of this evaluation is to establish how much water is actually available inside the boundaries of the site, due the water that naturally enters (as precipitation) the area, and then produces surface runoff or infiltrates to groundwater. It also accounts for the flow originating outside the site and available on the site (surface and groundwater), plus the water which is artificially imported from the neighbouring areas or produced by desalination. This scheme is used for the modelling of the (semi-)natural ecosystems. The test sites in the Aquastress project widely differ from both climatic and water uses point of view. The different situations analysed led us to design a very general scheme for the water balance, considering all the possible types of fluxes entering and exiting the test site, which results in the scheme of Figure 6. Inputs to the surface system are endogenous precipitation (feeding flow of rivers and the recharge of groundwater), the natural discharge of rivers entering the system, ground waters feeding springs and rivers (base flow) inside the area, artificial water imports (diversions, desalination, etc.). The outputs are all fluxes exiting the system, including the water consumed in any process. Surface waters can eventually infiltrate to the aquifers, hence they could still be part of the available resources. The fraction of the precipitation entering the surface system and then recharging the aquifers is to be considered obviously only once.
Dissemination level: PU – final report
11
CemOA
: archive
ouverte
d'Irstea
Doc Name: Deliverable ID: D2.3-1 doc
Date: 19/9/2006
While considering groundwater it is important to individuate whether the aquifers are completely included inside the boundaries of the site. If not, the boundaries of the underground system are “flow boundaries” and the volumes per time unit entering and leaving the system should be estimated. Obviously this is the same difficult task than in the case of a surface system. Moreover, the eventual exploitation of the upstream part of the aquifer should be taken into account. The volume of water resources common to both surface and groundwater (overlap) should not be counted twice. That is, contribution of aquifers to surface flow, recharge of aquifers by surface run-off should be accounted for only once.From a theoretical point of view the assessment of the water resources seems to be a simple task, just an algebraic sum of inputs and outputs. However difficulties arise in numbers inversely proportional to the size of the study area, as appropriate information seems to be more difficult to be obtained at the site scale than e.g. at the nation level. Evaluation of water resources at the country scale generally consider the natural internal endowment (usually estimated from precipitation rates or from river discharge data), plus the eventual flows coming from neighbouring areas, when not committed to other users. At the site scale (typically from tens to hundreds of square km) artificial diversions (importing or exporting water) are not negligible in relation to the primary endowment and should be assessed. While accounting for the renewable resources, time variability (at seasonal and interannual time scales) should be considered. As a general rule using annual averages to determine the available resource could be misleading, especially in river systems, as water availability naturally decreases during the dry seasons. Also, river surface runoff excess could be considered as a resource only when it is possible to store it (e.g. in natural or artificial basins) for later use. However, data on yearly averages are more often available than monthly or daily data. In the WBM monthly data are used when possible.
Dissemination level: PU – final report
12
Groundwater Storage variation ETR Irrig. return Precipitation Dam losses River losses INFLOW
Figure 6: Water balance scheme of a test site
Abstractions To other gw bodies Artificial recharge From other gw bodies OUTFLOW Surface water Storage variation (dams/natural lakes) SEA SEA Surface water diversion Surface drainage Intakes Rain infiltration
Water Balance Scheme of a Test Site
SEA (desalination) Rivers Drainage CemOA : archive ouverte d'Irstea / Cemagref
Doc Name: Deliverable ID: D2.3-1 doc
Date: 19/9/2006
3.3 Principles
of
simplified water stress assessment
The WBM is used to assess water stress in a test site. The definition of water stress refers to the Aquastress report D2.1-1, which was prepared during a WB 2 meeting in 2005. The definition states that water stress occurs when the functions of water in the system do not reach the standards (of policies) and/or perceptions (of the population) on an appropriate quantity and quality, at an appropriate scale; and the adaptability for reaching those standards is not given. Under “standard” should be understood the “level” needed for the whole ecosystem (understanding humans as a part of the ecosystem). Usually these standards are described by political bodies. Since ecosystems cannot talk, the political bodies for ecosystems would be NGOs or any scientific publication.
In WB 2 of the Aquastress project two approaches are used to assess water stress for the sectors on a test site: the water stress matrix and the water balance model. The water stress matrix is built on a couple of indicators to assess water stress in several sectors (Deliverable 2.1.-2, forthcoming). Then the matrix aggregates the results of the indicators to produce a water stress index. The water stress indicators take into account the ability of a sector to adapt to a water stress situation. As a result, water stress increases if a sector on a test site shows less ability to adapt to a given situation.
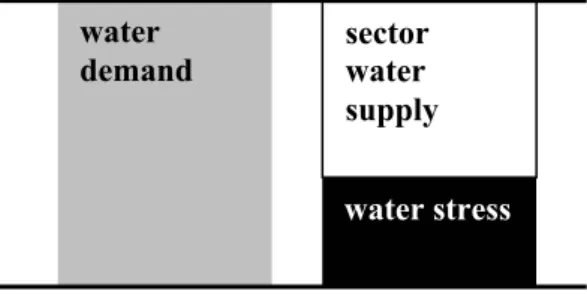
The WBM assesses water stress based on water flows and thus, it is simpler than the assessment of water stress in the water stress matrix. Water stress in a sector occurs if the water demand of the sector is higher than the sector water supply (Figure 7). Water stress increases if less water is available (e.g. because upstream water uses increase water abstraction) or if an increasing amount of water is required to fulfil the needs of a sector (e.g. because different crop pattern require more irrigation water; or a higher standard of living increases water demand of the domestic sector).
water demand sector water supply waterstress
Figure 7: Simplified water stress assessment based on a comparison between water demand and sector water supply
3.4
Water stress in a test site
Within a test site, water stress is calculated for the following sectors: domestic, agricultural, industrial (and tourist) and (semi-) natural ecosystem. The calculation is based on monthly data. The assessment of water stress is based on the assumption that the water demand of a sector does not correspond to the amount of water supplied to the sector (Figure 8).
Dissemination level: PU – final report
13
CemOA
: archive
ouverte
d'Irstea
Doc Name: Deliverable ID: D2.3-1 doc
Date: 19/9/2006
water abstraction (Wa) water supply (Ws) non abstracted water water resources (Wr) discharge of sector i losses (Wl)sector water supply for sector i
(Wseci)
water consumption of sector i
water stress of sector I
(W stressi)
committed water (Wcom) sector water supply sector i
(Wseci)
water demand of sector
(Wdi)
Figure 8: Definition of terms and relation between water flows and simplified water stress
The supplied water of the domestic, industrial, tourist and agricultural sector is calculated using the amount of abstracted water and subtracting water losses and water committed to other sectors.
So, for sector i:
W
seci=
W
a−
W
l−
W
comThe available water for the (semi-) natural ecosystems is calculated for each type as inflow from groundwater; surface water and precipitation (chapter7ff). It is not possible to calculate the remaining water or the non abstracted water which remains in the environment as available water because there are high uncertainties in determining all water resources in the test site, in estimating
evapotranspiration for the whole test site area, and in including run-off as inflow to surface water. For all sectors the water quality is considered while calculating sector water supply. Depending on the quality requirements of specific water use the amount of available water is reduced by the portion of water which does not meet the standards.
The water demand of the domestic, agricultural, tourist and industrial sectors are induced by human activities although e.g. plants in agriculture determine the water demand for irrigation or technical requirements determine the water demand of industrial units. If the WBM is applied to selected test sites, it is necessary to adapt the calculation of water demand to the needs of the sectors in the test site. It is also possible to include stakeholders` knowledge in the calculation of single components in order to make use of the local expertise. The water demand of the (semi)-natural ecosystem is estimated based on a classification of types of ecosystems and their average monthly evapotranspiration.
Dissemination level: PU – final report
14
CemOA
: archive
ouverte
d'Irstea
Doc Name: Deliverable ID: D2.3-1 doc
Date: 19/9/2006
In general the difference between sector water supply and water demand will indicate the severity of water stress in the sector: the larger the gap between water demand and sector water supply, the more water stress (Figure 9
). The example inFigure 9
shows the highest water stress in (semi-) natural ecosystem, followed by agricultural, domestic and tourist sector (size of black boxes inFigure 9
). The industrial sector does not show any water stress. The water stress of the test site is calculated by summing up the water stress results of all sectors.(semi-) natural
ecosystem agricultural sector industrial sector touristic sector
Dissemination level: PU – final report
15
Figure 9: Comparison of simplified water stress assessment based on factual analysis and including stakeholders’ weighting
The calculation of the water stress might include the stakeholders’ perception. Deriving from the stakeholder interviews the sensitivity of each sector towards water stress is included by weighting: the more sensitive a sector against water stress, the higher the weight (compare circles in
Figure 9
). The calculated water stress for each sector is multiplied with the stakeholders’ weight. Finally the total weighted water stress for the entire test sites is calculated as the sum water stress per sector. It is important to keep in mind that the weighting depends on the number and type of stakeholderinterviews and interpretation of these interviews. Thus, transferring weighted results to other test sites is not possible. water stress test site
stakeholders
domestic sector water stress tourist water stress domestic water stress agricultural water stressecosystem (no) water stress industial give weights to weighted water stress ecosystem weighted water stress tourist weighted water stress agricultural weighted water stress domestic weighted (no) water stress weighted water stress test site CemOA : archive ouverte d'Irstea / Cemagref
Doc Name: Deliverable ID: D2.3-1 doc
Date: 19/9/2006
Dissemination level: PU – final report
16
For interpretation it is possible to compare the weighted and unweighted simplified water stress results within a sector and the same test site. The comparison will reveal the difference between factual analysis and stakeholders` perception of water stress within a sector and for the whole test site. As example in Figure 9 water stress in the agricultural sector is perceived by the stakeholders as the highest in the test site although the calculation of supplied and required water flows results in the highest simplified water stress in the environmental sector. It is also possible to compare the water stress results of different sectors.
Water stress will be additionally calculated upstream and downstream of the test site. To assess water stress outside the test site, data on water abstraction downstream and upstream as well as the
committed water downstream and the water demand upstream are needed. If this information is not available the inflow to and the outflow from the test site do not take into account neighbouring effects.
CemOA
: archive
ouverte
d'Irstea
Doc Name: Deliverable ID: D2.3-1 doc
Date: 19/9/2006
4. Industrial sector
4.1 Industrial branches in general
The industrial sector is divided into “branches”. In the model description the tourist sector is considered as part of the industrial sector, although it might share the water infrastructure with the domestic sector and its water using habits resemble more the domestic rather than the industrial sector. The tourist sector is included in the industrial sector given its economic relevance on a test site. From the conceptual point of view, however, in the WBM, the tourist sector is treated as a sector of its own.
4.1.1
Water cycle of industrial branches
The industrial sector abstracts water from water resources using a central water supply network which might be shared with the domestic sector. Additionally water might be abstracted for individual industrial production units directly from surface water or groundwater in case private wells or reservoirs are operated by the industrial plant. The water demand is calculated for each of the industrial branches individually and might greatly differ.
collective water supply
network waste water treatment
leakage & evaporation
abstracted water supplied water waste water treated waste water reuse of waste water industrial sector reuse of waste water in other sectors industrial waste water to the environment
place where water demand is calculated place where water is used or modified
flow direction
individual water supply 1
environment agricultural sector
2 3 industrial branches (7) + tourist sector consumed water
1 place where water is allocated or managed
potential flow direction
Figure 10: Components of the water balance model of the industrial sector
Dissemination level: PU – final report
17
CemOA
: archive
ouverte
d'Irstea
Doc Name: Deliverable ID: D2.3-1 doc
Date: 19/9/2006
Dissemination level: PU – final report
18
The waste water flow is considered as well. Many industrial plants operate their own treatment plants, some only as pre-treatment before discharge to the sewerage and further treatment with municipal waste water (e.g. waste water from textile industry), and others with secondary treatment for the direct discharge to the rivers. Cooling water is often operated in closed-loop cycles with high recycling rates. Process water can also be recycled depending on the quality of the waste water and the requirements of a production unit. Additionally waste water could be reused in other sectors, e.g. water from hydro power plants could be used for irrigation.
Water stress in the industrial sector is evaluated in the following industrial branches: 1. iron and steel
2. textile
3. food and beverages 4. chemical/pharmaceutical 5. pulp and paper
6. energy 7. mining and 8. tourism.
4.1.2 Industrial
water
demand
The industrial water demand depends on the type of industry branch, the number and type of production units, the productivity, the cooling system, the energy consumption and the technical standard of the industrial plant (EEA, 1999). For the calculation of the water demand average numbers of some European countries are used assuming a high technical standard. According to the technical standard, each branch of the test site, could be classified as high, medium or low.
In the water balance model the following information is used to calculate the industrial water demand: portion of industrial plants of a specific branch in the test site area to total number of industrial
plants in test site area (in %)
productivity of industrial branch (in kg or l/month)
water demand of the industrial branch (in l/kg or l product) (water demand could be specified in l/product of different production units if possible)
assessment of the technical standard of the industrial branch (by stakeholder or expert) in high, medium or low. CemOA : archive ouverte d'Irstea / Cemagref
Doc Name: Deliverable ID: D2.3-1 doc
Date: 19/9/2006
Dissemination level: PU – final report
19
Table 1: Water demand of industrial branches
industrial water demand value (high standard) unit source
pulp and paper
pulp 200 150-400 l/kg Koppe, ATV, 1985 2006
paper 2-20 l/kg ATV, 1985
pulp and paper 30-500 l/kg EEA, 1999b
iron and steel
steel 50 65-130
l/kg Koppe, 2006
ATV, 1985
iron and steel 30-600 l/kg EEA, 1999b
food and beverage production
sugar fabric 30 5-10 l/kg sugar Koppe, 2006 ATV, 1985 tinned food 5-40 20-45 l/kg Koppe, 2006 ATV, 1985 beverage 1-15 l/l EEA, 1999b
chemical and pharmaceutical industry
synthetic 200-500 l/kg ATV, 1985
mining industry
hard coal 20-30 l/kg ATV, 1985
textile industry
textile 40-300 l/cloth EEA, 1999b
Table 2: Water demand of small trade
industrial water demand value (high standard) unit source
small trade
bakery 150 l/e*d Koppe, 2006
confectioner 200 l/e*d Koppe, 2006
butcher 250 l/e*d Koppe, 2006
coiffeur 200 l/e*d Koppe, 2006
laundry 40 l/kg cloths Koppe, 2006
slaughter house 5000 l/animal Koppe, 2006
market hall 30 l/m2 Koppe, 2006
e= employee d=day
The technical standard could be classified as high, medium and low either by stakeholder or experts. A high technical standard indicates lower water demand because resources are used more efficiently due to the use of innovative technologies. If the technical standard decreases, the water demand rises. The water demand is higher if the technical standard is low (often inefficient water use, leakages and other water losses). Based on the Best Reference Documents the values of the water demand in
CemOA
: archive
ouverte
d'Irstea
Doc Name: Deliverable ID: D2.3-1 doc
Date: 19/9/2006
Table 1 will be assumed for representing a high technical standard. According to the middle and low technical standard the values will be changed.consumed water: 0,295 m3/t sinter
actually supplied water: depending on the test site
waste water: 0,055 m3/t sinter
reuse of waste water &
emission load to the environment depend on: - technical standard
- requirements on the quality of the water
sinter plant: water demand 0,35 m3/t sinter
- treatment technology - water demand of the sector(s)
consumed water: 0,5 - 9 m3/t coke
waste water: 0,35 m3/t coke
emission load/1 t coke: 525 g phenols/1 t coke 373 kg COD/1 t coke 6,1 kg NH4/1 t coke
actually supplied water: depending on the test site
coke oven plant: water demand 0,8 - 10 m3/t sinter
Figure 11: Example of water demand and waste water of production units: sinter plant and coke oven plant (BREF on Iron and Steel, 2001)
Depending on the best available techniques, reference document on the production of iron and steel (BREF on Iron and Steel, 2001) the amount of waste water and the water demand of single production units could be estimated. It is assumed that these values refer to a high technical standard. The amount of consumed water could be estimated. The emission load per production unit will be calculated using the amount of waste water and the average emission content as the basis. The emission load will change depending on the technical standard. The concentration of the treated waste water is affected depending on the treatment technology
Currently the emission load of industrial sectors is not included in the WBM. Furthermore there is still a discussion if and how charges could be included in the WBM because they are relevant and have an impact on the amount of water used in different branches. While applying the WBM to a test site, the integration of waste water and the type of charges will be tested for a selected branch.
4.1.3 Industrial
water
stress
In order to assess water stress the industrial water demand is compared to the supplied water to the industrial sector. Water losses in the supply network are estimated. If the volume of water requested
Dissemination level: PU – final report
20
CemOA
: archive
ouverte
d'Irstea
Doc Name: Deliverable ID: D2.3-1 doc
Date: 19/9/2006
Dissemination level: PU – final report
21
by the industrial sector is higher than the supplied volume of water, then water stress occurs. Water stress is mitigated by
• reducing the water losses of the water supply network
• change of the cooling system (from wet to dry, from once-through to closed loop) • changing the portions of single industrial branches
• increasing the technical standard • application of cascade water use
• increasing the recycling rate within the plant (closing of water cycles).
The Deliverable D 2.1.3 of the Aquastress project includes further information on industrial water stress and could be used to get a more detailed picture about the industrial sector.
In the current version of WBM it is assumed that effects of water saving technologies and water recycling both are included in the technical standard. In case it is possible this assumption could be refined. If water is reused outside the industrial sector, this will be taken into account while evaluating the other sectors because they receive an additional input flow.
4.1.4
Industrial waste water
The waste water of the industrial sector is calculated based on the connection rate to a treatment plant, the emission loads of treated and untreated waste water. The emission load of each industrial branch is based on the BREF documents.
If values are not available, the emission load of treated waste water is estimated based on treatment thresholds.
Problems which might occur while applying this approach in a test site:
does the calculation of the water demand meet the characteristics of the test site? Is the water demand estimated “correctly” and how could this be evaluated?
how much water is actually supplied to the industrial sector and to each industrial branch? from which water resource is water abstracted for the industrial sector?
to whom is water delivered in priority? To the industrial sector or to others?
CemOA
: archive
ouverte
d'Irstea
Doc Name: Deliverable ID: D2.3-1 doc
Date: 19/9/2006
Dissemination level: PU – final report
22
4.2 Tourist
branch
The tourist branch abstracts water from the available water resources and uses the collective water supply system, which is mostly shared with the domestic sector. If a sewage system exists it always takes up the waste water of both the domestic sector and the tourist branch. Additionally water might be abstracted for single tourist facilities. The water demand is calculated for different types of tourism. Waste water might be treated or untreated. Reusing waste water is not taken into account but water saving technologies might be in use. Depending on the technical standard and the awareness of water stress problems, different options are considered.
The calculation of the tourist water demand is difficult, especially for the tourist infrastructure because there is a huge variety of different standards. Furthermore it is difficult to estimate the volume of water supplied to the tourist sector as the same network is used for the domestic and partly the industrial sector as well. In some areas already water saving technologies are in use but it is difficult to estimate the reduction potential of these mitigation options.
4.2.1 Tourist
water
demand
The tourist water demand is calculated for tourist infrastructure and for the tourists themselves. The water demand of tourist infrastructure depends on the percentage of tourist facilities with swimming pool and the surface area of irrigated tourist green area. The water demand of the tourists depends on the type of tourism (hotel, camping etc), the number of overnight stays and the duration of tourist season.
The tourist water demand is calculated based on the following operands: number of overnight stays in the tourist season per day
duration of the tourist period in days (indicating the months)
water demand of different types of overnight stays (including tourist infrastructure at the place itself, e.g. swimming pool at the hotel...) in l/type of overnight stay
water demand of tourist infrastructure depending on garden area: water demand of golf courses in l/m2 and period
water demand of parks in ...
Table 3: Example of water demand of tourist sector
tourist water demand value unit source
garden area, irrigated 0,1 l/m2*d Koppe, 2006
hotel, high standard (e:g > 1) 600 l/(g+e)*d Koppe, 2006 hotel, middle standard (e:g = 0,5) 375 l/(g+e)*d Koppe, 2006 hotel, low standard (e:g = 0,25) 150 l/(g+e)*d Koppe, 2006
swimming pool 200 l/g Koppe, 2006
restaurants 50 l/(g+e)*d Koppe, 2006
accommodation 200 l/overnight stay Haberl, 2006
guest house/tavern 15 l/g*d Haberl, 2006
e = employee, g = guest CemOA : archive ouverte d'Irstea / Cemagref
Doc Name: Deliverable ID: D2.3-1 doc
Date: 19/9/2006
Dissemination level: PU – final report
23
4.2.2 Tourist
water
stress
In order to assess simplified water stress the tourist water demand is compared to the supplied water to the tourist sector. Water losses are taken into account. If the volume of water requested by the tourist sector is higher than the supplied volume of water, then water stress occurs in the sector. Water stress is mitigated by reusing waste water or by using water saving technologies, by changing the tourist infrastructure or the type of tourism.
4.2.3 Tourist
waste
water
The waste water of the tourist sector is calculated according to the domestic sector. Depending on the number of overnight stays the emission load per capita and day is assumed (compare chapter 5ff).
CemOA
: archive
ouverte
d'Irstea
Doc Name: Deliverable ID: D2.3-1 doc
Date: 19/9/2006
5. Domestic
sector
5.1
Water cycle in the domestic sector
The domestic water cycle contains a collective and an individual water supply network. Both abstract water from natural water resources. In case the abstracted water does not meet the standards of drinking water a pre-treatment might be necessary. If the water resources do not meet the standards of drinking water, then water cannot be used from that specific source which might reduce the abstraction of water for domestic water use.
Depending on the age, maintenance and standard of the infrastructure there are water losses and additional water inflow within the supply network. Both are calculated in the WBM and linked to the collective water supply network as leakage and drainage. Supply interruptions reduce the amount of actually supplied water for households being connected to a collective supply network. In the WBM supply interruptions are included as percentage of time without connection compared to total time period of a month. Either a measured value or a rough estimation could be included.
collective water supply
network waste water
treatment leakage abstracted water supplied water waste water treated waste water reuse of waste water drainage precipitation reuse of waste water in other sectors domestic sector
domestic waste water to the environment
place where water demand is calculated place where water is used or modified
individual water supply 1 agricultural sector 2 3 settlement area
place where water is allocated or managed
1
environment
potential flow direction flow direction
Figure 12: Components of the domestic sector: input and output water flows of the domestic sector, allocation of water and places
Dissemination level: PU – final report
24
CemOA
: archive
ouverte
d'Irstea
Doc Name: Deliverable ID: D2.3-1 doc
Date: 19/9/2006
Dissemination level: PU – final report
25
Water demand and waste water is calculated for a settlement area. It is possible to define several settlement areas if necessary. The waste water flow to the environment depends on the percentage of household being connected to a sewage system, the percentage of the sewage system being connected to a waste water treatment plant and on the type of waste water treatment plant. The WBM assumes that if the technical standard is high, grey water is reused in the domestic sector and replaces water for toilettes. Rainwater harvesting is taken into consideration as well. Both options do not affect the calculation of the water demand but they change the flow of water in the sub system and are added to the amount of water from the supply network to the households.
5.2 Domestic
water
demand
The calculation of the domestic water demand is based on the calculation of the volume of water per capita and day related to different water uses (compare Table 4). It is assumed that these amounts of water are requested to fulfil the specific needs per person per day. The water demand is then
extrapolated to a monthly volume for a defined settlement area taking into account the number of inhabitants of this area and the percentage of persons requesting these water uses.
It is assumed that a minimum water demand of 25 l per capita per day is necessary to ensure cooking and personal hygiene (Kürschner-Pelkmann, 2003). The water demand increases depending on the following water uses for:
• dish wash • washing machine • toilette/bidet • shower/bath • car washing and
• irrigation of market garden.
Table 4: Example of water demand of domestic sector
domestic water demand value unit source
shower/bath 40 l/cap*day Kürschner-Pelkmann, 2003
toilette/bidet 42 l/cap*day Kürschner-Pelkmann, 2003
washing machine 18 l/cap*day Kürschner-Pelkmann, 2003
dish wash 8 l/cap*day Kürschner-Pelkmann, 2003
car washing 3 l/cap*day Kürschner-Pelkmann, 2003
garden area, irrigated 0,1 l/m2*day Koppe, 2006
The water demand for irrigating garden area depends on:
• percentage of inhabitants owning a garden around the house • duration of irrigation period (days per month)
• size of surface area for gardening (m2 of irrigated garden area per household).
The WBM includes five rules to refine the calculation of water demand. They all could be applied at the same time and the calculation considers the combination of rules.
CemOA
: archive
ouverte
d'Irstea
Doc Name: Deliverable ID: D2.3-1 doc
Date: 19/9/2006
In the WBM two types of standard of living – high and normal – are defined. The classification of high and normal standard of living needs to be fixed according to the characteristics of the test site and the discussion with stakeholder. If a percentage of persons with a high standard of living is included, the portion of persons with a normal standard of living is automatically calculated. Otherwise, it is assumed that all households show a normal standard of living. It is assumed that persons with a higher standard of living are more likely not to react on a water tariff supporting the polluter-pays-principle (Figure 12). Secondly, the reuse of waste water and the reuse of rainwater for toilettes require additional investment, which is probably only affordable for those with a higher standard of living. Thus both options only affect the water demand of a household with a high standard of living. Finally, it is assumed that due to a higher standard of living more water (+ 20%) is used to fulfil the domestic water needs.If standard of living is normal and …
If standard of living is high, then water demand for all water uses increases 20%
and…
toilette
…and it replaces water for toilette.
car
garden irrigation system
If rainwater harvesting exists, then it replaces irrigation…
shower/bathtub
If waste water is reused, then it replaces water for toilette.
If water tariff is based on polluter-pays-principle, no water is used for car washing and irrigation.
washing machine
dish washer If water saving technologies
are available, then water demand is reduced between 20 to 50%.
Figure 13: Rules included in the calculation of domestic water demand
In the literature there is a discussion on the effects of water tariff on the habits of water use (an overview is provided in Koundouri, 2006). In the WBM two types of water tariffs are distinguished: tariffs that support polluter-pays principle and tariffs that do not support the polluter-pays principle. If either an individual household metering exists or a split between access charge and volumetric charge is introduced, the water tariff is assumed to support the polluter-pays principle.
In the WBM it is assumed that water for irrigation and car washing declines depending on the percentage of inhabitants paying a tariff supporting the polluter-pays principle. Water used to fulfil basic needs is not affected by the type of water tariff (Grobosch, 2003). Persons with a high standard of living will not change their habits for irrigation and car washing (Gordon-Walker and Marr, 2002, Ernst and Schulz, 2005; Martinez-Espineira, 2002; Martinez-Espineira & Nauges, 2004). In the literature it is argued that such tariffs might increase the number of persons using water saving technologies in the future, but as this may have a long-term effect, it is not included in the WBM.
Dissemination level: PU – final report
26
CemOA
: archive
ouverte
d'Irstea
Doc Name: Deliverable ID: D2.3-1 doc
Date: 19/9/2006
Dissemination level: PU – final report
27
Making use of water saving technologies reduces the water demand because less water is necessary to fulfil a specific need. It is assumed that 20% of the water demand is reduced for dish wash and washing machine and 50% less for toilettes and bathing (Londong et al, 2004). This applies to both types of standard of living.
Reusing waste water does not reduce the water demand because the same amount of water is requested for a specific need, but as water is used several times, less water is requested from the supply network or more water is available within the sector. As the reuse of waste water depends on treatment
technology it is assumed that only persons with a high standard of living can afford to implement reusing technologies. The water demand might be reduced for toilettes up to 25%.
Rainwater harvesting, does not reduce the water demand either. It only satisfies the water requirements by abstracting water from a different water source. Thus it only reduces the amount of water that has to be supplied by a collective water supply network. If the percentage of households with rainwater harvesting increases it is assumed that it is used to replace irrigation water. If the water demand for toilettes and irrigation is fulfilled by rainwater, again this applies only to households with a high standard of living because it is necessary to invest in household infrastructure. In all cases replacing drinking water or water from the supply network is limited to the volume of the rainwater collection tank and precipitation. The WBM calculates the amount of collected rainwater and replaces water from the collective or individual supply system depending on the amount of collected rainwater.
5.3 Domestic
water
stress
In order to assess domestic water stress, water demand is compared to the actually supplied water to the domestic sector taking into account all water inputs and water losses. If the volume of water requested by the domestic sector is higher than the supplied volume of water, water stress occurs. Water stress could be mitigated amongst others by
• reducing the water losses of the water supply network
• supporting water saving technologies if the standard of living is high • changing the water tariff
• reusing water within the domestic sector if the standard of living is high • not allowing irrigation during dry periods.
5.4
Domestic waste water
The amount of waste water depends on the water used in the households. The water inflows to the settlement area are summed up to the amount of waste water.
The quality of the waste water depends on the number of inhabitants in the settlement area and on the amount of waste water. It is assumed that a given emission load per capita per day is produced (compare Table 5) and diluted by the amount of water used in the settlement area.
CemOA
: archive
ouverte
d'Irstea