ECONOMIC FAC TORS OF RICHMOND, VIRGINIA
by
Garland A. Wood
B. S., Virginia Polytechnic Institute, 1934 M. L. A., Harvard University, 1939
Submitted in Partial Fulfillment of the
Requirements for the Degree of
Master in City Planning at the
Massachuse tts Institute of Technology
1947
Signature of Author:
Division of City Planning, January 17, 1947
3 Certified by:
Head of the Division of City Planning
MASSACHUSETTS INSTITUTE OF TECHNOLOGY Cambridge, Massachusetts
January 17, 1947
Dean William W. Wurster
School of Architecture and Planning Massachusetts Institute of Technology Cambridge, Massachusetts
Dear Dean Wurster:
I herewith respectfully submit this thesis entitled "Economic Factors of Richmond, Virginia", in partial fulfillment of the
requirements for the degree of Master in City Planning.
Respectfully,
TABLE OF CONTENTS
Page
Foreword 1
Introduction 2
National and Regional Economic Factors that
Relate to Richmond 10
Physical Factors 10
Land Resources 10
Climate ,l
Power Resources 14
Other Mineral Resources 21
Agricultural Production 27
Transportation
34
Taxation
69
Construction
74
Salary-Wage
78
Markets and Trade 82
II The Economic Base of Richmond 87
Dates of Important Factors Affecting
the Development of Richmond 87
Economic Background Rating
93
Trends in Each Source of Employment
96
TABLE OF CONTENTS, Continued
Page III Richmond's Ability to Compete With Other
Cities and Regions 117
Trends that Affect the Economics of
Richmond 117
Comparisons of Local Production and
Distribution Costs 121
Location of New Industries in Richmond 127
Number of Diversified Manufactories 128
Financial Service 131
Living and Cultural Environment 133
IV Conclusions
V Recommendations 144
1
FOREWORD
The factors discussed here attempt to determine the
underlying economic basis for the present and future
development of Richmond. Before planning is started, it
is important to have as clear an understanding as can reasonably be had of the causes for the basic economic
condition and trends, and the direction and type of future activity that can be expected.
The basis for functional city planning policy is the
physical relationship of its social institutions and the structure of its economic activity. Adequate consideration must be given to composition, volume, distribution and
direction of growth of the principal economic functions. It is important to analyze the essential factors that
affect these functions and clarify the natural and man made
causes affecting the future development.
It is with gratitude that acknowledgment is given to
Professor Frederick Johnstone Adams, Dr. Homer Hoyt and
Assistant Professor Roland Bradford Greeley for the
INTRODUC TION
Cities have developed as an integral part of our
national productive and distributive machinery. Particular
cities have fared according to their economy in relation to
national competition. Each have highly complex and
inter-related activities performing certain functions for a
segment of the population.
The chart, Principal Elements of the Economy of the
United States, shows the relationship of the various functions
of our economic activity.
Urban growth has paralleled manufacturing progress. In 1851, the United States was in its industrial infancy, and
only
6
percent of the population lived in cities of 1,000,0002
or more. In 1940, there were 29 percent. The chart,
Total Production in the United States 1863-1937, shows the trend in the volume of production.
Some of the factors that produced this dense urban growth were: the development of the factory plant based on mechanical power, the exploitation of mineral resources, a
surplus of agricultural products above the farmer's needs, the development of transportation in sufficient quantities
to supply food and raw materials to cities, and the performance of work by the urban population to pay for the food and raw materials.
1 Homer Hoyt, "Principles of City Growth and Structure". 2 Basic Material from Statistical Abstract of the United
TOTAL PRODUCTION IN THE UNITED STATES 1863-1937 BILLIONS OF 1936 DOLLARS nn 70-- 60-50 40 30 20-10 160 1670
Source: Appendix 19, section 6.
1860 1890
TREND 1879-1929
(ANNU AL RATE OF INCREASE 35%)
.
iiI.. .. . .. .I ieiii ei,
1900 1910 -- 4----I 4----I .... 1920 BILLIONS OF 1935 DOLLARS an 70 60 50 40 30 20 10 J0 40 I I "Mu I. ---7 . . i . i i a e i i .---.--. t
The sum total of buying, selling and producing in the Richmond region is a productive economic machine competing with machines of other areas. It will prosper or decline
as compared with other areas in proportion to the relative
efficiency with which it can do economic service. It con-tributes to the economic activity of the region and nation
in proportion to the efficiency and economy of the services it renders.
Commerce and manufacturing increase where facilities
and conditions for extensive trade are favorable and where industrial activities can be carried on with profit. Some of the factors that tend to increase commerce are: quick and efficient transportation to the city, a hinterland with high valued goods seeking a market outlet and demanding goods in exchange, and a large population with high incomes.
Some of the factors that tend to expand manufacturing are: available cheap raw materials, cheap efficient
transportation, a large market, abundant labor that is inexpensive, and cheap power.
On the other hand, the.decision to locate an industry in one city or another may be based upon the immediate
opportunities of a particular enterprise or the desire of a
community to increase the total amount of industrial
activity regardless of its effect upon the local industrial
structure. These two conditions tend to make an unbalanced
industrial community. Lack of industrial balance may
lower wages, shrunken purchasing power, loss of business, high cost of relief, untenanted property, tax arrears,
and curtailed municipal services. The bait of low taxes
and cheap labor has often led to unsound locations and a
low standard of community life, or to forcing the social cost of maladjusted industrial location on the community.
Today all sections of the country tend to have a
more equal opportunity to expand the types of industrial
growth for which it is best suited.
A scientific method of appraising locations for
future industrial plants follows. It is used by E. I. du Pont de Nemours and Company.
Analysis of the rate of return
1. Cost Factors
Raw Materials Delivered Power
Labor
Taxes
Depreciation
Finished Product Freight
2. Return on Investment Fixed Investment
Vorking Capital
Sales
Cost of Sales
7
Intangible factors
Real Estate Values
Transportation! Labor Supply
Average Operating Wage Rates
Average Construction Wage Rates Average Annual Manufacturing Wage Water Supply
Waste Disposal
Availability of Raw Materials
Other Economic Factors
In analyzing the economic factors of Richmond, it is
important to use scientific methods. Dr. Homer Hoyt, as
Director of Economic Studies for the Regional Plan Association, Inc., developed the method used in "The
Economic Status of the New York Metropolitan Region in
1944". It is attempted here to enlarge upon certain
aspects of this analysis.
Since the number of jobs the Richmond area can
support in the future depends on national and regional
economic activities and Richmond's ability to compete on
a favorable cost basis with other cities, these factors
will be considered.
In order to proportion the importance of various types
of industries, it must be decided which are the most crucial in giving employment in the city. The fundamental sources
of employment that support the city are called "basic".
The basic activities are those which produce goods or
services needed by people outside the city. Many types of
consumers goods are sold in part to people living outside the urban area and are partly consumed locally.
Those employed in contributing to the goods consumed
locally are called "service" or "non-basic".
Each basic source of- jobs must be analyzed in an attempt to determine its future employment possibilities.
The conclusions must contain a conception of the
nature, amount and direction of growth of Richmond's economic activities.
9.
. ).R-ICHMOND
V I RG I N I A
CITY PLANNING CO0 M M IS S 10 NNAtAND BTHOL W & A1SS
AT-CITY PLANNIN CONSUL N5
ST tOUIS Az ssuw i -R
PHYICAL
FACTORS
AFFECTING
UBNET ZMtTGlATE
NN01MtEl
. UTE .969-1
--1
0
National and Regional Economic Factors That Relate to Richmond
This chapter deals with the external forces that
affect the economy of Richmond.
Physical Factors
United States has a strategic location. It fronts on both the Atlantic and Pacific Oceans and is thus in a
favored position in world trade. Along the Atlantic are
excellent harbors such as Hampton Rhoads and New York. East of the Appalachian Mountains lies an extensive
coastal plain that is crossed by many short but economically important rivers such as the James, the Potomac and the
Roanoke. The fall line of these rivers, where the Piedmont
and Coastal Plain meet, determined the site of a string of
important cities including Richmond. It was here that the bulk of sea-going craft had to be broken. Water-power was
2
available for manufacturing.
Richmond is located on the James River at the head of navigation. Hydro-electric power is developed at Richmond.
Land Resources
Almost all of the more than two million acres of land
3
area of the United States is productive in some way.
1 C. Langdon White and,,Edwin J. Foscue, "Regional Geography
of Anglo-America. 2 Ibid.
3"Economic and Transportation Prospects"by Association of
e c.
VIRGINIA STATE PLANNING BOARD
GENERAL TOPOGRAPHY OF ViRGINIA
Soas SeetWal Awey Maps by US Coast & Gudetc Survey and Tp=grphic Mips by U S Geological Survey
and V.qrgs. Gdologcal Survey
L GE ED
Cont Interval 254 500. & 1000 Feet As Noted
Elevations Above 4000 Feet As Marked Over 4000 Feet 3000 t 4000 Foot 2t000to 3000 Faet S1000 to 2,000 Feet 300 to 1000 roet J 25O to 500 '--t
SLes Then 250 Feet
I
The soils of the east are divided into two major
types: the "gray-brown podgolic soils" north of Richmond,
and the "red-and-yellow soils" of the south. In the south,
where the soil is not frozen in winter, leaching continues
throughout the year. 1
Generous applications of commercial fertilizer must
be used in the Piedmont Region to make the soil productive.
It is said that the Southern Piedmont region is the most
2
heavily fertilized part of the United States.
-In United States,
615
million acres are now in forest3
or available for forest use. About one-half of this
4
forest and cut over landis in the south.
In the east, the major groups of forests are: the "northern hardwoods". north of Pennsylvania and in the Appalachian Mountains, the "southern hardwoods" from Pennsylvania to northern Georgia and Alabama, and the
"southern pineries" of the coastal plain from northern North Carolina south.
In Virginia, there are 14,832,300 acres of forest area. This is 58-1 percent of the total land area. Hard-woods predominate in
56.8
percent of the commercial forest5
acreage.
1 White ana Foscue, OP, cit.
2 Ibid
Associationoof American Railroads, Op. cit.
Conference Board, "Studies in Enterprise and Social Progress"
AVERAGE SUMMER PRECIPITATION
(In Inches)
Figure 6.
Concentration
of Highest
Average
Sunrmer Rainfall in the
Eastern United
States.
IRON AND COAL DEPOSITS
NOT INCLUDING SUBBITUMINOUS AND I IGNItE MAI
~4~J ~h=-~ II -~ I-'..-. .1 I
I
I I * I. I -- ,,...-- I -- ~1 * L~#
'\ Pt. I -. ___ C, II
CITE COAL OUS COALFigure S. Concentration of Iron and High-grade
Coal Deposits in the Eastern United States.
ANTHRA
BITUMIN IRON
14
C limate
United States is in the Tropic of Cancer and therefore has no large tropical region. 1
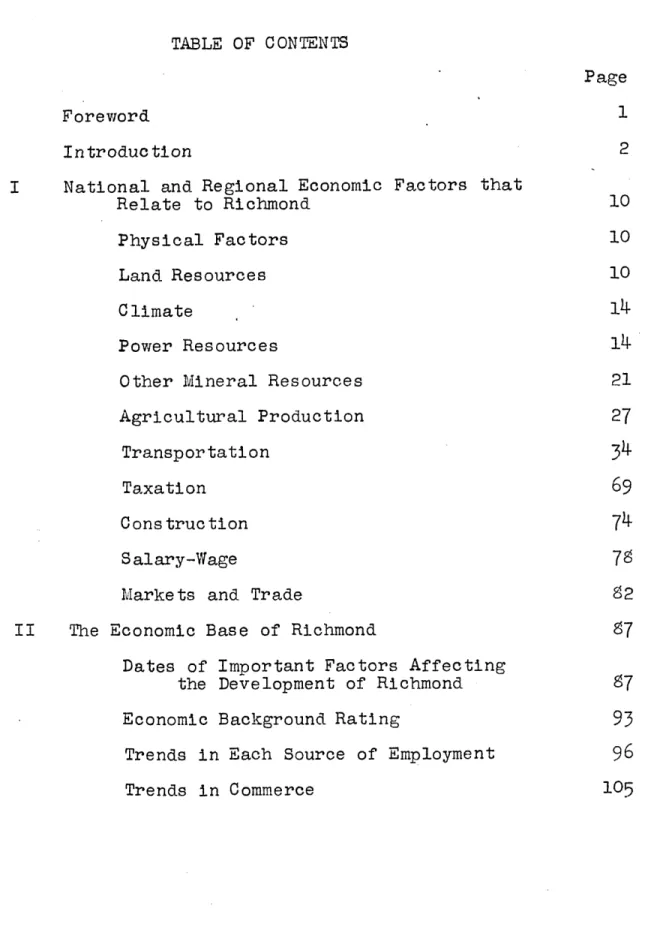
Richmond is near the dividing line between the"humid continental climate" of the north and "humid subtropical climate" of the south. North of Richmond, the East Coast has hot summers and cold winters, with precipitation well distributed throughout the year. In the south, along the
seaboard, the rainfall is rather evenly distributed through-out the year, with the maximum in summer when the heating of the land causes convectional showers. In the winter, there is rain only when the wind blows from the Gulf. 2
In Richmond, during 1940, the average temperature during January was 39.1 F and in July was 78.0 F. The percentage of sunshine is relatively high. Rainfall is
ample but not excessive and relative humidity is not
4
excessively high. Power Resources
In the United States the principal sources of fuel and electric energy are coal, oil, natural gas and water power.
1 :White 'and Foscue, Op. cit.
2 Ibid
3
Cities Supplement, Statistical Abstract of the United States, Table5
4
Technical Advisory Corporation, Report of Investigation with Reference to Improving the James RiverESTIMATED ENERGY OUTPUT, MINERAL FUELS AND WATER POWER
IN THE UNITED STATES, 1937
IN EQUIVALENT BRITISH THERMAL UNITS
0
TO I-FOR L" -- -.
--. /.a . ®..sc r..owee .nwsnae~a
24TA400--P __ 1-
VIRGINIA CONSERVATION COMAISSION
VIUWNIA UOLOGIC SIJEY
S "R*O Aft"opo*@
1
7
There are 3,200 billion tons of coal in minable beds in the United States. Coal provides more than half of the energy derived from mineral and water power in
1
the nation. The first coal to be dug in the country was
2
mined near Richmond. In 1939 only
3.4
per cent of the3
bituminous output was in Virginia. However, 27.4 per
cent was &roduced in West Virginia and 10.9 per cent in
Kentucky. There are approximately 1,000,000,000 tons
5
of coal in the Richmond basin. Most of it is high
6
volatile coal.
Crude petroleum and natural gas accounted for 42.8 per cent of the energy total in 1937. Petroleum alone
accounted for 32.4 per cent. The maximum estimates for
crude petroleum in United States in 1938 was 16,309
millions of 42-gallon barrels. The eastern states do not
contain a large quantity. The estimate for Pennsylvania
was 300 million, for West Virginia was 28,million, and for
7
Kentucky was 38.million.
The estimated available water power in United States in 1937 was 4.09 per cent of the total energy output.
1 National Resources Committee, Energy Resources and
National Policy
2 White.and Foscue, Op. cit.
3
National Resources Committee, Middle Atlantic RegionIndustrial Development
4 House Document 650, 78th Congress of the United States,
Second Session
5
Richmond Ch. of Com., Industrial Appraisal of Richmond, Va.6 Technical Advisory Corporation, Op. cit.
18
ANALYSIS OF COAL FROM THE RICHMOND BASIN 1 South of James River
Name of Pit (Eas tern Outcrop)
Moisture Volatile Fixed
Matter Carbon Ash Sulphur
Clover Hill (Coxe's Mine) Clover Hill (Coxe's Mine) Clover Hill (Coxe's Mine)
Stone Henge
Creek Company Shaft
Mills & Reed Creek Shaft
Greenhole Shaft
Midlothian, average Midlothian, new shaft
Midlothian, wcreened
Midlothian, 900-foot shaft Midlothian
Midlothian
Midlothian, grove shaft Midlothian, average Maidenhead
English Co., old shaft
English Co., middle bench English Co., top bench Chesterfield Mining Co.
Willis Pit, Aetna shaft (Western Outcrop)
1.339
1,450 30.984 29,120 38.500 36 -500 26 -788 31.170 2.455 29.738 0.670 31.2081.785
34-295
1.172 27.278 2.000 31.62031.600
1.030 38.230 1.050 36.490 32.830 35-820 28.400 28.400 1.896 28.719 28.800 Powhatan Pits Scott's Pit32.330
33.700
North of James River (Eastern Outcrop)
Carbon Hill, upper seam Carbon Hill, second seam Carbon Hill, carbonite Carbon Hill, average
Carbon Hill, natural coke
(Wes tern Outcrop)
Anderson's Pits (Dover) Anderson's Pits (Dover) T. M. Randolph
Coalbrookdale
Coalbrookdale, first seam Coalbrookdale, second seam
Coalbrookdale, third seam
Coalbrookdale, fourth seam
Cranches, upper seam Waterloo
Deep Run Basin
1.400
o.400
1.570 1.785 1.116 20. 600 18.600 9.640 23-959 11.977 28.300 26.000 30- 500 2Z .000 2 .000 22.830 24.700 21.330 30.000 26.800 26.1601 Technical Advisory Corporation, Op. cit.
10.132 5.360 6-500
4.800
8.570 2.00014-737
9. 4409.655
10.467 7.670 7.100 6.470 15.7583.200
10.820 5.100 9.5208.634
4.600 0.514 2.890 -058 2.286 -202 1.520 2.230 1.95756.831
65.52055.000
58-700 60.300 67.830 53-012 ;6.400 54.063 61.083 58.260 61.100 54. 27046.702 63.970; .360
U
.500 61.68058-794
66.600 59-870 60.860 7.8005.660 60.800 71.00079.
930
59.
976
75.081
66.780 64.200 66.150 66.480 70.800 54, 970 -65500 .07064.600
55-200
69.860
17.200 10.000 8.860 14.280 11.826 4.920 9.8003350
45205.200
22.200 9.800 22.600 5.4oo 18.000 5.000VIRGINIA CONSERVATION COMMISSION
DIVISION OF WATER RESOURCES AND POWER
LEGEND
CD
4K
'A
AiW
U
-r----21
Potential water power was estimated in 1936 at 42,753,000
horsepower, available 90 per cent of the time. The
potential amount available in Virginia is
463,000
horse-power or 1.08 per cent of the total. In North Carolina
there is 1.36 per cent and in South Carolina there is 1.12
per cent. The installed capacity in plants having 100 horsepower or more in 1938 was 151,000 horsepower in
Virginia, 947,000 in North Carolina, and S37,000 in South
Carolina.
$50,000,000 has been appropriated for water power
dams in-Virginia. The installed power for these projects
will be 9,000 kilowatts for the Philpott Dam, 54,500 for
the Salem Church Dam, 108,000 for the Bug Island Dam,
and 34,000 for the Gatbright Dam.2
Other Mineral Resources
United States is first in the development of mineral
wealth. We have relatively abundant supplies of iron ore,
limestone, gypsum, bauxite (alumina) and molybdenum.3
Pennsylvania produces about 1 per cent of the Nation's
iron. Near Birmingham, Alabama are other iron ore
deposits. In 1930 they accounted for about 10% of the total.5
1 National Resources Committee, Op. cit.
2 House Document 650, 78th Congress of the U.S., Second Session
3
Association of American Railroads, Op. cit.White and Foscue, Op. cit.
VIRGINIA CONSERVATION COMMISSION
VIRGINIA GEOLOGICAL SURVEY
Me MT*ALI "P000T OP VinSOIA
U'
~Li~J
LEO N M
aas em su
-own me... ace -; 'M , *
* ~ - m,.m 0.
---4 A
2 3
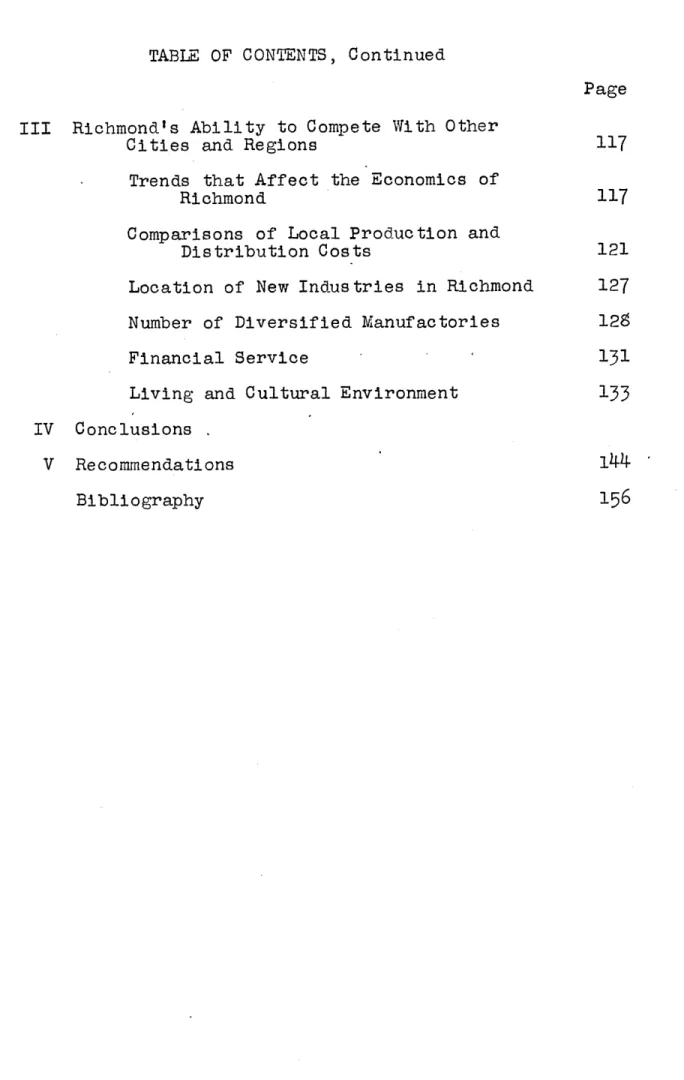
The Great Appalachian Valley, from New York to Alabama,
has quantities of limestone. The Lehigh Valley, a part of this Great Valley, ranks first in the cement industry because of the early start it had. Since cement making requires much
fuel, a location close to coal is advantageous. Virginia
has ample supplies of limestone. 2
There are deposits of gypsum in Virginia.3
All domestic supplies of bauxite come from Arkansas,
Alabama and Georgia. Alabama and Georgia supply
4
per centof the domestic supply. Alcoa, Tennessee produced
41
percent of the nation's aluminum in 1939. Other electrolytic aluminum reduction works are located in New York State and
at Badin, North Carolina. .
Molybdenum is found in the Rocky Mountains,5 but all of the other important minerals mentioned are found in or
near Virginia. 6
In Northern Georgia, asbestos, chromite, copper, corundum, feldspar, gold, mica, serpentine, -talc and high quality marble are produced.
1 White and Foscue, Op. cit.
2 Virginia Conservation Commission, Industrial Opportunities
in Vi.rginia
3Ibid
4 White and Foscue, Op. cit.
5
Ibid6 Ibid
MINERAL PRODUCTION OF VIRGINIA 1942 to (All figures in thousandsS
Product Clay Products Coal Coke Copper Feldspar Iron Kyani te Lead Lime Manganese ore Manganiferous ore Marl calcareous Mica scrap Mica sheet Natural gas Ores: Copper
Gold and Silver Zinc
Zinc-lead Petroleum
Sand and Gravel Silica Silver Slate Stone C_ barrels L short tons troy ounces value
$
short tons 1942 2, 500 20,136 35055
24 value in § short tons ", "t pounds long tons ounces long tons short tons "o "d pounds M cubic ft. short tons "1 " "I " "I "t 5,611 * 2 * 7,053 Quantity 1943 1, 600 20 280293
200 21 .057
* 2195
7
12 62 16
77
.1 106
2 206 114
26 25
92 05 .1 462 24,669
* 15 2615,668
1944 1, 200 19,900 243 582 24 .17
* 5 154 204
69
2 1555
1.9 5293
* 3,248 3,328.6 .08 .3 19 13.5 * *5,5406,360.8
Titanium concentrates: Ilmenite " Rutile "t Zinc Mis cellaneous Total value " "t " "t * * * * 19 273
20 4,484.1 value$
10 ,83.9
in dollars 79,771 12,114 85,825*Note: Included with others in Miscellaneous.
Source: Mineral Yearbook, 1944, U. S. Dept. of the Interior
1944
24
653.4
417.7
Value 194 S1,200.0 64,476.0 1,895.278.6
147.14.6
* *739.5
1,129-3 623.1 * 84.238.3
57.9
53-0 .04 5282 5
Virginia has an annual output of mineral production
amounting to $46,000,000.1 There are ample supplies of
dolomite, granite, greenstone, limestone, marble, quartzite,
sandstone, shale, slate and soapstone available for
construction and industrial purposes.2 There are deposits of iron, manganese, pyrite, pyrrhotite, the titanium mineral
ilmenite and rutile, and zinc.3 A few of the non-metallic
mineral resources that are minable are barite, clay,
diatomite, feldspar, kaolin, kyanite, mica, ocher, salt and talc. 4
Copper is also close to Richmond for at Baltimore is the largest copper-refining center in the world.
The table Mineral Production of Virginia, 1942 to 1944,
gives the value of the minerals and the trend in production
during those war years. Under Miscellaneous is also included:
aplite, barite, bauxite, beryllium ore, cement, raw clay,
millstones, phosphate rock, pyrites, quartz crystal, salt, sand and sandstone ground, talc and ground soapstone, and
tantalum and columbium ores.5
1 Richmond Chamber of Commerce, Op. cit.
2 Virginia Conservation Commission, Op. cit.
3
Ibid5
IbidVALI & FAM FICOS
L S. 0EPAM ENT OF AGRICULTURE
VALUE OF FARM PRODUCTS SOLD. TRADED. OR USED BY FARM HOUSEHOLDS. 1939
-. . - -- . - . - .
27
Richmond is noted to be the best scrap iron market in
the South.
Agricultural Production
Farming in the United States is widely distributed. It
is more heavily concentrated in some areas than in others.
The South Atlantic States have 8.7 per cent of the total 1,061 million acres in farms. However, it had as much as 15-9
per cent of the total crop value in 1939. It also had
5.6
per cent of the value of livestock and livestock products and11.7 per cent of the value of all farm products.2
During the period 1939 to 1943 the total value of all
agricultural products in Virginia rose from $112,453,000 to
$274,558,ooo.3 In 1940 756,270 tons of agricultural railroad
freight originated in Virginia and in 1944 this figure rose to 1,113,119 tons. 4
The income from various products is listed in the table
Cash Farm Income in Virginia and the Fifth Federal Reserve District by Commodities.
During the period 1939 to 1943 the income from tobacco
rose 234 per cent in Virginia. In the Fifth Federal Reserve
District, it accounted for
44
per cent of the total cropincome in 1943 and totaled $333,000,000.5 1 Technical Advisory Corporation, Op. cit.
2 Interstate Commerce Commission, "Statistics of Railways in the United States, 1940 and 1944"
3
Federal Reserve Bank of Richmond,"Economic Impact ofthe War Upon Agriculture"
4
Interstate Commerce Commission, Op. cit.28
minis WW lou w
2 9
CASH FARM INCOME IN VIRGINIA AND THE FIFTHFEDERAL RESERVE DISTRICT BY COMMODITIES
(Thousands of Dollars) Virginia Commodity 1939 1943 Fifth Federal Reserve District 1943
Total food grains Wheat
Total feed grains and hay Corn
Total oil-bearing crops
Soybeans Peanuts Cotton lint Cottonseed Tobacco Total vegetables Truck crops Total fruits
Other crop income Total Crop Income Cattle and calves
Hogs
Sheep and lambs Commercial broilers Chickens Turkeys Eggs (chicken) Dairy products Wool Other
Total Livestock Income Total Crop and Livestock
Income Government payments Grand Total
3,790
3,581
3,202
2,215 6,105165
5,940 61876
18, 388 11,430 5,2149,293
6,780
.4,220 4,027 6,425 3,53415,704
1,962 13,742 2,728 329 43,020 30,624 13,167 19,218 11,6o859,682 132,876
10,6367,174
1,8315,619
3,737
2,2069,176
15,744
458
170 - 21,090 24, 182 2,658 19,184 10,6484,15
24,71133,745
870439
56,771 141,682 116,453 274,5586,288
6,392 122,741 280,950 14, 80014,100
26,000 13,900 46,3007,300
39,000
148,600 19,400333,500
105,500 59,100 32,200 38,500 764,500 57,900 72,000 6,00058,100
39,500 9,500 76,100 115,000 2,200 2,100438,300
1,202,800 38,900 1,241,7001 1939 B. A. E., "Farm Production Disposition and Turkeys", March, 1944.
-30
Flue-cured tobacco is the most important type, comprising 92 per cent of the total production in the District in 1944. Flue-cured and Burley tobacco are used
in the manufacture of cigarettes. Sun-cured, used for plug chewing tobacco, and fire-cured tobacco, used for
snuff, nicotine sulfate and tobacco extract are raised in Virginia. Together they comprise 1.5 per cent of the total
production in the district in 1944.l
Turkish tobacco may become more important in the future.
It is now being raised in Virginia and the Carolinas. 2
The cotton yield was second in importance as a source
of farm income in 1943 in the District. However, in Virginia,
it is not one of the most important crops.7
The total vegetable commodities income rose 250 per cent in the District during the period 1939 to 1943. In Virginia, during that period, the increase was 267 per cent.
The chicken, broiler and egg income totaled
55-5
milliondollars in Virginia in 1943. During the period 1939 to 1943
the income from these rose 311 per cent.
Dairy products, hogs, cattle, fruit and oil-bearing crops are also important in Virginia. The oil bearing crops increased 260 per cent during the period 1939 to 1943.
1 Federal Reserve Bank of Richmond, Economic Impact of
the War Upon Agriculture
2 New York Times, November 10, 1946, "Report From Nation"
PERCENTAGE OF CROPLAND HARVESTED DEVOTED TO TOBACCO
FIFTH FEDERAL RSERVE OISTINCT, BY COUNTIES: 19M
PERENTAGE OF CROPLAND HARVESTED DEVOTED TO COTTON
FIFTH FEDEAL RESERVE DISTfiCT, BY COUNTIES: 193
VALUE OF DAIRY PRODUCTS SOLD OR TRADED AS PROPORTION OF VALUE OF ALL FARM PRODUCTS SOLD OR TRADED
FIFTH FEDERAL RESERVE DISTRICT, BY COUNTIES: 1939
VALUE OF LIVESTOCK AND LIVESTOCK PRODUCTS SOLD OR TRADED AS PROPORTION OF ALL FARM PRODUCTS SOLD OR TRADED
FIFTH FEDERAL RESERVE DISTRICT, BY COUNTIES: 1939
w,
ALUE OF POULTRY AND POLLTRY PRODUCTS AS A PROPORTION OF VALUE OF ALL FARM PRODUCTS SOLD OR TRADED
FIFTH FEDERA KKRvE DT. wf mUpES g: g9
PERCENTAGE OF CROPLAND HARVESTED DEVOTED TO PEANUTS FIFTH FEDERAL RtSEnVE DISTCT, By COUNTInES:
if -~ - -. eOMe: 0e &ms e ft"aft § . v ammom
34
In Virginia, during that period, the increase was 267
per cent.
Dairy products, hogs, cattle, fruit and oil-bearing
crops are also important in Virginia. The oil-bearing crops increased 260 per cent during the period 1939 to
1943.
The chicken, broiler and egg income totaled
55-5
million dollars in Virginia in 1943. During the period
1939 to 1943 the income from these rose 311 per cent.
Peanuts are the most important oil-bearing crop. -l1 However, soy beans are increasing in production rapidly.
The increased production in agriculture may be
expected to continue after the war since during the last
two decades improved farming practices have resulted in
higher yields per acre.2 Transportation
Many means of transportation have been developed in
United States since 1900. However, railroads still handle more ton-miles and more passenger-miles than all other agencies of commercial transport combined.-'
There were 227,335 miles of all steam railways in
United States in 1944. The South Atlantic States had 29,475 miles and the Middle Atlantic States had 20,175
miles in 1940.5 The flow of freight traffic is illustrated
in chart form.
1 Federal Reserve Bank of Richmond, Op. cit.
2 University of Virginia News Letter, October 15, 1945
3
Association of American Railroads, Op. cit.Interstate Commerce Commission, Op. cit.
35
inlaid A ~IKCe Ar IA. N.A.S.A Ruew.m CumIN. I. IN ~ - - AM Inter~rtate Commerec ('nmrnlsslon.
WESTERN FLOW OF FREIGHT TRAFFIC* DECEMBER 13, 1933
36
awnALus
mcrs/
cRENT PIE ISYLOSMA
-SOWASET-MEVERSIaE 4 CuMiEANA-PuMoNT 7 sTRNO KENW-THACKER NORTHEASTCER RTUCYJ EPOCANPAS TONNAGE RAD
Tomse scAtt E cNAE5ts0o
0 mo0 or 1o0
IlOS TONlG
.. -Tridewater Shipmentu of Bituminous Coal, 1929. (Repro-duced from Prits and Veenstra, Regionai lBift, in the Bituminous
3 7
There are six railroads serving Richmond with a
total of 24,881 miles. Two of these railroads are
east-west and four are north-south. They have main lines into
eighteen states. 1
The Freight-Rates have favored the Northeast or
Official Territory to the detriment of the other areas of the country. Manufacturers in the South or West had
to pay more to ship goods than their competitors in the East. This difference was most significant in the class rates, which cover mainly manufactured and
semi-manufactured goods. 2
The I. C. C. has ordered an interim measure that
class rates be reduced 10% for the South and West and
raised 10% for the Northeast. This measure will affect only about
6%
of the total freight tonnage.RAILROAD-RATES BY CLASS OF FREIG-HT3
Class Official Southern
1 1000 100% 2
5%
85/
70
70% 50%5
356%
6
27.5%
40%
The dividing line between the Official and Southern territories is the Norfolk and Western Railroad through
Petersburg, Virginia. Richmond, being just north of
1 Richmond Chamber of Commerce, Op. cit.
2 F. S. Atwater, Industrial Organization and Management,
Supplement on Plant Location .
38
STATES SERVED BY MAIN LINES OF RICHMOND RAILROADS1 State A.C.L. S.A.L. Sou. N.&W. C.&O. R.F.&P.
Alabama X X X - - -Dist. of Col. X X X - X X Florida X X X X - - -Georgia X X - - -Illinois - - X - X -Indiana - - X - X -Kentucky - - X X X -Louisiana - -
X
- - -Maryland - - - X -Michigan - - - -X
-Mississippi - - X - - -Missouri - -X
- - -North Carolina X X X X - -Ohio - - X X X -South Carolina X X X - - -Tennessee - -X
- - -Virginia X X X X X X West Virginia - - - X XMILEAGE OF RAILROAD SYS TEMS SERVING RICHMOND Total Mileage
Railway of System
Southern Railway
7,735
Atlantic Coast Line Rwy.
5,101
Seaboard Air Line Rwy.
4,317
Chesapeake & Ohio Rwy. 'o09
Norfolk & Western ,519
Richmond, Frdsbg, & Potomac 115
Total 24,81
1 Industrial Appraisal of Richmond, Richmond Chamber of
-*~.1
* I I39
I40
Petersburg, profits by the freight-rate difference. There-fore, Richmond can ship to northern or western points at a
lower rate than cities in the Southern Territory.1
Motor carriers are increasing in importance. In the
Middle Atlantic and Southern Region, 32 per cent of the nation's motor carrier intercity common freight was trans-ported in 1944,
MOTOR CARRIERS STATISTICS-INTERCITY FREIGHT, 19442
(Figures in Millions)
Trucks and tractor Tons of revenue miles operated-
Freight-trans-common ported-common
United States 1,823.3 85-8
Middle Atlantic Region
304.9
18.3Southern Region 251-0 9.0
Twenty-seven motor freight lines operate from Richmond. U. S. Highway No. 1 passes through Richmond.. Many other
important highways radiate out from the city, including the east-west U.~ S. Highway No.
60.3
The Atlantic and Gulf Coast water carriers transported 20 per cent of the total revenue freight carried in all
navigation areas of the nation in 1944. This included Class A and Class B carriers only.
1 Richmond Chamber of Commerce, Op. cit.
2 Interstate Commerce Commission, Op. cit.
'.. \1 -- 1.
LEEND
COWLcrap CN*ELS
mUEsL .PTM OOE4 F SP -Sos. muH To. PUi~To
=0 MMEL 09PTN 9TO P FTtT S.TP
=== C@ L "EPT. 0 TO LU9M TIIN 9 FEET SAgP
VSa SMAW moo. In$ HMo *PUT EMso
.T..
MPDor P U.P. SAT9noifi eor T.1 VOD STUS T91,6 5 sOIp or eoono5E
FREIGHT TRANSPORTED BY WATER CARRIERS1 OF CLASS A AND B IN 1944
(Figures in Millions)
No. of tons (2,000 lb.) of Revenue Freight Carried
All Navigation Atlantic and
Areas Gulf Coasts
Joint Rail and Water
4.4
1.0All Other Traffic 52.9 10.4
Total
57.3
11.4Before the war, Richmond was served by two steamship
lines, the Buxton and the Eastern Steamship Lines. It has
two terminals, the Intermediate and the Deep Water Terminal. The channel to the latter has a minimum depth of at least
25 feet. This will accommodate ships up to 650 feet in
length. Ninety per cent of the commercial vessels afloat
can dock at this terminal. 2
Aviation is becoming an important means of
transporta-tion. Virginia's sixty-two airports were 21 of the nation's
total on July 1, 1944. The Richard E. Byrd Airport at
Richmond is used by commercial planes. Eastern Air Lines, Inc. operates planes daily from Richmond to New York,
Washington, Atlanta, Miami and intermediate points. 3 1 Interstate Commerce Commission, Op. cit.
2 Richmond Chamber of Commerce, Op. cit.
ROUTES OF SCHEDULED AIR CARRIERS IN THE CONTINENTAL
UNITED
STATES
OCTOBER 15, 1940.
44
AIRPORTS, BY CLASS, JULY 1, 19441
Class United States Virginia North Carolina
Sub I 256 5 12
I
767
2313
II 834 139
III 464 1 IV and over 14 173,o6
62
65
ManufacturingUntil 1860, manufacturing enterprises consisted mostly
of small units located in cities on the Atlantic Seaboard.
Manufacturing migrated westward primarily along railroads up until 1890. The tendency was for cities to specialize in a
product. Most of the industries were located by accident rather than scientifically selected. The results were that the places were not particularly advantageous. 2
Decentralization has started during recent years.
Industries which have reached maturity are less tied to the
region originally occupied than was formerly the case. Since plants tend to be immovable, change in the relative production
of different districts proceeds slowly. The change is gradual,
chiefly by growth at one point and decadence at another.3
The work shop of the nation is located mostly in the
4
northeastern part of the country.
1 Statistical Abstract of the United States, 1944-45 2 White and Foscue, Op. cit.
Ibid
45
In 1939, New York State had 13 per cent of the nation's
lo,572,842 wage earners in manufacturing. Pennsylvania had 10 per cent, while Virginia had only 1.8 per cent.1 The states that increased most in number of employees in
manufacturing from 1929 to 1939 were North Carolina, Virginia,
South Carolina, Maryland, Georgia and Tennessee. 2
The recent war brought about a tremendous expansion in
manufacturing. The total number of new, expanded, or
converted plants was 13,126 from July, 1940 through May, 1944.
The total value was $20.3 bl11ion. Of this, only $2.2 was
authorized for conversion of plants.3
The Middle Atlantic States received 18.8 per cent of
the total and the South Atlantic States received
6.7
per cent. Aircraft, ships, iron and steel, and guns, ammunition and explosive plants were authorized most of this. Virginiawas authorized 105 plants valued at a total of $292,000,000.4
During August of 1946, the permit valuations for
industrial buildings in urban areas for the Middle Atlantic
States was $3,576,0oo, or 16.4% of the total. For the South Atlantic States they were $2,229,000, or 10.7 per cent. 5
1 16th Census of U. S., 1940 Population, Vol. III
2 Regional Plan Association, New York's Competition in Manufacturing, Regional Plan Bulletin No.
64
3
Association of American Railroads, Op. cit.Ibid
5
United States Department of Labor, Construction, October, 194646
MANUFACTURING EMPLOYMENT IN EASTERN UNITED STATES, 1939 Number Percentage (In thousands) Increase
Since 1929 North Carolina 325-5 131-0 Virginia 186.7 122.4 South Carolina 150-9 119.1 Maryland 180-5 114.4 Georgia 205.2 111.7 Tennes see 172.4 110.2 Maine
97.6
109.6 Alabama 155-4 105.4 Michigan 700.0 100.7 New Jersey 561.8 100.2 West Virginia 91.6 99.2 Kentucky 100.896.6
District of Columbia 22.295-8
Florida 90.1 95-8 Delaware 29.694.9
Mississippi66.8
94.5
Connecticut 295.793-9
Indiana 345.6 93-4 Illinois 921-5 91-5 New York 1,357.4 90.4 Pennsylvania 1,072.9 90.2 New Hampshire69-5
86.2 Rhode Island 121.3 85.2 Ohio783.2
84.4 Massachusetts 574.2 84.2 Vermont 27.5 82.5 Wisconsin 270.279-8
47
- FERTILIZERS PLANT LOCATION 1935 1k0
IA L ... -. * 4--7--A %LEADING STATES BASED ON TOTAL MANPOWER
-(WAS[ tASSEeS Pws SALARIED COPLOYuES)
-MARYLAND GEORGIA VIRGINIA *. NORTH CAROLINA SOUTH CAROLINA ALL OTHER 0 to to so .o so o e or u .. aPOSt IN TSoUosos
.AfAX&& IN i(,Ptt OW NE NAfMA OAM NCA' CMiAiMtV
. -s.. CIGARETTES
PLANT LOCATION 1935
7l
-L111111S tarts PLUS SGeRIC 001.m11o11
0 to to so a0 so--so0e IV I00MP 4111
/..
l48
LUMBER AND TIMBER PRODUCTS NOT ELSEWHERE CLASSIFIED '
i COTTON MANUFACTURES PLANT LOCATION 1935 0 *0.0 0 0 0 9 78 00:
49
The increased manufacturing production in Virginia
can be approximated from the figures on the number of tons of manufactures and miscellaneous freight originating in
Virginia. In 1940, the figure was
5,002,346
tons whichhad expanded to 8,100,165 tons in 1944. This is an
expansion of 161 per cent for the five year period.
Tobacco manufacturing is orre of the most important enterprises in the South. It was between the years 1890
to 1900 that the manufacturing of tobacco began on a large
scale. The Central Piedmont is the logical place for the
cigarette industry to settle. The farmers of that area know the problems connected with the production of bright
leaf tobacco.
Each year North Carolina and Virginia together produce
2
84 per cent of the total cigarettes made. In 1939, the
3
value of tobacco manufactured in Virginia was $352,490,441.This is 26.7 per cent of the total for the nation.
Richmond and Petersburg are the two principal tobacco
4
manufacturing cities in Virginia. Based on the value of
the product, Richmond produced
78
per cent of the total ofthe state. The value was $271,311,902.5
The center of the nation's cotton textile industry is
the South. The Piedmont Region produces good grades of
coarse and medium textiles. 1 White and Foscue, Op. cit. 2 Ibid
3
A. J. Maxwell, Some Aspects of Economic Development inNorth Carolina Since 1900
4
Ibid5
Richmond Chamber of Commerce, Ranking Industries inRichmond, Virginia
50
u.P*MUINu m O saCULTes ,--A&. ssMeASW6TUI nLwtCollSCs
The furniture industry is important in the Central
Piedmont Region. The leading companies engage in every phase from logging to the finished product.1
The value of furniture and similar products produced in Richmond was $1,470,241 in 1939.2
The South has become the center of the rayon industry.
Virginia produces about one third of the total for the
nation.
The South may become the nation's future source of
pulp and paper. Their manufacture has grown rapidly in recent years. The investment in mills operating in the
South is nearly 200 million dollars. Paper consumption is increasing rapidly and the South is the logical place
for expansion since a pine will grow five times as rapidly
as other conifers will in New England, the Lake States, or
Quebec. In the South more modern machinery and techniques
are used.5 In Richmond, paper and allied products
manufactured totaled $12,655,510 in 1939.6
The clothing industry and the knit-goods industry are important in the Piedmont region. This is particularly
true of the full fashioned hosiery industry of North
Carolina. The clothing establishments in New York City
lead the nation.7
1 White and Foscue, Op. cit.
2 Richmond Chamber of Commerce, Op. cit. White and Foscue, Op. cit.
Ibid
5
U. S. Dept. of Labor, Monthly Labor Review, Nov., 1946, p. 5156
Richmond Chamber of Commerce, Op. cit.c"I~ 000.00 .9
-om
o000* -1Y; 0as -[II UM3NUV tog J.19GY su a~ su~ s~6 S3J.WflO* AS I53
55
-o
WAGE EARNERS IN THE BOILER SHOP PRODUCTS INDUSTRY, BY COUNTIES, 1937 146 WAGE
Ezl
EARNERS 0 - 25 26 - 100 tot - 300 so - 1.000 1=oo - 4.ooo 0-M 00004," V,48601VVLMM58
The apparel and kindred products industries in Richmond produced $9,121,069 worth of goods in 1939.1
The iron and steel industry is centered in the Pitts-burgh-Cleveland area. The reason for this is the largest markets for most steel products are in or near the coal
fields. To produce 1 ton of pig iron only .9 tons of
coke and .4 tons of limestone are required besides the
1.7 tons of iron ore.
Baltimore has the only tidewater iron and steel
industry. It was chosen as the most desirable site on the Atlantic Seaboard after a careful engineering study. Its iron ore is shipped from Chile and Cuba. 2
Birmingham, Alabama has the lowest assembly cost of any iron plant in the nation. In that area, iron ore, coal and limestone are found. However, in 1935, it had
only
6
per cent of the blast furnaces and3
per cent ofthe steel-making capacity of the nation.
Richmond produced $5,186,937 worth of iron and steel
products during 1939.
Fertilizer is concentrated in the Southern Piedmont
area because of its nearness to both raw materials and
markets.5
l Richmond Chamber of Commerce, Op. cit.
2 White and Foscue, Op. cit.
Ibid
Richmond Chamber of Commerce, Op. cit.
5
White and Foscue, Op. cit.WAGE EARNERS IN THE CHEMICAL INDUSTRY, BY COUNTIES, 1937 WAGE EARNERS o]'- 1oo 101 - 500
U
50a - 1.000 10301 - 2.50o U ...0 - 5.000WAGE EARNERS IN THE MACHINE-SHOP PRODUCTS INDUSTRY, BY COUNTIES, 1937 WAGE EARNERS 11 51 2.501 10 50 500 2.500 10.000
WAGE EARNERS IN THE MACHINERY, NOT ELSEWHERE CLASSIFIED, INDUSTRY, BY COUNTIES, 1937
*~A1
EARNERS o - 25 26 - too 101 - 500 SOt - 3.000 3.001 - 14.ooo WAGEL/,
A62
flU ~ I ;; n I~ nj4usjnsI
UN,'
6 3
The nation's largest single chemical center is the
New York Region. There, is located between 15 and 20
percent of the nation's chemical industry.1
Richmond has a sizable chemical and allied products
industry. In 1939, the value of these products was
$2,304,
535
2
Plastics is a small industry in the South. Growth there seems assured since forest products and crop
products are abundant. 3
The electrical machinery industry is centered in Pittsburg and Cleveland. Other types of machinery are
scattered throughout the northeastern states. However,
Cincinnati and Cleveland still lead in machine tools. 4
Richmond produced $1,186,825 worth of machinery in
1939.5
The clay products industry includes brick, china ware, clay refractories, porcelain, terra cotta,. tile, pottery and vitrified sewer pipe. This industry is
centered in the Upper Ohio Valley of Pennsylvania and
Ohio. The factors of location are fuel, access to large
markets, and skilled labor.6
1 White and Foscue, Op. cit.
2 Richmond Chamber of Commerce, Op. cit. White and Foscue, Op. cit.
Ibid
5
Richmond Chamber of Commerce, Op. cit.WAGE EARNERS IN THE POTTERY AND CHINA FIREIG INDUSTRY, BY COUNTIES, 1937 uImo. WAGE EARNERS - 50 51 100 101 - 500 5o1 - W.oo 1.001 LEw JERSEY is, MS0055T 14. 01 .10 W OUkS I FERRY 5. CAROL" I7 so MONFFRO g$1. 1 MACOMWAYNE Io '041OSIS 99. SHEBOYGAN GO MILWAUXEE INDIANA-a ELAtWARE 63 MIAMI HOWARD 64 OU10581 35 BE OANDELLUPL ILLINOISV? COOK Go TAZEWELL ,9 LOSAN 'S MC 00 O5AUG 35 4 WLOS LILTUOS 1E 8TUMADISON T ENNESSEE
1I WESTUM LAN 76 HAMILTO N
ED ALLEGHENY ??- DAV1050N E1 LAWEL T MEsn, =AL~uO it COLL MARTM SI ALAGAMA 23 AMORE L0 RUSSELL 24 ALLEGANY M1'10111"N
WEST VINGINIA a .MARSHALL
t1 HNCOCK OI IAHBO" too OHIO M0.119104 2? MARSHALL as GOODNUE t0 WETZEL NEMLASKA MA8O 64 CASS NALESOMl MISSOURI TAYLOR Ms. IT LOUIS 29. WOOS KANSAS
30 JACKSON 0"a0" SO COAWFORDARSAISAS So. AT%9 5? S&I.4119
V805INIA BIG OUACHITA 3. so8Is*A GEORGE O"LAIOMA
3s enSTtMI IELO E CRE
DOAT CAROLINA LO OAR&
34 JOHNSTON 10 EIA"
36 Lit 76055OL
OUT CAOLAA RSN
IL A..EN COLORAO
0O01O 94 JIproksOLO
55 MASSONINS 0I1. 4PAS
COUMBIANA WASINGTON 40 CtA 'aR m L
45 000804 CALIFSRS'A
44 ASHLASND ONTRA10 COSTA
6gon &450 LAW"MTE
4?. LILOCA SANTA CLAM0 WYANDOT 101 LOS ANGELES
so HAMILTON
6
5
RATE OF NET EARNINGS FROM OPERATIONS OF ALL CORPORATIONS IN SPECIFIED
MANUFACTURING INDUSTRIES,
1934-1936*1
Net Earnings Average Deviation as
%
Net Capital of Rate From1924-1936 Average
Food, Liquor, Tobacco and
Kindred Products 4.82 1.22
Printing and Publishing 4.25 2.60
Metal Products and Processes
3.75
3-84Chemicals and Allied Products 3.30 2.30
Stone Clay and Glass Products 3.06 3.40
Paper Pulp and Products 2.65 2.10
Miscellaneous Manufacturing 1.87
3.73
Leather and Its Products 1.61 2.72
Rubber Products 1.12 2-75
Textiles and Their Products 0.37 2.92
Lumber and Wood Products -0.84 3.14
Total Manufacturing 3.02 2.73
* Net earnings from operations Net Profit after taxes,
less income from security investments.
67
U* . ~ ~ ~ -.. -e.... I-.p2D
aa ... ...VAGE EAMR(S WN THE LE-AT#WR; TAWN=. CUMIO AND FINISMOE Dt** Oi V ' II WAGE EAMRn-so-5 In1 200 201 - 500 50 - WOO IAM - SOOO
6 9
The value of stone, clay and glass products manufactured in Richmond amounted to $892,791 in 1939.
Other important industries in Richmond are: the food and kindred products, with value produced in 1939 of
$22,033,028; the printing and publishing industries,
producing $8,278,929 worth of goods in 1939; the non-ferrous
metals and products, which produced $5,206,285 worth in 1939;
and the planing mills, with $2,218,190 value of goods
manufactured in 1939.
The relative stability of each group of industry can be found in the table Rate of Net Earnings from Operations of
all Corp orations in Spedific Manufacturing Industries, 1924-36.
The Food, Liquor and Tobacco group was most stable and earned a higher average rate of return than any other manufacturirg industry. The Lumber, Textiles, Rubber and Leather and
their products have been least prosperous. Taxation
Taxation policies vary in different states. Therefore it is difficult to compare them. The table Income Tax
Imposed upon Intangibles as of January 1, 1944 presents most
*of the taxes in detail. It does not present the whole tax. program of each state, however.
The Eastern States, with the highest income tax rates as of 1941, were: Pennsylvania, New York, North Carolina, Georgia, Massachusetts and South Carolina. Virginia had a
very low tax rate.2
1 Richmond Chamber of Commerce, Op. cit.
2 Virginia State Chamber of Commerce, Opportunities for
7 0
INCOME TAX IMPOSED UPON INTANGIBLES AS OF JAN. 1, 19441 (Exclusive of taxes on shares and income of banks and
trust companies) (All figures are expressed in cents per $100 unless otherwise 9tated)
-eH Co rd Vi 4- 0 0 Z ;4 44C H 0 0- C C (1)d "H 0 - 440 o c o o 0r 0 0 ,-qCd to ~4 4-1 Co Co a) (1).H- rd rd -P Q) V0 04-' W Wi M on Co o d 04-' C oc S o o C rdo z~< Co rd ,o rd H o bo 0) d a> mm Z rA 0 s: ow cr Cd 4- Q) r-d- ~C )ra (1 4- C +a 0-A 4-' 0+c'
o c e o o Io-' oIL oa>
o rX4H 0 0 :2; H 4M t0Z1 q, - .r :: w4- P 04-' Z~r U) M"mo 9H 0 o o Fmo tomod 0 rd 0- 0 0 4- ) rd4 H 0 0 _qCd : Cd"~ 44) 4- 0 -P)G V) 0 to toO a) M Alabama Commecticut D. C. and Delaware Florida Georgia Kentucky Maryland Mas sachusetts New Jersey New York North Carolina 25
40b
a 10 30 50 Ohio30
Pennsylvania 40d South Carolina Tennessee4d
Virginia75
West Virginia e40
10 10 30 30 50 .5d 2. d6.
86.
8
30 50 505d
5d40 40
lOc lOc 6d 6d 50 50 e e 15 40 -5 10c10 1 30 10 50 50 2.5 d 10 2.6.8
25128
2050C
50 5d 404
a 10 20 50 e e1 Governmental Research Institute, Taxation of Intangibles in Missouri and the Other States
Notes: a Same as real estate
b
% of "net income", Mass. is
6.78%
c Non-recurring registration taxd If bearing interest
e Varies
(See original for further details.)
Cc Co <<) Co 0: States 25 10 10 15 50 2.5d 6. 6d 30