The Economic Impact of Tijuana's Maquiladora Industries on San Diego's Economy
by
Michael Scott Orrantia B.A., Development Studies
The University of California, Berkeley
(1988)
Submitted to the Department of Urban Studies and Planning in Partial Fulfillment of
the Requirement of the Degree of Master in City Planning
at the
Massachusetts Institute of Technology May 1990
Michael Scott Orrantia 1990. All rights reserved.
The author hereby grants to MIT
permission to reproduce and to distribute copies of this thesis document in whole or in part
I
/
,
Signature of Author
Department of Urban Studies and Planning May 18, 1990
Certified by
Karen R. Polenske
Professor, egi al Political Economy and Planning
\ 4 r-qhefpisa.Supervisor
Accepted by
Donald A. Schon Chairperson, Master in City Planning Program
The Economic Impact of Tijuana's Maquiladora Industries on San Diego's Economy
by
MICHAEL SCOTT ORRANTIA
Submitted to the Department of Urban Studies and Planning on May 18, 1990 in partial fulfillment of the
requirements for the Degree of Master in City Planning
ABSTRACT
We used the San Diego Metropolitan Forecasting and Simulation Model to assess the economic impact that Tijuana's maquiladora industries have on San Diego's
economy with respect to San Diego acting as a supplier of inputs to the maquiladoras. To forecast the economic impacts, we used past trends in the growth of the number of maquiladoras in Tijuana and the growth in the amount of imports to Tijuana's maquiladoras to estimate the future value of exports from San Diego.
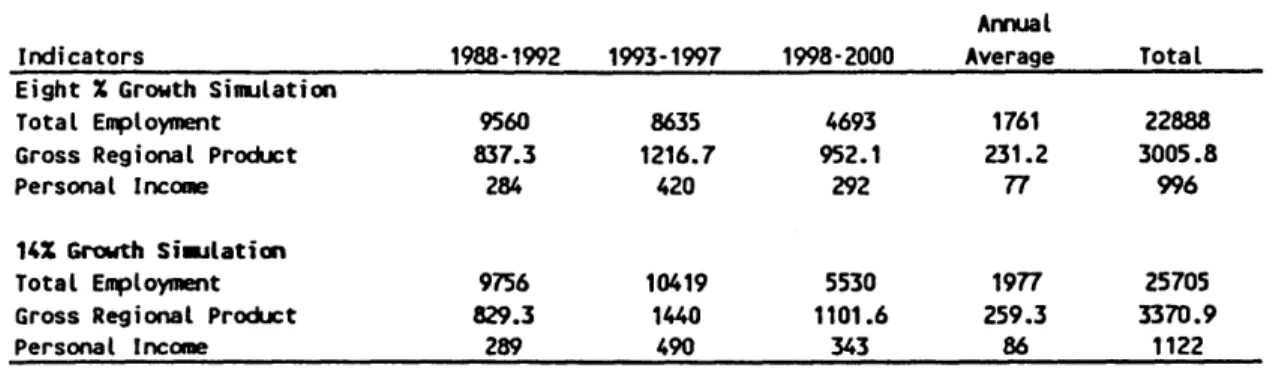
The results of the forecast for the period between 1988 and the year 2000 indicate that increased growth in
maquiladora activity will add about 24,000 new jobs, most of them in the manufacturing sector, and the gross
regional product will increase by about 3 billion
dollars. Tijuana's maquiladora activity is beneficial to San Diego's economy.
Thesis Supervisor: Karen R. Polenske, Ph.D.
Title: Professor of Regional Political Economy and
ACKNOWLEDGEMENTS
I am very grateful to my advisor, Karen R. Polenske and would like to thank William Wheaton for acting as my
second reader.
I would especially like to thank George I. Treyz for permitting me to use the San Diego REMI Model to conduct my research; without this model, my research would have
been almost impossible. In this same spirit, I would
like to thank Glen Weisbrod of Cambridge Systematics, Inc. for helping me copy the REMI model and for his time and patience in this regard.
I must also give tremendous thanks to my wife, Tammy, and son, Nicholas, for their love, support, and patience, without which I could not have persevered. Finally, I would like to give a special thanks to my mother-in-law, Michele, who traveled great distances to
stay with my son, Nicholas, while I finished this thesis. I take full responsibility for all errors and
Table of Contents Chapter
1 Introduction... 1
2 Alternative Economic Models, Multipliers, and Regional Purchase Coefficients... 9
Economic Base Models... 9
Input-Output Models... 11
Econometric Models... 12
Multipliers... 14
Rims II... 15
Regional Purchase Coefficients... 16
The San Diego REMI Model... .. 17
3 The San Diego Metropolitan Economy ... 20
4 San Diego and Tijuana: A Transnational Metropolitan Economy... . 0.. ... 37.
An overview of Tijuana... . ... 37
Growth of Tijuana's Maquiladoras ... 40
San Diego as Supplier of Inputs... 48
5 Forecasting the Impact of Tijuana's Maquiladora's on San Diego's Economy.. ... . ... . 53
6 Summary and Conclusions ... . ... ..... .. 75
Appendices... 79
Bibliography... 94
Chapter 1 Introduction
The main intent of this thesis is to determine the economic impact that Tijuana's maquiladora industries have on San Diego's economy as measured by employment, output, and income. Maquiladora plants temporarily import raw materials, parts, or components into Mexico for manufacturing or assembly, and the finished or semi-finished products are then exported from Mexico; no
tariffs are paid on the imported inputs while in Mexico. Staff at the San Diego Economic Development Corporation, a non-profit company analyzing and promoting industrial growth along the San Diego-Tijuana border, estimate that about 95% of the inputs used in maquiladora assembly are produced in the United States. We want to determine the direction of the maquiladora-related economic activity in
San Diego so that local agencies designed to support
small businesses and provide job training are prepared in advance for the types of employment and resource demands associated with this growing economic activity. We hope that this type of economic forecasting and program
targeting will enhance San Diego's ability to attract more investment related to the growing maquiladora activity in the San Diego-Tijuana region.
In 1965, the Mexican government initiated the Border Industrialization Program (BIP), which allowed foreign
corporations to establish wholly owned subsidiary
operations in Mexico; the intent was to mirror the labor-intensive assembly operations used in East Asia that
involve foreign workers and U.S. corporations.
Maquiladora plants located in Mexico pay no tariffs on imported inputs so long as the firm then exports the finished or semi-finished goods. Maquiladora firms exporting their goods to the United States are required to pay tariffs only on the value added of these goods. Though the BIP has been in existence for 25 years, the number of maquiladoras has only recently become
substantial in the San Diego-Tijuana region (e.g., in Tijuana, of the nearly 520 maquiladoras, 60% have been
established in the past four years).
The maquiladora industry is one of the fastest
growing sectors of the Mexican economy and is second only to the petroleum industry as a producer of foreign
exchange. The effect of the BIP for the United States has been to allow firms operating a maquiladora to reduce
their production costs significantly, thus improving their competitiveness in the world economy. At present, neither the United States nor Mexican governments plan to change the program; in fact, the maquiladora industry is growing faster now than at any other time. Therefore, this research is relevant and timely, given that in the future the maquiladora industries will become a more
significant part of the U.S.-Mexican economy than it has been in the past.
Prior to 1986, there were 212 maquiladoras operating in Tijuana that employed approximately 30,250 production workers (San Diego Economic Development Corporation, 1989; United States International Trade Commission,
1986). Today, more than 500 maquiladoras are operating
in Tijuana, and Rodriguez (1987) expects that in the near future, 1,000 maquiladoras will employ more than 200,000 people. This tremendous economic growth and activity is spilling across the border into San Diego. Smith (1985) estimates that maquiladora-related economic activity in San Diego will create about 77,000 new jobs in San Diego and nearly 4,000 acres of industrial space related to maquiladora industries will be developed. Most of the industrial development is located in Otay Mesa, the border region of San Diego that, up until recently, has not been the target of much public or private
development.
The industrial development within the Otay Mesa Development District has increased significantly. Between 1985 and 1988, tentative maps for 2,300 acres had been approved. Within the city and county, total assessed value of Otay Mesa property increased from $120 million to $291 million in four years. The Otay Mesa Chamber of Commerce has identified 78 businesses operating on the Mesa. Approximately 50 percent of them are directly related to the maquiladora industry; another 25 percent are the result of the burgeoning secondary market for support industries (San Diego Economic Development Corporation, 1989).
The consensus of the San Diego business community is that benefits derived from the Maquiladora industries are: (1) a broadened economic base due to companies moving to San Diego to take advantage of the city's proximity to the maquiladora industries; and (2)
competitive advantage for San Diego business nationally and internationally due to the availability of cheap labor across the border (San Diego Economic Development
Corporation). As far as we know, however, no one has
conducted a detailed study that quantifies the linkages between Tijuana's maquiladora industries and San Diego's economy.
In this study, we estimate the employment, output, and income that is generated in San Diego as a result of San Diego acting as the supplier of inputs to Tijuana's maquiladora industry. These impacts are calculated using
a regional macroeconometric forecasting model for San Diego County. We begin the impact analysis with 1985 estimates and, based on trends and anticipated growth, forecast them to the year 2000.
Although many analysts, such as Fernandez-Kelly (1983), have investigated the social and economic impact that maquiladoras have in Mexico, very few have looked at the economic impact in the United States. George and Tollen (1985) studied the economic impact of the
drawn from the research done in El Paso cannot be
automatically extended to San Diego, because the cities of San Diego and El Paso differ in many ways (e.g., economic base) and the types of maquiladora industries
(e.g., size, organization, type of production) in Ciudad Juarez are very different from those in Tijuana.
Additionally, though the El Paso-Ciudad Juarez region has the largest number of maquiladoras, the San Diego-Tijuana
region has land on both sides of the border on which to build and has easy access to the Pacific Rim economy. Besides a survey report done by the San Diego Economic Development Corporation, we know of no study that
analyzes, in detail, the present and future economic impacts that the maquiladora industries in Tijuana, Mexico have in San Diego.
This research is significant in that the economic activity in San Diego and Tijuana reflects the dynamics of the emerging global economy. According to the staff at the San Diego Economic Development Corporation, of the 413 maquiladoras operating in Tijuana in June of 1988, 42 percent have U.S. parent companies located throughout San Diego county. Most of the new investment in the
maquiladora industries will come from major Japanese companies, such as NEC, Panasonic, Seiko Epson, Hitachi,
and others (United States International Trade Commission,
operations in the San Diego-Tijuana region as well. Many of these foreign firms set up operations in both Tijuana and San Diego, organizing production, finances, and
marketing in a way that maximizes the firms' production efficiency given the available resources.
Understanding the dynamics of the Pacific Rim
eccnomy is of the utmost importance if California and the rest of the United States want to stay competitive in the global economy. As a national leader and trend setter, California, we believe, is ahead of the rest of the
United States in recognizing that the Pacific Rim economy is the future center of the emerging global marketplace. The San Diego-Tijuana region has emerged as a place where American, Mexican, Japanese, and South Korean capital and technology can assemble in a very productive manner; the region has one of the fastest growing economies in the world.
During the 1980s, a great deal of attention had been given to U.S. competitiveness in the global economy. One major issue in this debate is the loss of U.S. jobs due to the relocating of U.S. manufacturing operations off-shore. Although we do not attempt to enumerate all of the jobs lost to off-shore operations and compare this with all of the jobs created by activities such as those in San Diego, we will look at what types of jobs are
being created in the United States due to off-shore manufacturing activities.
As we move toward a single global marketplace, the role of the state as regulator is being re-defined, and, as is the case in Europe in 1992, the role of national borders is becoming less important. We believe that the distinction between doing business in developed and
developing countries is also being re-defined. Telecommunications and the internationalization of production processes have given rise to a new way of
organizing and managing companies and investment
decisions. The case of the San Diego-Tijuana region is a microcosm of this larger, global restructuring. Although determining the economic impact that Tijuana's
maquiladoras have on San Diego's economy is but a small part of this process, it does add to our knowledge of how the process works.
We will determine what economic impacts (e.g., employment, income, and output) the maquiladora industries have in San Diego by using a regional
econometric forecasting model and data collected from local agencies in San Diego, specifically data from the San Diego Economic Development Corporation and the Otay Mesa Chamber of Commerce.
In Chapter 2, we discuss various economic models used to measure regional growth and the impacts of
exogenous factors on the region's economy and the REMI
model that we employ for our forecasting analysis. In
Chapter 3, we describe the San Diego metropolitan economy and the economy's structural changes that have taken
place between 1969 and 1985. In Chapter 4, we look at
the San Diego-Tijuana metropolitan economy and look at the growth of maquiladoras in Tijuana and related
industry in San Diego. In Chapter 5, we provide a detailed analysis of the REMI forecast and economic
impact analysis. In Chapter 6, we summarize the results
of the economic forecast and draw conclusions about the impact of the maquiladora industries in San Diego.
Chapter 2
Alternative Economic Models, Multipliers, and Regional Purchase Coefficients
In the past two decades, regional economic models have evolved as one of the key tools used in policy
analysis. Regional economic models "are used as
predictions where the planner wants some idea of the size and shape of the future in order that his current
decision can be responsive to the future" environment
(Sonenblum, as quoted by Glickman, 1977, p. 14). A major
use of regional economic models is to identify important sectors within an economy that have linkages with or impacts on other sectors; it is in this sense that we employ "impact" or "multiplier" analysis (Glickman,
1977). Three types of models are most often used for
impact analysis: input-output, econometric, and economic base. All three are discussed below and their relevance
to this research is discussed in the next chapter.
Economic Base Models
The economic base model can be characterized as a highly simplified general equilibrium model of a local economy. The assumptions are simple and the data
requirements are minimal. The model assumes that the economy is initially in equilibrium and describes a new equilibrium position after the exogenous change has been
transmitted through the system. Prices, wages, and technology are assumed constant, supply is perfectly elastic, and no changes are allowed to occur in the distribution of income or resources (Pleeter, 1980).
Economic base models dichotomize economic activity in a region into export and local service industries (Glickman refers to them as "basic and "service"
industries, respectfully). Economic base models view the
local economy as a consumer and a seller. Industries and
establishments within the local economy that cause funds to come in are considered to be export industries or sellers. These are firms that sell their products to businesses and households outside the boundaries of the
local economy. We also consider tourism facilities and federal and state government to be part of the export industry because they are responsible for money inflows
(Pleeter, 1980). Local service industries, by contrast,
sell their outputs only within the local economy;
therefore, the local economy does not grow, because funds are just being transferred between people within the
local economy.
Without new injections of funds to the local economy, the economy will be stagnant, since local
service industries can only respond to changes in local economic conditions. External changes that result in an increase in export activity cause increases in payroll
and employment in the export industries, which are then transmitted to the local service sector. Further, the inflow of money causes activity in local services to change by a multiple of the original stimulus as the new influx of funds is spent and re-spent in the local
economy. Recirculation continues until the leakages from the system, like imports, savings, and taxes, exhaust the amount of the initial influx. Similar, though opposite, effects occur in the case of a decrease in export
activity (Pleeter, 1980).
Input-Output Model
Input-output models provide a detailed account of the economic transactions that take place within an economy and illustrate how an impact originating in one sector is transmitted throughout the entire economy
(Pleeter, 1980). The basic input-output model is
generally constructed from observed economic data for a specific geographic region (nation, state, county, etc.). Within this specific geographic region, we are concerned
about the activity of a group of industries that both produce goods (outputs) and consume goods from other
industries (inputs) in the process of producing each
industry's own output (Miller and Blair, 1985). This
basic information from which an input-output model is developed is contained in an interindustry transaction
table. The rows of an input-output table describe the distribution of a producer's output throughout the
economy. The columns describe the composition of inputs required or purchased by a particular industry to produce its output (Miller and Blair, 1985).
In essence, the input-output model is a snapshot of the economy, which gives the current "recipe" for
producing all goods. Each industry in the economy is
dependent upon every other industry; firms either sell
their goods as an intermediate good to another firm or as a final good to consumers. Because input-output models are a snapshot of the economy at one specific time,
assumptions with regard to production functions and
supply are very specific. Production functions for each
industry are assumed linear and homogenous so that economies and diseconomies of scale are disallowed and inputs must be used in fixed proportions. Prices and wages are assumed constant and no supply constraints exist (Pleeter, 1980).
Econometric Models
More recently econometric models have become the most commonly used method of economic analysis. The ability to make forecasts given past trends or
relationships between variables has become a very
multiple-equation systems that attempt to describe the structure of a local economy and forecast aggregate variables, such as income, employment, and output. Econometricians usually employ time-series data
(observations of the same economic variables on a regular temporal basis) in constructing a model (Glickman, 1977). The time-series data are used to estimate the
hypothesized relationships by means of regression analysis.
There is no single theory of regional growth that is implicit in the development of econometric models.
Rather, models builders generally incorporate variables and specifications that are relevant to the region being analyzed. The more sophisticated econometric models consider both internal and external sources of growth or impacts within the regional economy. Prices and wages
for the region are determined within the system of equations postulated, and thus factor movements, in a neoclassical framework, can also be a consequence of
exogenous shocks to the system. One factor emphasized in these models is labor supply, and equations explaining labor force and migration are critical elements.
Consumption, government, and investment are specified by source (e.g., household, state and local, etc.) and thus considerable detail is provided (Pleeter, 1980).
Like the input-output model, the more complex or simultaneous models stress the interdependence of the
economic variables within the regional economy; that is,
each endogenous variable is determined, at least partially, by other endogenous variables. The
interdependence of the variables allows the analyst to observe or forecast how a shock in one sector transmits or ripples through the rest of the economy, sometimes by incorporating an input-output model into the regression model. These more complex models are generally used for
longer-run estimations of the economy's movement. They can incorporate aspects of changed structure, such as productivity change, demographic composition, and
industrial composition, and thus provide sources for growth that are absent in other models. Because
econometric models use regression principles based upon past relationships, they attempt to verify, empirically, the theory upon which they are based (Pleeter, 1980).
Multipliers
The notion of multipliers rests upon the difference between the initial effect of an exogenous (final demand) change and the total effects of that change. The total
effects can be defined in either of two ways -- as the
direct and indirect effects (which means that they would be found through elements in the Leontief inverse of a
model that is open with respect to households) or as direct, indirect, and induced effects (which means that
they would be found through elements of the Leontief inverse of a model that is closed with respect to
households). The multipliers that are found by using the
direct and indirect effects are also known as simple multipliers. When direct, indirect, and induced effects are used, they are called total multipliers (Miller and Blair, 1985).
The three most frequently used multipliers are those that estimate the effects of exogenous changes on (1) outputs of the sectors in the economy, (2) income earned by households because of the new outputs, and (3)
employment (in physical terms) that is expected to be generated because of the new outputs (Miller and Blair, 1985).
RIMS II
Effective planning for public- and private-sector projects and programs at the state and local area level requires systematic analysis of the economic impacts of the projects and programs on affected regions.
Systematic analysis of economic impacts, in turn, must take into account interindustry relationships within
regions because those relationships in large part determine regional responses to project and program
changes. Thus, regional input-output multipliers, which account for interindustry relationships within regions, are useful tools for regional economic impact analysis
(Beemiller et al., 1986).
RIMS II is based on an input-output accounting framework. A typical input-output table in RIMS II derives mainly from two data sources: (1) the Bureau of Economic Analysis' (BEA) national input-output table, which shows the input and output structure for more than
500 U.S. industries, and (2) BEA's four-digit Standard Industrialization Classification (SIC) county wage-and-salary data, which can be used to adjust the national input-output table to show a region's industrial
structure and trading patterns (Beemiller, et al., 1986). RIMS II can be used to estimate the impacts of
project and program expenditures by industry on regional output (gross receipts or sales), earnings (the sum of wages and salaries, proprietors' income, and other labor
income, less employer contributions to private pension and welfare funds), and employment (Beemiller, et al., 1986).
Regional Purchase Coefficient (RPC) Estimation
The regional purchase coefficient (RPC) has been defined as the proportion of a good or service used to fulfill intermediate and/or final demands in a region
that is supplied by the region to itself rather than
being imported (Stevens, et al., 1980). The construction
of a regional input-output model without the use of survey data presents the analyst with the difficult problem of estimating "regional" coefficients. Stevens
and Trainer suggest that the most efficient, and
potentially the most accurate, non-survey approach is to use the national input-output technology in the most detailed form available, along with a set of regional purchase coefficients (RPCs) specific to the region in question (Stevens, et al., 1980).
The REMI Model
The regional econometric forecasting model in this study is the San Diego Forecasting and Simulation Model SDFS-53 (referred to, hereafter, as REMI) produced by Treyz at Regional Economic Models, Inc. (REMI). REMI is a regional macroeconometric model for forecasting and simulating the aggregate economic behavior of
sub-national economies, usually states, for which the vendors
provide as a part of the package specific regional- data
the users request. Analysts can use the program for
economic-base or input-output modeling. They can conduct an extremely detailed analysis of regional impacts of government policies or impacts of anticipated changes in
economic variables by changing any of the policy or translator variables (Sivitanidou and Polenske, 1988).
REMI combines features from the various modeling techniques discussed above and can be used to make
economic forecasts and to simulate alternative policies or strategies. Its predictions and simulations are based
on the interaction of 2000 equations, which include 53 industrial sectors (including three government sectors and a farming sector) and 94 occupations. A very large number of economic policy changes can be analyzed through the use of policy and/or special "translator" variables. In all, 802 policy and 58 translator variables are
available for use singly or in combination. The San Diego version of REMI contains-time-series data for San Diego County beginning in 1965 and ending in 1985. Also imbedded in REMI is a regionalized input-output table using adjusted technical coefficients based on the 1977 national output table and a 1995 projected input-output table produced by the Bureau of Labor Statistics (the 1977 national input-output table is the latest one available based upon census data).
For policy simulations, the analyst uses two models: an input-output model and a fiscal-simulation (FS)
macroeconometric model. Depending on the impact to be simulated, the user can suppress one or more of six
responses: wage, labor intensity, export share, regional
purchase coefficient, population, or wage responses to the consumer price index (Sivitanidou and Polenske, 1988).
Chapter 3
The San Diego Metropolitan Economy In this chapter, we look at how the San Diego
Metropolitan economy has changed over time. In analyzing the structure of San Diego's economy, we focus on
employment, output, and income. As a method for
analysis, we disaggregate San Diego's economy into nine general industries in the private economy: (1)
manufacturing (durable and nondurable manufacturing), (2) finance, insurance and real estate (F.I.R.E.), (3)
services, (4) retail trade, (5) transportation and public utilities, (6) construction, (7) wholesale trade, (8)
agriculture-forestry-fishing, and (9) mining. We do not include the government sector in our analysis because we want to look at how the major industrial sectors are
affected by the maquiladora activity. The military is a very large part of San Diego's government employment, more so than most cities, and would show up as one of the
largest employment sectors. Rather than continually
explain that the government sector is large due to the large military employment, we simply delete it from the analysis; deleting the government sector from our
analysis will not prevent us from our stated task. The nine-sector analysis focuses on private sector economic activity and will serve as the springboard for our
maquiladora-related impact analysis.
An Overview of Economic Growth
In our historical nine-sector analysis, we look at a 16-year period between 1969 and 1985. We stop at 1985 because it is at this time that the substantial growth in Tijuana's maquiladora industries begins. Our impact
analysis takes place between 1985 and the year 2000 (this part of the analysis has its own detailed chapter).
Over the period of 1969-1985, San Diego's economy and population grew at an extremely fast rate. Table 1 shows that total employment grew about 3.8 percent a year, gross regional product (GRP) expanded about 4.4 percent a year, population increased about 2.9 percent a year and personal income climbed an amazing 11.6 percent a year. Graph 1 shows a bi-annual growth rate of GRP, personal income, population, and employment. It is
interesting to note that GRP and employment are fairly correlated, moving in tandem over the 16-year period. To understand better the dynamics and structure of this
rapidly growing metropolitan economy, we look at
employment, output, and income by sector and see how each sector relates to the economy as a whole.
Table 1
Bi-Annual Percentage Growth Rates of GRP, Personal Income, Total Employment, and Population
Item 1971 1973 1975 1977 1979 1981 1983 1985
GRP 4.7 12.5 6.3 11.9 15.3 1.2 5.7 16.2
Income 18.1 23.3 25.6 7.7 32.7 22.8 16.4 22.4
Employment 0.3 8.8 6.4 11.0 14.4 5.3 4.1 13.2
Population 3.8 7.7 7.8 6.1 6.5 5.3 4.8 5.5
Note: GRP is measured in 1977 dollars.
Income is measured in nominal dollars.
Source: Author's calculations using data from REMI.
Employment
Table 2 shows the distribution of employment for the nine sectors. The service sector employs the largest number of workers, and the retail trade, manufacturing, F.I.R.E., and construction sectors round out the top five sectors, respectively. The two least important sectors with respect to employment are the agriculture-fishing-forestry and mining sectors. Over the 16-year period, every sector gained more workers every year with the exception of the construction sector, which is more susceptible to cyclical exogenous changes in the macro
Graph 1. Bi-Annual Growth Rates for GNP, Personal Income, Total Employment, and Population 35 30 25 P NGRP e 20 r [Persona( Income c e *Total Employment n 15 t Opopulation 10 5 Note: GRP is in 1977 Dollars
Personal Income is in nominaL
0 IDotlars
1971 1973 1975 1977 1979 1981 1983 1985
Year
Table 2. Total Employment (thousands of people) Sector 1969 1971 1973 1975 1977 1979 1981 1983 1985 Manufacturing 70.3 63.8 72.1 73.4 78.9 103.5 113.3 111.6 127.1 F.I.R.E. 30.0 36.1 44.8 46.2 57.5 70.1 74.5 83.2 98.8 Services 102.5 116.5 133.4 148.3 171.1 206.4 225.2 248.5 295.5 'Retail Trade 82.3 89.3 100.3 109.6 123.9 144.8 149.3 157.7 177.3 T.P.U. 20.0 21.8 23.7 24.2 26.2 30.7 32.6 33.6 36.1 Construction 25.2 27.3 32.8 29.8 41.7 52.3 45.3 44.3 61.6 Wholesale Trade 15.1 14.9 17.5 18.5 22.9 26.8 28.9 33.2 38.1 A.F.F. 4.8 5.3 6.8 7.7 8.5 10.0 11.3 12.6 13.8 Mining 0.7 0.7 0.7 0.8 1.1 1.2 1.3 1.7 1.9
Note: F.I.R.E. = Finance, Insurance, and Real Estate
T.P.U. = Transportation and Public Utilities
A.F.F. = Agriculture, Fishing, and Forestry
economy. Among the sectors with the highest increase of employment are services, retail trade, F.I.R.E.,
manufacturing, and construction. As shown in Graph 2,
these five sectors added employees over the 16-year
period of approximately 193,000, 95,000, 68,800, 56,800, and 36,400 respectively.
Graph 3 shows the top five sectors as a percentage
of total employment between 1969 and 1985. We see that
the service sector dominates as the leading sector of employment and continues to grow in importance, going from 16.2 percent in 1969 to 21 percent in 1977 and 25.6
percent in 1985. The retail trade,- manufacturing, and
construction sectors have maintained their positions in a fairly consistent manner over the 16-year period--about
15 percent, 11 percent, and 5 percent, respectively. The F.I.R.E. sector has steadily increased its position from
4.6 percent in 1969, to 7.1 percent in 1977, and to 8.6 percent in 1985.
Output
Although employment within a sector is one way to gage the importance of a sector, output within a sector is another; therefore, we need to compare and contrast employment versus output by sector. For example, in 1985, the manufacturing sector accounted for 11 percent of total employment but was responsible for about 32
Graph 2. Growth in Employment: Top Five Sectors EManufacturing [FIRE +Services <)Betai t Trade -Construction FIRE = Finance,
Insurance, and Real Estate
Source: Author's calculations using data from REMI. 300
1969 1971 1973 1975 1977 1979 1981 1983 1985
Graph 3. Top Five Sectors as a Percent of Total Employient M services ORetail Trade * Manufacturing E FIRE
o
Construction 30.00% 25.00% 20.00% 15.00% 10.00% 5.00% 0.00%Source: Author's calculations using data from REMI.
Note: FIRE = Finance, Insurance, and Real
Estate
1969 1971 1973 1975 1977 1979 1981 1983 1985
percent of total output. Therefore, any changes in employment or output in one sector need to be put into perspective with the larger economy.
Total output of the nine sectors in 1969 was 11.5 billion dollars, growing to 18.7 billion dollars in 1977 and 30.4 billion dollars in 1985, a 164.3 percent
increase over the sixteen-year period, or 6.3 percent a year.' As shown in Graph 4, the manufacturing, services,
and F.I.R.E. sectors make the largest contributions to output with 32 percent, 19 percent, and 18 percent in
1985, respectively, accounting for about 70 percent of total output.
Theoretically, a person's wage should be
commensurate with his or her level of productivity;
therefore, gains in productivity should increase people's purchasing power. Productivity represents the dollar value of output per employee. The sector with the highest productivity level is the mining sector, but
since its total output and employment are too small to be significant, we can disregard this sector in the
analysis. We obviously want to focus our analysis on sectors in the economy that significantly contribute to both employment and output. Graph 5 shows the
productivity levels of employees by sector for 1969, 1977, and 1985. As we can see, the manufacturing,
'All output is in billions of 1977 dollars. 28
Graph 4. Sector Output as a Percent of Total
35.00% Manu = Manufacturing
FIRE = Finance, Insurance, and Real Estate
30.00% -Serv = Services
Retail = Retail Trade
25.00%
TPU = Transportation and Public Utilities
Con = Construction
*
1969Whole = Wholesale Trade 0 1977
AFF = Agriculture, Fishing, and Forestry 0 1985
10.00%
0.00% II
Manu FIRE Serv Retail TPJ Con Whole AFF Mining
Sector Source: Author's calculations using data from REMI.
Graph 5. Output per worker by Sector: 1969, 1977, and 1985
Manu. = Manufacturing
F.I.R.E. = Finance, Insurance, and Real Estate
Serv. = Services
Retail = Retail Trade
T.P.U. = Transportation & Public Utilities Con. = Construction
Whole. = Wholesale Trade
A.F.F. = Agriculture, Fishing, & Forestry
40000
20000
-Manu. F.I.R.E. Serv. Retail T.P.U. Con.
Sector Source: Author's calculations using data from REMI.
Whole. A.F.F. Mining 200000 180000 160000 140000 120000 100000 80000 60000 N 1969
o
1977 M 1985F.I.R.E., and transportation and public utilities sectors have the highest productivity levels during the 16-year period. An interesting and important note is the
steadily increasing productivity of the manufacturing sector. In fact, in 1985, the manufacturing sector is the only sector with significant gains in productivity. This is important because we will later focus on the manufacturing sector when we discuss the impact of Tijuana's maquiladora industries on the San Diego
economy.
Advances in productivity can stem from a variety of factors, including changes in technological innovation (both process and product innovation), improved work force- skills through either training or experience, and investment in the capital stock of the economy.
Productivity improvement is essential for a rapidly
expanding economy such as San Diego's. If people's
purchasing power does not increase as productivity
increases--supply growing faster than demand in the short run--recessionary pressure could slow investment, thus slowing the economy's growth in the long run.
Income
By looking at the total output, productivity, and employment of a sector, we can form a more accurate picture about the economic structure of San Diego.
Another factor that helps us understand the importance of a sector is the income that it generates, and, in turn, the income earned by its employees. As mentioned above, income is directly related to the productivity and output generated within a sector. The more productive a worker is, the more income or higher the wage should be for that worker.
If we look at Graph 6, we see the breakdown of the average income per worker by sector for 1969, 1977, and
1985. If we focus on the significant sectors (ignoring
the mining sector that has an unusually high average income per worker), we see that the transportation and public utilities, construction, manufacturing, and
wholesale trade sectors have the highest average income
per worker, respectively. If we compare the average
income per worker to the output per worker, or productivity, shown in Graph 5, we see that the manufacturing, transportation and public utilities,
wholesale trade, and construction sectors are in the top
five significant sectors. Surprisingly, the F.I.R.E.
sector is a relatively productive sector--third behind manufacturing and transportation and public utilities--yet it is not in the top five significant sectors with respect to average income per worker.
We think that when looking at income generated
Graph 6. Average Income Per Worker
Manu = Manufacturing
FIRE = Finance, Insurance, and Real Estate
Serv = Services
TPU = Transportation and Public Utilities Con = Construction
Whole = Wholesale Trade
AFF = Agriculture, Fishing, and Forestry_
0o1969
D 197 131985 50000 45000 40000 35000 30000 25000 20000 15000 10000 5000 0Manu FIRE Serv Retail TPU Con Whole AFF Mining
Sector Source: Author's calculations using data from REMI.
income per worker because this translates to the
purchasing power for a given worker. Often, the mass. media just reports on job creation and unemployment rates. Over the past decade, the focus of the Reagan administration was on job creation. Yet, the types of jobs being created have not necessarily been high-paying jobs, whereas the jobs being lost have been (Harrison, 1988).
In illustrating the importance of income per worker versus employment or income per sector, we can look to Graph 7 which shows labor and proprietor's income per sector (this is the same income used to calculate average
income per worker). We can see that the service sector,
by far, creates the most labor income. In 1985, the
service sector's labor income was 5.27 billion dollars compared to the combined labor income for the F.I.R.E., retail trade, and transportation and public utilities
sectors of 4.6 billion dollars.2 However, if we look
back to the average income per worker, the service sector falls well below the transportation and public utilities, construction, manufacturing, and wholesale trade sectors, thus indicating that most service sector jobs are not high paying or very productive.
2
Labor and proprietor's income is in billions of nominal dollars.
Graph 7. Labor and Proprietor's Income: 1969, 1977, and 1985
Manu = Manufacturing
FIRE = Finance, Insurance, and Real Estate Serv = Services
Retail = Retail Trade
TPU = Transportation and Public Utilities
Con = Construction Whole Wholesale Trade
AFF = Agriculture, Fishing, and Forestry
f B 0 n s
101969
51985Manu FIRE Serv Retail TPU Con Whole AFF Mining
Sector Source: Author's calculations using data from REMI.
We need to keep our evaluation indicators in
perspective when trying to understand the importance of a sector within the larger economy, especially when we are analyzing the impact of an exogenous activity on the
structure of the economy. In trying to decide which
indicators to use in an impact analysis, we must refer to the question or questions initially being asked and then devise an appropriate approach to answer these questions.
In our impact analysis of the maquiladora industries on San Diego's economy, just looking at how many jobs are being created or lost is not enough. We want to
know what types of jobs are affected and how these jobs influence the whole economy. Do these jobs contribute to increasing San Diego's productivity or does it just add
another low-paying, low-productive job? If San Diego
becomes too dependent on a particular sector, say
services, does the economy face problems in the future when it faces competition from other regional economies
that are more productive? It is in this regard that the
types of indicators we use to analyze an impact on the economy become more or less relevant to our analysis. We will come back to the relevance of particular indicators when we analyze the impact of Tijuana's maquiladora
industries on the San Diego economy.
Chapter 4
San Diego and Tijuana:
A Transnational Metropolitan Economy
In this chapter we look at the relationship between San Diego and Tijuana and the symbiotic relationship that exists between the two cities. We look in detail at the growing maquiladora industries in Tijuana, discuss why the San Diego-Tijuana metropolitan region is growing in popularity with respect to other maquiladora regions, and look at San Diego's role as a supplier of inputs to
Tijuana s maquiladoras.
An Overview of Tijuana
According to the International Demographic Data Center of the U.S. Bureau of Census, in its official census of 1980, the Mexican government estimated Tijuana's population to be about one-half million.
However, it is widely accepted that any official estimate of Tijuana's population will be on the low side. In a
September 1987 survey of Mexico, The Economist estimated
that Tijuana's population was somewhere between 1.2 and 1.5 million. Max Schetter of the Greater San Diego Chamber of Commerce estimates that by 1995, there will probably be as many people in Tijuana as in the County of
San Diego--about two and one-half million people on each
side of the border, or five million in the total metropolitan area.
The sharing of production between the two countries has led to growth in trade, not only in finished
products, but also in intermediate goods going in both directions. This changes the traditional concepts of imports and exports because both are part of the same
process (Woodlands Conference, December 1989). The
industrial integration that exists between San Diego and Tijuana has taken place primarily through private
initiative. The governmental arrangements that have
taken place on both sides of the border have made the San Diego-Tijuana region desirable for location or
re-location of private industry. On the Tijuana side, the Border Industrialization Program established in 1965
allows certain industries--maquiladoras--to import inputs so long as the final product is then exported.
On the San Diego side, the U.S. government
classifies the maquiladora-produced goods as items 806.30 and 807.00 under the provisions of the Tariff Schedules
of the United States. Items 806.30 and 807.00 are
assessed for U.S. Customs duties on the basis of the value that is added in Mexico (Maquiladora Resource
Guide, 1989). San Diego also has a free trade zone.
Products shipped to a free trade zone do not require formal customs entry, and are not subject to the payment
of duty and excise taxes nor to quota restrictions. While in the free trade zone, the product may be
processed, assembled, or manipulated and if the product is then reexported, no U.S. Customs duty or excise tax is
ever paid. If the product enters the domestic market
after leaving the free trade zone, U.S. Customs duty
and/or excise taxes are payable on either the rate of the finished products or the imported parts, whichever is lower (Maquiladora Resource Guide, 1989).
The term "maquiladora" comes from the Spanish word "maquila," which in colonial Mexico was the charge that millers collected for processing grain. Today the term maquiladora is used as a generic term for those firms that process components imported into Mexico that are then reexported, usually back into the United States. Another term frequently associated with the maquiladoras is "twin plant," which refers to the existence of two factories, one on either side of the border, involved in complementary phases of production and assembly of a given product (Maquiladora Resource Guide, 1989).
One key factor linking San Diego to Tijuana is that San Diego supplies a considerable amount of the inputs to Tijuana's maquiladoras. Tijuana has no local content regulation, though maquiladoras are continually urged by the Mexican government to purchase local inputs. Apart from direct labor, however, inputs to maquiladora
products, whether finished or semi-finished goods, are only about 1.5 percent Mexican (Maquiladora Resource Guide, 1989).
The Mexican government's drive to stimulate the production of inputs for the maquiladora industries has
led to a new round of investment in what are called
"in-bond" supply companies. In Tijuana, many of the same
foreign companies that operate maquiladoras are now
establishing in-bond supply operations; this practice is particularly noticeable among large Japanese firms
(Maquiladora Resource Guide, 1989). In-bond companies
manufacture component products required in other
maquiladora assembly processes. Many times the in-bond company is established by the same parent company of the foreign subsidiary or its supplier. Under such
arrangements, the foreign parent company provides the in-bond company with the necessary technology and financial support to become an efficient supplier. Thus, the
demand for qualified suppliers within Mexico has created a whole new round of investment in the border region
(Maquiladora Resource Guide, 1989).
The Growth and Composition of Tijuana's Maquiladoras The staff at the San Diego Economic Development Corporation estimate that today, Tijuana has between 500 and 520 maquiladoras in operation. As of June 1988, 413
Tijuana maquiladoras had registered and received authorization from Mexico's Secretaria de Comercio y Fomento Industrial Delegacion (SECOFI) to operate under the maquiladora program (San Diego Economic Development
Corporation, 1989). Table 3 shows the number of
maquiladora plants operating in Tijuana since 1986.
There is every indication that this growth will continue. In a study conducted by San Diego State University,
Department of Mexican American Studies, 61 percent of the maquiladoras in Tijuana indicated that they plan to
invest in new facilities or expansion projects both in San Diego and Tijuana (Morales, 1989, as quoted by the
San Diego Economic Development Corporation). As of June
1988, Tijuana's 413 maquiladoras employed about 45,000 workers with the median firm employment size of about 45 employees and an average size of 109 employees--only 3 percent employ more than 500 (San Diego Economic
development Corporation, 1989). We assume that the firm
sizes have remained the same since June 1988, which would mean that the 107 or so new maquiladora firms added about another 20,000 workers.
Table 3
Number of Maquiladoras Operating in
Approval Date Prior to 1986 January to June 1986 July to December 1986 January to June 1987 July to December 1987 January to June 1988 July 1988 to January 1990' Total # of Firms 212 31 40 35 45 50 107 520
SOURCE: Subdelegacion de Fomento Industrial (SECOFI),
Tijuana, B.C., October 1988, as reported by the San Diego Economic Corporation in a report entitled "Maquiladora
Industry: The Economic Impact on San Diego's Economy," June 1989.
For analytical purposes, we have disaggregated the maquiladoras into eight industrial classifications with the relevant two-digit Standard Industrial Classification codes in parentheses: Electronics and Electrical Products
'The number of maquiladoras established between July 1988 and January 1990 are estimates as per an interview with the staff at the San Diego Economic Development Corporation in January,
1990. Tijuana % Total 41 % 59 % 100 %
(52-55), Wood and Paper Products (30-32), Textiles,
Apparel and Leather (26-28), Plastic Products (42), Metal and Steel Products (46-50), Chemical, Rubber, Synthetic and Glass Products (33-45), Auto Parts and Products (56-58), and Other (16, 19, 51, 59, 60).
Graph 8 shows the size distribution of Tijuana's maquiladoras. About 54 percent of the firms employ 49 workers or less, 22 percent employ between 50 and 99, 21 percent employ between 100 and 499, 2 percent employ between 500 and 999, and 1 percent employs over 1,000 workers. The relatively small size of Tijuana's
maquiladoras is very different from the very large maquiladora operations in the El Paso-Ciudad Juarez maquiladora region in which the average firm employs about 4,800 workers (United States International Trade
Commission, 1986). The emerging need for flexibility in
the production process (e.g., just-in-time inventory, "flexible specialization," and market niche
specialization) makes small firm size a necessity,
something that large infrastructure and capital overhead cannot handle. This style of production structure and management is the dominant form in California, especially in the electronics and computer industries which is the dominant type of maquiladora in Tijuana.
Graph 8. Distribution of Maquiladoras by Number of Employees 2% 54% 21% Number of workers: aO - 49 050 - 99 M 100- 499 *500 - 999 E10oo0+ 221
Graph 9 shows maquiladora employment broken down by industry. The electrical and electronic products firms employ about 45 percent of maquiladora workers, wood and paper products about 16 percent, textiles, apparel and leather about 7 percent, plastics products about 7 percent, metal and steel products about 5 percent, chemical, rubber, synthetic and glass products about 7 percent, auto parts and products about 2 percent, and the other various firms about 11 percent.
Graph 10 shows the industrial distribution of
Tijuana's maquiladoras as a percentage of the number of firms. About 26 percent of the firms produce electrical and electronic products, 20 percent produce wood and paper products, 14 percent produce textiles, apparel and
leather goods, 13 percent produce metal and steel
products, 8 percent produce plastic products, 7 percent produce chemical, rubber, synthetic and glass products, 4 percent produce auto parts and products, and the
remaining 8 percent produce other goods.
Because the significant emergence of the
maquiladoras in Tijuana is a relatively new phenomena (e.g., 60 percent growth in the number of maquiladoras since 1985), many of their attributes reflect new ways of organizing and managing production facilities. This is very different from the large, mass-production facilities
Graph 9. Industrial Distribution of Maquiladoras as a Percent of Total Employment
11%
16%
Source: San Diego Economic Development Corporation.
E Electrical & Electronic Products (52-55) 0 Wood & Paper Prockucts (30-32)
ETextiles, Apparel & Leather (26-28) U Plastic Products (42)
0 Metal & Steel Products (46-50)
EiChemical, Ribber, Synthestic & Glass (33-45)
M Auto Parts & Products (56-58)
Graph 10. Industrial Distribution of MaquiLadoras as a Percent of Total Firms 8%
4% N.A 26%
13%
14% 'T ..
Source: San Diego Economic Development Corporation.
20%
0 Electrical & ELectronic Products (52-55) 0 Wood & Paper Products (30-32)
U Textiles, Apparel & Leather (26-28)
UPlastic Products (42)
lMetal & Steel Products (46-50)
6
Chemical, Rubber, Synthestic & Glass
(33-45)
I Auto Parts & Products (56-58)
3 Other (16, 19, 51, 59, 60)
of the El Paso-Ciudad Juarez maquiladora region, which reflects the structure and style of production that was evident during the late 1960s and early 1970s--precisely when Ciudad Juarez began to grow as a maquiladora city.
San Diego as Supplier of Inputs to the Maquiladoras Based on data from the Mexican Director of Statistics, as quoted by the San Diego Economic
development Corporation, between 1985 and 1987 the amount of component parts and materials imported by Tijuana
maquiladora plants increased by 70 percent. In 1987, the
dollar value exceeded $900 million (see Table 4). The
amount imported by Tijuana maquiladoras is expected to be even higher in 1988--the third quarter already shows a 55 percent increase over the same time period in 1987.
Table 4
Tijuana Maquiladora Industry Imports and Exports
1985-1988
Imports Percent Exports Percent
($M) Increase ($M) Increase
1985 530.7 682.1
1986 628.7 18 801.1 17
1987 901.1 43 1093.1 36
1988 873.3 554 1066.7 565
SOURCE: Datos de la Direccion General de Estadistica, I.N.E.G.I., S.P.P. (Mexican Director of Statistics), December 1988, as reported by the San Diego Economic Development Corporation in a report entitled,
"Maquiladora Industry: The Economic Impact on San Diego's Economy," June 1989.
As a port of entry, Tijuana ranks second--behind Ciudad Juarez--among border cities. The San Diego
Economic Development Corporation estimates that between 1985 and 1987, the total value of goods imported by
Tijuana maquiladoras has been increasing at a faster rate
'Percent increase is from 3rd quarter 1987 to 3rd quarter 1988.
"Percent increase is from 3rd quarter 1987 to 3rd quarter 1988.
than Ciudad Juarez--64.4 percent compared to 22.5 percent.
Although we do not know exactly how much of
Tijuana's imports come from San Diego, a recent survey of maquiladoras conducted by San Diego State University
indicated that, on average, approximately 24 percent of materials sourced for Tijuana maquiladoras was from San Diego. Using a weighted average, based on employment
size,6 the percent sourced from San Diego drops to 9
percent. That large of a drop indicates that the percent of total imports going to the larger maquiladoras
(relative to employment) is less than that of the smaller
ones. Information about the volume or dollar value of
materials sourced from San Diego, is not known. Although, the larger maquiladoras source a smaller
percentage of their materials from San Diego, the dollar value may exceed that of the smaller maquiladoras because the larger firms purchase larger volumes of inputs (San
Diego Economic Development Corporation, June 1989). It
is our attempt to estimate the value of maquiladora
imports from San Diego in an effort to analyze the impact they have on the San Diego economy.
'The weighted average was calculated as follows: For each maquiladora, the percent sourced from San Diego was multiplied by its number of employees. The sum of those values was then
divided by the total number of employees producing a weighted average based on employment size.
Although the focus of our analysis is on the economic impacts that result in San Diego because San Diego supplies a large portion of the input demands by Tijuana's maquiladora industries, we must mention that a great deal of other activities are taking place due to the maquiladora activities in Tijuana. In November of 1989, the Otay Mesa Chamber of Commerce carried out a demographic survey of companies in Otay Mesa. At that
time, 85 companies were located in Otay Mesa. Of these 85 companies, 25 have maquiladora operations in Tijuana and another 20 are directly related to the maquiladora industry (e.g., customhouse brokers, maquiladora holding company, and operators of the foreign trade zone);
therefore, 53 percent of the companies in Otay Mesa are directly linked to Tijuana's maquiladora industries. Six companies not counted as directly linked to Tijuana's maquiladora industries are involved in real estate
development and marketing. Given the growth of
industrial space and development around the free trade zone and the relative absence of residential development in that region, we can assume that these six real estate development companies are indirectly linked to Tijuana's maquiladora industries. The jobs created due to these kinds of linkages to the maquiladoras are important, nevertheless our focus is on the impacts related to the
supplying of inputs to Tijuana's maquiladora industries directly.
Chapter 5
Forecasting the Impact of Tijuana's Maquiladoras on San Diego
In this chapter, we get to the heart of our research in forecasting the growth of Tijuana's maquiladoras and analyzing the impact of this growth on San Diego's
economy and, in this context, look at the quantitative linkages between the two cities. The first part of this analysis is the estimation of continued growth rates of both the number of maquiladoras in Tijuana, and the growth of imports by Tijuana's maquiladoras. The
estimations are based on past trends in growth rates and the assumptions in the analysis are described in detail. The second part of the analysis involves a sensitivity
analysis using the estimated growth in imports to
Tijuana's maquiladoras from San Diego and looking at how the various industrial sectors in San Diego are affected. The impact analysis requires a degree of flexibility on our part. We will bound our analysis by using two growth rates in Tijuana's maquiladora activity and look at the impact in San Diego for both alternatives. By looking at two alternatives, we can compare the impacts in San Diego and determine how sensitive San Diego's economy is with respect to the exogenous activity in Tijuana.
Future Growth in Tijuana's Maquiladoras
Based on past growth rates of the number of maquiladoras in Tijuana and their dollar value of
imports, we estimate the number of maquiladoras and their value of imports in the future. We see that there is a 19.7 percent average annual growth rate for the observed years between 1985 and 1989. Graph 11 shows three growth estimates; the first is based on the past growth rate of almost 20 percent annual growth, the next two are
estimates that we think are more reasonable and fit more closely with what industry analysts think. Our first growth estimate varies from year to year but has an
average annual growth rate of about 14 percent (hereafter referred to as the 14 percent growth estimates); the
second is a simple 8 percent annual growth each year. Table 6 shows the estimations for the number of maquiladoras in Tijuana each year between 1990 and the year 2000 by calculating a 19.6 percent growth each year over the ten-year period. These numbers are difficult to accept; sustaining a nearly 20 percent growth rate for the next ten years is highly unlikely. If we look at the estimated growth rate in maquiladoras in Table 6, we see that in the five-year period from 1990 to 1995, the
number of maquiladoras almost triples from 622 to 1,530, and by the year 2000, the number will have grown to about 3,760. These growth estimates do not come anywhere close
to what industry analysts believe; they tell us that by 1995, there should be about 1,000 maquiladoras in
Tijuana, not 1,500 (Rodriguez, 1987). Because these
numbers are not reasonable, we will not use them in our forecast assessment, but rather our 8 and 14 percent estimates.
Table 6
Estimated Growth of the Number of Tijuana's Maquiladoras Based on the Past Growth Rate of 19.6%: 1990-2000
Year Number of Maquiladoras
1990 622 1991 745 1992 892 1993 1068 1994 1278 1995 1530 1996 1831 1997 2192 1998 2623 1999 3140 2000 3759