HAL Id: hal-02742895
https://hal.inrae.fr/hal-02742895
Submitted on 3 Jun 2020
HAL is a multi-disciplinary open access
archive for the deposit and dissemination of
sci-entific research documents, whether they are
pub-lished or not. The documents may come from
teaching and research institutions in France or
abroad, or from public or private research centers.
L’archive ouverte pluridisciplinaire HAL, est
destinée au dépôt et à la diffusion de documents
scientifiques de niveau recherche, publiés ou non,
émanant des établissements d’enseignement et de
recherche français ou étrangers, des laboratoires
publics ou privés.
QTL detection for excretion traits in broilers
Sandrine Mignon-Grasteau, Bernard Carré, Irène Gabriel, Nicole Rideau,
Céline Chantry-Darmon, Marie Yvonne Boscher, Denis Bastianelli, Nadine
Sellier, Marie Chabault-Dhuit, Elisabeth Le Bihan-Duval, et al.
To cite this version:
Sandrine Mignon-Grasteau, Bernard Carré, Irène Gabriel, Nicole Rideau, Céline Chantry-Darmon,
et al.. QTL detection for excretion traits in broilers. 10. World Congress on Genetics Applied to
Livestock Production (WCGALP), Aug 2014, Vancouver, Canada. 122 p. �hal-02742895�
Proceedings, 10th World Congress of Genetics Applied to Livestock Production
QTL Detection for Excretion Traits in Broilers
S. Mignon-Grasteau1, B. Carré1, Irène Gabriel1, Nicole Rideau1, Céline Chantry-Darmon2, Marie-Yvonne Boscher2,3, Denis Bastianelli4, Nadine Sellier5,6, Marie Chabault-Dhuit1, Elisabeth Le Bihan-Duval1, A. Narcy1
1UR083 Recherches Avicoles, INRA, 37380 Nouzilly, France, 2 INRA, LABOGENA, Domaine de Vilvert, 78352 Jouy en
Josas cedex, France, 3 UAR-DRH, INRA, 147 rue de l'Université, 78338 Paris cedex 07, France,4 CIRAD-SELMET, Systèmes d'élevage méditerranéens et tropicaux, Baillarguet TA C-112/A, 34398 Montpellier cedex 05, France, 5 UE1295
PEAT, INRA, 37380 Nouzilly, France, 6 Institut Sophia Agrobiotech, Inra PACA, 400 route des chappes, BP 167, 06903 Sophia Antipolis Cedex, France
ABSTRACT: Digestive efficiency (DE) has a large impact
on excretion traits and on environmental impact of poultry production. A F2 cross between 2 lines of chickens divergently selected on DE has been used to detect QTL. A total of 865 birds were measured for the quantity of fresh and dry excreta as raw values (FEW, DEW) or as relative to consumption values (FEWC, DEWC), for water content (WC), pH (PHE) and nitrogen to phosphorus content ratio (NP) of excreta, and for pH of gizzard and jejunum contents (PHG, PHJ). Eleven QTL were found for: DEW (GGA19, GGA26), FEWC (GGA8), DEWC (GGA16), NP (GGA11, GGA26), WC (GGA28), PHG (GGA2, GGA16, GGA27), PHJ (GGA19). On chromosomes 16 and 27, QTL co-localized with QTL for DE. On chromosomes 8, 16 and 26, QTLs for excretion traits co-localized with QTLs for relative intestine length.
Keywords: poultry; QTL; excretion; feed efficiency;
digestibility; environment
Introduction
Digestive efficiency is a component of feed efficiency which has a great impact both on performance and on excretion and then on environmental impact of poultry production, especially when birds are fed with diets including suboptimal feedstuffs. Mignon-Grasteau et al. (2004) selected two divergent lines for a high (D+) or low (D-) digestive efficiency (DE) using a wheat variety difficult to digest. After 8 generations, the difference between D+ and D- birds for DE was 30 to 40% depending on experiments (Carré et al., 2008, de Verdal et al., 2011a). De Verdal et al. (2013) showed that excretion was 56 to 61% higher in D- than in D+ lines. Nitrogen and phosphorus excretion rates were also 13 to 30% higher in D- birds. Taking into account European regulation on manure spreading, it implies that rearing D+ birds requires only 50% of the surface needed for D- birds to spread manure.
In order to understand the genetic architecture of DE and to provide markers that could be used in selection schemes, a QTL detection has been undertaken in a F2 cross between these D+ and D- lines, which revealed the existence of 9 QTL for DE (Tran et al., 2014). During this program, a large panel of phenotypes has been recorded, including a set of traits related to the quantity and to the composition and physical characteristics of excreta known to influence the transformation of excreta into manure. Water content and pH of excreta are for example important
for the development of bacteria implied in the production of ammonia affecting the final N content of manure (Lefcourt and Meisinger, 2001). The ratio of nitrogen to phosphorus has also to be considered as it determines the surface required for manure spreading according to regulations. The goal of the present study was to detect QTL for traits related to excretion in this F2 population.
Materials and Methods
Animals. A total of 865 male and female birds
were used in this study, coming from a F2 cross between D+ and D- lines divergently selected for DE at 3 weeks. There were hatched between January and June 2009 from 6 F1 sires and 60 F1 dams. Birds were reared on floor until 10 d and transferred to individual cages from 10 to 23 d. They were fed ad libitum with a diet containing 52.5% of Rialto Wheat, 21.1% CP and 3,110 kcal.kg-1 DM.
Data. A total collection of excreta was performed
between 17 and 20 d to measure DE. Excreta were weighed individually (FEW) and their pH measured (PHE). Excreta were freeze-dried and weighed again (DEW). Individual feed intake was also measured during the same time span and the fresh and dry excreta weights relative to feed intake calculated (FEWC, DEWC). The water excreta content (WC) was measured as the difference between FEW and DEW divided by FEW. The nitrogen content of excreta was measured for all birds using near-infrared spectrophotometry (NIRS; Foss NIRSystems, Inc., Silver Spring, MD), using the method of Bastianelli et al. (2010). Phosphorus content of excreta was measured by colorimetric analysis. The ratio of nitrogen to phosphorus content of excreta was calculated (NP). At 23 d, a sample of blood was taken on each bird for genotyping. Birds were slaughtered and the content of their gizzard and jejunum removed and homogenized before pH measurement (PHG, PHJ).
All F0, F1 and F2 animals were genotyped on 6,000 SNP by mean of the dedicated Illumina Infinium custom array. These 6,000 SNP markers were distributed on 28 autosomes, on 1 unassigned linkage group and on the Z chromosome. Markers deviating from the Hardy-Weinberg equilibrium within families or presenting inconsistent genotyping relative to pedigree or genetic map information were discarded from the analysis. Finally, 3,379 markers were used. The genetic map was deduced from the physical position of the SNP markers and from the genetic
consensus reference map published by Groenen et al. (2009). This set of markers covers 3,099.1 cM.
Statistical analyses. An analysis of variance was
performed with the PROC GLM of SAS to correct data for effect of hatch (N=5), sex, rearing cell (N=3), cage row (N=3) and data were corrected for significant effects before QTL detection. QTL detection was carried out with the QTLMap software (Filangi et al., 2010) using a half-sib model (Le Roy et al., 1998, Elsen et al., 1999) with interval mapping based on maximum likelihood estimations (Lander and Botstein, 1989). For each trait on each chromosome, the significance threshold at the chromosome-wide level was calculated from the results of 5,000 simulations of performance under the null hypothesis, with a trait heritability estimated on our design (Table 1). The genome-wide value was derived from the chromosome-genome-wide p-value using an approximate Bonferroni correction (Tilquin et al., 2005). Confidence intervals for QTLs (95%) were estimated using the LOD drop-off method as proposed by Lander and Botstein (1989). The significance of the QTL effects within each sire family was tested using a Student test, by assuming an equal distribution of the QTL alleles in the progeny. A QTL effect was retained as significant for Student test p-values <0.05, and the corresponding sire families were assumed to segregate for this QTL. These familial substitution effects were estimated in families found to significantly segregate for the QTL.
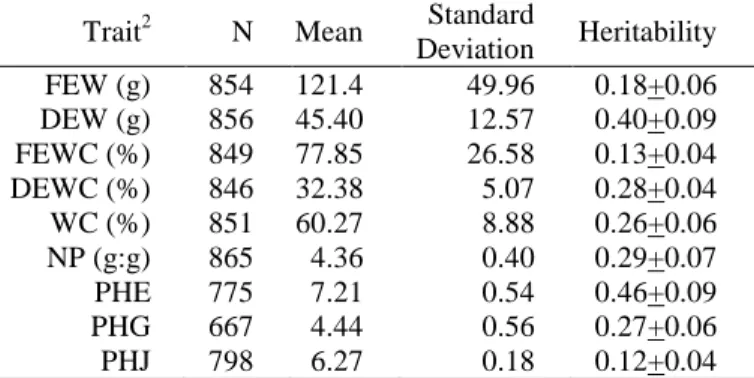
Table 1. Elementary statistics on corrected data1 and heritability on excretion-related traits.
Trait2 N Mean Standard
Deviation Heritability FEW (g) 854 121.4 49.96 0.18+0.06 DEW (g) 856 45.40 12.57 0.40+0.09 FEWC (%) 849 77.85 26.58 0.13+0.04 DEWC (%) 846 32.38 5.07 0.28+0.04 WC (%) 851 60.27 8.88 0.26+0.06 NP (g:g) 865 4.36 0.40 0.29+0.07 PHE 775 7.21 0.54 0.46+0.09 PHG 667 4.44 0.56 0.27+0.06 PHJ 798 6.27 0.18 0.12+0.04
1Data corrected for cell, hatch, sex, and cage row effects
2FEW: fresh excreta weight, DEW: dry excreta weight, FEWC: FEW
divided by feed intake; DEWC: DEW divided by feed intake; WC: water content of excreta; NP: ratio of nitrogen to phosphorus in excreta; PHE, PHG, PHJ: pH of excreta, gizzard content and jejunum content
Results and Discussion
Excretion data and heritability. Table 1 shows
the elementary statistics on corrected data and heritability estimates for excretion traits. Quantities excreted relatively to feed intake, NP and WC were close to or slightly lower to values previously found on the same lines (de Verdal et al., 2011b). Comparison is more difficult for FEW and DEW, as they were measured at different ages. Values of pH of gizzard and intestinal contents were in the expected range and comparable to a previous study in the D+/D- lines, i.e. 2.5 to 4.0 for gizzard and 5.8 to 7.0 for the jejunum, the latter being in the middle of pH in the
duodenum and in the ileum (de Verdal et al., 2011b). Heritability estimates were moderate to high, except for FEW, FEWC and for PHJ, which were more difficult to measure. Heritability estimates were close to those of de Verdal et al. (2011a, b) for DEWC (0.28 vs. 0.30) and for FEWC (0.18 vs. 0.17), but higher for WC (0.26 vs. 0.13) and NP (0.29 vs. 0.18).
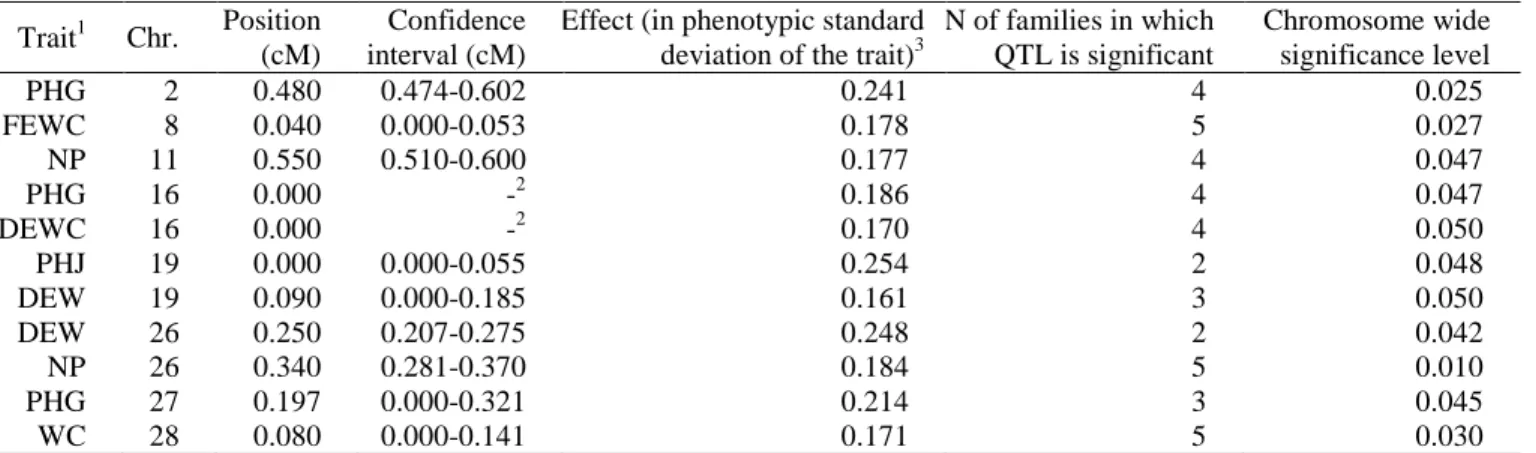
QTL. A total of 11 QTLs were detected which
were significant at the chromosome-wide level (p<0.05). None of them reached a 5% significance level at the genome-wide level. This is probably partly due to the fact that the QTLs were not fixed in the population and were significant in only 2 to 5 of the 6 F1 sire families. All of them have moderate effects. However, as these traits show quite a large phenotypic variability, even moderate QTL effects can have non negligible consequences. For example, the QTL on WC has an effect of 0.171 standard deviation. It represents a difference in feces humidity of 1.5%, i.e. 29% of the total difference between D+ and D- (de Verdal et al., 2011b). Similarly, the cumulated effect of the 3 QTLs on pH in the gizzard is 0.35 point of pH, i.e. 73% of the difference between the two lines (de Verdal et al., 2011b).
We found several co-localizations between QTLs of excretion traits and of digestive efficiency or anatomy of the digestive tract detected in the same population (Tran et al., 2014). On GGA16, QTLs were found both for PHG and DEWC and for AMEn, coefficients of the digestive use of dry matter, starch, and proteins and for the relative length of intestine. These QTLs are also close to the QTL detected on feed conversion ratio by Ewald et al. (2007). These co-localizations will however have to be confirmed, due to the low number of markers on this chromosome. We also found co-localization between QTLs for FEWC and relative length of intestine on GGA8, for NP and relative length of intestine and digestibility of starch on GGA26 and for PHG and digestibility of dry matter on GGA27. These co-localizations between excretion traits and anatomy of the digestive tract were expected, as anatomy of the digestive tract appears as one of the main factors explaining the differences of digestive efficiency between the D+ and D- lines (Rougière et al., 2009, de Verdal et al., 2010).
As for digestive efficiency, our QTLs were not detected at the same places as QTLs detected for feed efficiency (Tran et al., 2014). This may be due to the fact that we used a medium growth rate genotype (market weight of 2 kg is reached at 7 weeks). Moreover at the opposite of the other published studies, our diet was not based on a corn-soybean base (easy to digest), but included a poor quality wheat variety to stimulate digestive capacities of birds. It is thus not surprising that the genetic basis of digestion may differ between these 2 diets.
Finally, the QTL for DEW and NP on GGA26 co-localized with a QTL on body weight at 23 d (Tran et al., 2014). Former studies also detected QTLs for growth at this location (Park et al., 2006, Ankra-Badu et al., 2010). On chromosomes 11 and 27, QTLs detected in this study on NP and PHG also co-localized with QTLs of growth (Kerje et al., 2003, Carlborg et al., 2003), fatness (Ankra-Badu et al., 2010) and glycemia in fasted birds (Nadaf et al., 2009). The genetic correlation between NP, PHG or DEW and body
weight at 3 weeks is moderate (between 0.24 and 0.60, data not shown). However, NP, DEW and PHG are more highly correlated to feed intake (0.71 to 0.95, data not shown), the latter being also strongly correlated to growth, fatness and glycemia. Feed consumption could thus be the link between these QTLs for excretion and growth.
Conclusion
Results suggest that there was significant genetic basis for excretion traits in broilers that can be linked both to digestive efficiency, anatomy of the digestive tract and growth. Further research is now required to seek for candidate genes in these regions.
Literature Cited
Ankra-Badu, G.A., Le Bihan-Duval, E., Mignon-Grasteau, S., Pitel, F., Beaumont, C., Duclos, M.J., Simon, J., Carré, W., Porter, T.E., Vignal, A., Cogburn, L.A., Aggrey, S.E. (2010) Anim. Genet .41:400–405. Bastianelli, D., Bonnal, L., Juin, H., Mignon-Grasteau, S.,
Davrieux, F., Carré, B. (2010) J. Near Infrared Spectroscop. 18:69-77.
Carlborg, O., Kerje, S., Schütz, K., Jacobsson, L., Jensen, P., Andersson, L. (2003) Genome Res. 13: 413-421 Carré, B., Mignon-Grasteau, S., Juin, H. (2008). World
Poult. Sci. J. 64:377-390.
de Verdal, H., Mignon-Grasteau, S., Jeulin, C., Le Bihan-Duval, E., Leconte, M., Mallet, S., Martin, C., Narcy, A. (2010) Poult. Sci. 89:1955-1961.
de Verdal, H., Narcy, A., Bastianelli, D., Chapuis, H., Même, N., Urvoix, S., Le Bihan-Duval, E., Mignon-Grasteau, S. (2011a). BMC Genet. 12:59.
de Verdal, H., Narcy, A., Bastianelli, D., Chapuis, H., Même, N., Urvoix, S., Le Bihan-Duval, E., Mignon-Grasteau, S. (2011b). BMC Genet. 12:71.
de Verdal, H., Mignon-Grasteau, S., Bastianelli, D., Même, N., Le Bihan-Duval, E., Narcy, A. (2013) J. Anim. Sci. 91:613-622.
Elsen, J.M., Mangin, B., Goffinet, B., Boichard, D., Le Roy, P. (1999). Genet. Sel. Evol. 31:213-224.
Ewald, S.J., Ye, X., Avendano, S., McLeod, S., Lamont, S.J., Dekkers, J.C.M. (2007) Anim. Genet. 38:174-176.
Filangi, O., Elsen, J.M., Gilbert, H., Legarra, A., Le Roy, P., Moreno, C. (2010) Proc. 9th WCGALP, 0787. Groenen, M.A., Wahlberg, P., Foglio, M., Cheng, H.H.,
Megens, H.J., Crooijmans, R.P., Besnier, F., Lathrop, M., Muir, W.M., Wong, G.K., Gut, I., Andersson, L. (2009) Genome Res. 19:510-519.
Kerje, S., Carlborg, O., Jacobsson, L., Schütz, K., Hartmann, C., Jensen, P., Andersson, L. (2003) Anim. Genet., 34:264–274.
Lander, E.S., Botstein, D. (1989) Genetics 121:185-199. Lefcourt, A.M., Meisinger, J.J. (2001) J. Dairy Sci.
84:1814–1821.
Le Roy, P., Elsen, J.M., Boichard, D., Mangin, M., Bidanel, J.P., Goffinet, B. (1998) Proc 6th WCGALP, 257-260. Mignon-Grasteau, S., Muley, N., Bastianelli, D., Gomez, J., Péron, A., Sellier, N., Millet, N., Besnard, J., Hallouis, J.M., Carré, B. (2004) Poult Sci 83:860-867.
Nadaf, N., Pitel, F., Gilbert, H., Duclos, M.J., Vignoles, F., Beaumont, C., Vignal, A., Porter, T.E., Cogburn, L.A., Aggrey, S.E., Simon, J., Le Bihan-Duval, E. (2009) Physiol. Genomics 38:241–249.
Park, H.B., Jacobsson, L., Wahlberg, P., Siegel, P.B., Andersson, L. (2006) Physiol. Genomics 25:216–223. Rougière, N., Gomez, J., Mignon-Grasteau, S., Carré, B.
(2009) Poult. Sci. 88:1206-1215.
Tilquin, P., Barrow, P.A., Marly, J., Pitel, F., Plisson-Petit, F., Velge, P., Vignal, A., Baret, P.V., Bumstead, N., Beaumont, C. (2005) Genet. Sel. Evol. 37:539-561. Tran, T.S., Narcy, A., Carré, B., Gabriel, I., Rideau N.,
Gilbert, H., Demeure, O., Bed’Hom, B., Chantry-Darmon, C., Boscher, M.Y., Bastianelli, D., Sellier, N., Chabault, M., Calenge, F., Le Bihan-Duval, E. Beaumont, C., Mignon-Grasteau, S. (2014) Genet. Sel. Evol. (in press).
Table 2. QTLs detected for excretion-related traits
Trait1 Chr. Position (cM)
Confidence interval (cM)
Effect (in phenotypic standard deviation of the trait)3
N of families in which QTL is significant Chromosome wide significance level PHG 2 0.480 0.474-0.602 0.241 4 0.025 FEWC 8 0.040 0.000-0.053 0.178 5 0.027 NP 11 0.550 0.510-0.600 0.177 4 0.047 PHG 16 0.000 -2 0.186 4 0.047 DEWC 16 0.000 -2 0.170 4 0.050 PHJ 19 0.000 0.000-0.055 0.254 2 0.048 DEW 19 0.090 0.000-0.185 0.161 3 0.050 DEW 26 0.250 0.207-0.275 0.248 2 0.042 NP 26 0.340 0.281-0.370 0.184 5 0.010 PHG 27 0.197 0.000-0.321 0.214 3 0.045 WC 28 0.080 0.000-0.141 0.171 5 0.030
1FEW: fresh excreta weight, DEW: dry excreta weight, FEWC: FEW divided by feed intake; DEWC: DEW divided by feed intake; WC: water content of
excreta; NP: ratio of nitrogen to phosphorus in excreta; PHG, PHJ: pH of gizzard and jejunum contents
2Confidence interval non estimable due to the low number of markers on this chromosome 3