HAL Id: insu-01433798
https://hal-insu.archives-ouvertes.fr/insu-01433798
Submitted on 13 Jan 2017
HAL is a multi-disciplinary open access
archive for the deposit and dissemination of
sci-entific research documents, whether they are
pub-lished or not. The documents may come from
teaching and research institutions in France or
abroad, or from public or private research centers.
L’archive ouverte pluridisciplinaire HAL, est
destinée au dépôt et à la diffusion de documents
scientifiques de niveau recherche, publiés ou non,
émanant des établissements d’enseignement et de
recherche français ou étrangers, des laboratoires
publics ou privés.
Liquefaction assessment by microtremor measurements
in Babol city
Asskar Choobbasti, Mehran Naghizadehrokni, Sadegh Rezaei
To cite this version:
Asskar Choobbasti, Mehran Naghizadehrokni, Sadegh Rezaei.
Liquefaction assessment by
mi-crotremor measurements in Babol city. Fifth International Conference on Geotechnique, Construction
Materials and Environment„ Nov 2015, Osaka, Japan. �insu-01433798�
Liquefaction assessment by microtremor measurements in Babol city
Asskar Janalizadeh Choobbasti1, Mehran Naghizadehrokni 2, Sadegh Rezaei
1,3 Civil Engineering, Babol University of technology, Iran; 2 Civil Engineering, IAU Zanjan branch, Iran
ABSTRACT
The recent researchers have discovered microtremor applications for evaluation of the liquefaction potential. Microtremor measurement is a fast, applicable and cost-effective method with extensive applications. In the present research the liquefaction potential has been reviewed by utilization of microtremor measurement results in Babol city. By using the fundamental frequency and amplification factor, the value of vulnerability index (Kg)
was calculated and the liquefaction potential has been evaluated. For controlling the accuracy of this method, its output has compared with the results of Seed and Idriss method in 30 excavated boreholes within the study area. These two methods show an acceptable conformity with each other. Also, the artificial neural network (ANN) with different inputs was trained. Regarding the results of the three methods, we can conclude the threshold value of liquefaction potential is Kg=5. By reviewing and comparing these three methods, it will be observed that
microtremors have the capability of assessing the liquefaction potential with desirable accuracy.
Keywords: Liquefaction, Microtremor, Vulnerability index, Artificial neural networks, Microzonation
INTRODUCTION
Earthquake is one of the most devastating natural disasters which has always threatens human lives and properties. The most important effects caused by an earthquake are the liquefaction phenomena. Investigations of failures of soil masses are subjects touching both geology and engineering.
On the basis of both the field and the laboratory types of observations of soil behavior attempts were made to propose methods to evaluate the liquefaction potential of a particular soil. In the literature, several simplified methods can be found to assess nonlinear liquefaction potential of soil. Derived from several field and laboratory tests, various procedures, also named as conventional methods, have been developed by utilizing case studies and undisturbed soil samples [1].
Recently, the H/V technique [2] is becoming more popular with its data collection facilities and application allowance in all areas. By employing the H/V ratio, we were able to determine the predominant frequency (Fp) and the amplification
factor (Ap) of the site. Nakamura [3] also proposed
the vulnerability index “Kg value” as a means to
determine the extent of liquefaction. The present study mainly aims to show how the microtremor measurements can play a significant role in a liquefaction assessment [4].
Microtremor measurement was undertaken at 60 stations in the Babol, north of Iran, during 2011 and 2012. The study was conducted in Babol city for one important reason: the city is densely populated with critical buildings and infrastructures and it is built
upon the recent, loose, and therefore, generally liquefaction-prone sediments of the Babolrood River. With regards Nakamura’s method, H/V spectral ratios, fundamental frequency and amplification factor and finally vulnerability index (Kg) were
calculated for all microtremor stations.
There are geotechnical boreholes near 30 microtremor recording stations with suitable data. The Seed and Idriss method is used to assess the liquefaction potential [5].
The goal of the aim activities includes the assessment of liquefaction by a new, fast and applicable method in other stations and preparation of Babol city’s liquefaction map.
METHODOLGY
Ambient seismic noise or microtremors are feeble ground motions with displacement amplitudes of about 0.1–1 μm and that can be detected by seismograph with high magnification [6]. Recently, to assess potential hazards associated with ground failure or liquefaction, the vulnerability index (or Kg
value) that is derived from microtremor data may be evaluated. Among the various approaches to microtremor study, the H/V spectral ratio technique introduced by Nakamura (1989) was chosen for this investigation due to ease of application. This technique has been described in a number of papers.
By employing the H/V ratio, we were able to determine the predominant frequency (Fp) and the
amplification factor (Ap) of the site. Nakamura also
proposed the vulnerability index “Kg value” as a
GEOMATE- Brisbane, Nov. 16-18, 2014
For this purpose, he compared the results of vulnerability index and the damage points in the Kobe earthquake and concluded that Kg is a suitable
index for determining the site vulnerable points, such that each point with higher Kg value is more
damage potential. The Kg value is simply derived
from strain of ground structures. It can be defined as: 2 p g p
A
K
F
=
(1) After Nakamura some scientist have usedmicrotremor to liquefaction evaluation [7]-[9].
DATA COLLECTION AND RESULTS
Microtemor measurements were carried out at 60 stations in Babol during the period 2011 and 2012.
Fig. 1 shows the H/V spectral ratio for some stations. According to the analysis, the fundamental frequency (Fp) varies from 0.69 to 12.60 Hz within
the study area. Also, the amplification factor (Ap)
varies from 1.45 to 4 within the study area. Fig. 2 and fig. 3 show the fundamental frequency and amplification factor in the study area, respectively. As it can be observed in the fig. 2 and fig. 3 for ten recording stations, fundamental frequency and amplification factor have not presented. Since these stations have been surrounded by the factories and highways in the city, accurate microtremor recording was impossible all day long [10], [11].
Fig. 1 H/V spectral ratio
Fig. 2 Fundamental frequency
Fig. 3 Amplification factor
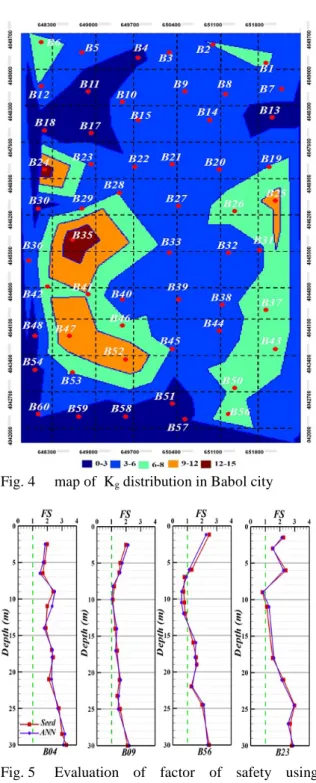
By using the results of figures 2 and 3, the Kg
values are calculated for different stations. These results are indicated in fig. 4. By reviewing the scientific literature, it has been concluded that the higher Kg value, the more liquefaction potential will
be. In fact Kg value has a qualitative meaning, for
instance the possibility of liquefaction occurrence is more in recording station 35 than recording station 25.
In the next sections, firstly, the possibility of liquefaction occurrence will be evaluated by using the data of 30 geotechnical boreholes and the Seed and Idriss (1985) method. Secondly, the ANN with different inputs including type of soil, total stress, effective stress and corrected SPT blow count was trained. Subsequently, by comparing the stations in which liquefaction has occurred (using Seed and Idriss (1985) and ANN) and the values obtained from microtermor measurement, it was possible to obtain a precise value for Kg which is the threshold
value for liquefaction occurrence.
ASSESSMENT AND COMPARISON OF
LIQUEFACTION POTENTIAL BY USING CONVENTIONAL METHOD
Simplified procedures, originally proposed by Seed and Idriss [5], using the standard penetration test (SPT), are frequently used to evaluate the liquefaction potential of soils. This procedure has been revised and updated since its original development [12]. The method was developed from field liquefaction performance cases at sites that had been characterized with in situ standard penetration tests. Using a deterministic method, liquefaction of soil is predicted to occur if the factor of safety (FS) which is the ratio of the cyclic resistance ratio (CRR) over cyclic stress ratio (CSR), is less than or equal to one. No soil liquefaction is predicted if FS > 1 [12].
By using the 30 geotechnical boreholes in the region, we can assess the liquefaction potential in Babol city. The results of this assessment in 4 boreholes have been shown in fig. 5. In these 30 boreholes we compare the two methods of conventional and microtremor and by analyzing the
results it is possible to obtain a precise value for Kg
which is the threshold value for liquefaction occurrence. Table 1 shows the depths of evaluated liquefaction using conventional method against the Kg value. By reviewing table 1, it is observed that in
all the stations with Kg values higher than 5,
liquefaction phenomena occurred. Consequently the value of Kg=5 can be considered as a threshold value
for these 30 stations, in that for all the stations of this region with Kg value higher than 5, the
occurrence of liquefaction phenomena is possible and for stations with lesser values, this possibility does not exist.
Fig. 4 map of Kg distribution in Babol city
Fig. 5 Evaluation of factor of safety using conventional and ANN method
In the next section, we assess the potential of liquefaction using ANN method and the results will be compared with the results of microtremor measurement to be able to prepare the liquefaction microzonation map of Babol city.
Table 1 The liquefaction depths versus Kgvalue Station Liquefaction depths by using
Seed & Idriss method (m)
Kg Value B01 2-4.5 & 5.5-8 & 8.5-10.5 7.51 B02 5-10 7.01 B04 - 2.53 B05 5.5-7 5.21 B07 - 4.80 B09 - 4.63 B11 - 1.53 B12 5-6.5 & 8-9.5 6.15 B15 - 4.63 B18 - 1.10 B19 6-7 & 9-10 5.93 B22 - 3.65 B23 8.5-10.5 5.42 B25 3-5 & 5.5-8 & 8.5-10.5 10 B27 - 4.12 B28 5.5-8 5.51 B30 - 1.25 B32 - 4.74 B35 3-6 & 6.5-10.5 14.6 B37 6.5-9.5 6.61 B39 - 4.7 B42 5-12 8.14 B43 4.5-7 & 8-10 7.19 B44 7-8 5.2 B45 4-6.5 5.17 B50 4-6 & 7-8 & 8.5-9.5 6.79 B52 3.5-5 & 6.5-10.5 11.57 B56 6.5-11 8.34 B57 - 1.92 B58 - 1.16
ASSESSMENT AND COMPARISON OF LIQUEFACTION POTENTIAL BY USING ANN
Today, the application of artificial neural networks in the engineering world is well known to engineering sciences [13]. Considering that ANN can assess liquefaction potential in this precise manner, we will assess the liquefaction phenomena by this method in the 20 remaining stations and the results will be compared with the microtremor measurement result.
GEOMATE- Brisbane, Nov. 16-18, 2014
work consist of four input variables, including soil type, total stress, effective stress, corrected SPT blow count and one output factor of safety. Before using the training procedure the data were normalized to their mean value and standard deviation 1. A training set of 23 out of 30 input– output data pairs is used to train the MLP-type neural network with only one hidden layer based on BP algorithm. At the end of the training process, it is necessary to evaluate the capability of ANN model in prediction of liquefaction potential. The remaining 7 data pairs are used to test the network performance. Since there are four input variables the network has four neurons in the input layer and one neuron in the output layer. Hence there is no specific method to determine the number of neurons in the hidden layer, Trial and error was used. Fig. 6 depicts the effect of different neural network architecture (different number of neurons in the hidden layer) on the RMS error of the network obtained from the normalized data. As can be seen a network with 15 neurons in the hidden layer has an acceptable performance.
Fig. 6 Effects of the number of hidden neurons on the network performance
The excellent behavior of the MLP-type neural network is also shown in Fig. 5. The figure reveals that the trained network is able to model and predict the outputs successfully. It is evident from test data sets that the experimental ANN can be applied successfully to predict liquefaction potential.
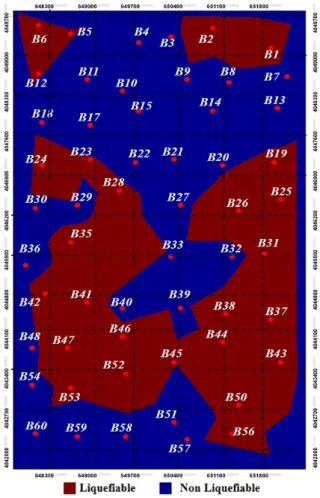
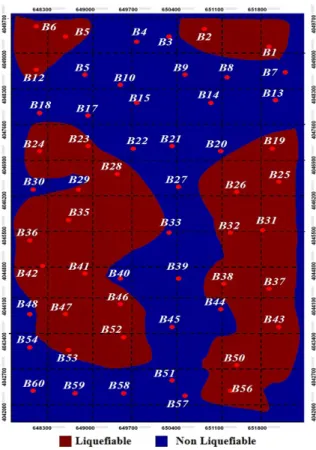
Fig.7 shows the liquefaction microzonation by using microtremor measurements and fig.8 indicates the liquefaction microzonation by the ANN. In these two figures, the areas shown in red include the zones with liquefaction potential. By comparing the two methods, it is concluded that they have very good conformity with each other. Only in 4 stations of B32, B36, B44 and B45, the results are different.
The Kg value in these stations is close to 5 which is
considered the threshold value for liquefaction phenomena. The value of Kg at these stations
changes with a minor change in the fundamental frequency and amplification factor. Also, we used the ANN for comparing the two methods which have a small error in prediction. For this reason, the mentioned minor difference is not taken into consideration and the value of Kg=5 is introduced as
a threshold value, such that soils with higher Kg
values will have liquefaction potential.
From these results, it is reasonable to conclude that Kg is clearly a value which corresponds to the
site and can be considered as vulnerability index of that site, an indicator which might be useful in selecting weak points of ground especially in liquefied areas.
Fig. 7 Liquefaction microzonation of Babol by microtremor measurement
Fig. 8 Liquefaction microzonation of Babol by ANN
CONCLUSION
In the present research, the microtremor measurements were used in 60 stations in order to evaluate the liquefaction potential. By using the fundamental frequency and amplification factor, the value of vulnerability index (Kg) was calculated. To
obtain a precise value for Kg which is the threshold
value such that at higher values, the liquefaction potential exists, the microtremor results have been compared with the conventional method results. By comparing these results, it is concluded that in Babol city, the stations with Kg values higher than 5, have
the liquefaction potential. Subsequently, in order to assess the liquefaction potential, the ANN was utilized in the remaining stations. By comparing the ANN and microtremor results, it was observed that the results are in good conformity with each other and except for 4 stations, the liquefaction phenomena has occurred in all those other stations where their Kg values were higher than 5. With
regards the results of the three methods, we can conclude the threshold value of liquefaction potential is Kg=5. Furtheremore, we prepared two
maps for liquefaction microzonation by using the microtremor and ANN results. Finally, it can be stated that microtremor measurements are considered suitable and complementary method among conventional methods for reviewing the
liquefaction potential which is fast, applicable and cost-effective.
REFERENCES
[1] Saygili G, “Liquefaction potential assessment in soil deposits using artificial neural network”, M.Sc. Thesis, Concordia University, 2005.
[2] Nakamura Y, “A method for dynamic characteristics estimation of subsurface using microtremor on the ground surface”. Quarterly Report of RTRI, Vol. 30, 1989, pp. 25–33.
[3] Nakamura Y, “Real-time information systems for hazard mitigation”, 10th World Conference in
Earthquake Engineering, Spain, Madrid, 1996. [4] Huang HC, Tseng YS, “Characteristics of soil liquefaction using H/V of microtremors in Yuan-Lin area, Taiwan”, TAO, Vol. 13(3), 2002, pp. 325–338. [5] Seed HB, Idriss IM, “Simplified procedure for evaluating soil liquefaction potential”, J Soil Mech Found Div SM, Vol. 9, 1971, pp.1249–1273.
[6] Dikmen U, Mizaoglu M, “The sesimic microzonation map of Yenisehir-Bursa, NW of Turket by means of ambient noise measurements”, J Balkan Geoph Soc, Vol. 8, 2005, pp.53–62.
[7] Rezaei S, Choobbasti AJ, “Liquefaction assessment using microtremor measurement, conventional method and artificial neural network (Case study: Babol, Iran)”, Frontiers of structural and civil engineering, 2014, DOI 10.1007/s11709-014-0256-8
[8] Uehan F, Nakamura Y, “Ground motion characteristics around Kobe City detected by microtremor measurement”,11th World Conference
on Earthquake Engineering, Acapulco, Mexico,1996. [9] Saita J, Nakamura Y, Sato T, “Liquefaction caused by the 2011 off the Pacific coast of Tohoku earthquake and the result of the prior microtremor measurement”, 9th International Conference on
urban earthquake engineering, Tokyo, Japan, 2012. [10] Choobbasti AJ, Rezaei S, Farrokhzad F, “Evaluation of site response characteristics using microtremors”, Gradevinar, 65, 2013, pp.731-741. [11] Choobbasti AJ, Rezaei S, Farrokhzad F, Heidarzadeh Azar P, “Evaluation of site response characteristics using nonlinear method (Case study: Babol, Iran)”, Frontiers of structural and civil engineering, 2014, DOI 10.1007/s11709-014-0231 [12] Seed HB, Tokimatsu K, Harder LF, Chung RM, “Influence of SPT procedures in soil liquefaction resistance evaluations”, J Geotech Eng ,Vol. (12), 1985, 1425–1445.
[13] Rezaei S, Choobbasti AJ, Soleimani Kutanaei S, “Site effect assessment using microtremor measurement, equivalent linear method and artificial neural network (Case study: Babol, Iran)”, Arabian Journal of Geosciences, 2013, DOI:

![[PDF] cours complet php pdf | Télécharger PDF](data:image/gif;base64,R0lGODlhAQABAIAAAP///wAAACH5BAEAAAAALAAAAAABAAEAAAICRAEAOw==)