Dynamics of Agribusiness Decision Making in Uganda
by
Katherine R. Picchione
B.S. Mechanical Engineering and Society, Technology, and Policy,
Worcester Polytechnic Institute (2016)
Submitted to the Institute for Data, Systems, and Society
in partial fulfillment of the requirements for the degree of
Master of Science in Technology and Policy
at the
MASSACHUSETTS INSTITUTE OF TECHNOLOGY
June 2018
Massachusetts Institute of Technology 2018. All rights reserved.
Author
Signature redacted
Technology and PoIcy Program
May 11, 2018
Signature redacted
Certified by
Jarrod Goentzel
Director, Humanitarian Supply Chain Lab
Research Associate, Center for Transportation and Logistics
Thesis Supervisor
Accepted by-
Signature redacted
Munther Dahleh
W. Coolidge Professor, Electrical Engineering and Computer Science
Director, Institute for Data, Systems, and Society
MASSACHUSETTS INSTITUTEOF TECHNOLOGY
JUN 0
5
2018
LIBRARIES
3
Dynamics of Agribusiness Decision Making in Uganda
by
Katherine R. Picchione
Submitted to the Institute for Data, Systems, and Society on May 11, 2018, in partial fulfillment of the
requirements for the degree of Master of Science in Technology and Policy
Abstract
Uganda is a developing country in East Africa that faces high poverty rates among a confluence of socio-political issues. In the pursuit of fiscal and political stability, international development organizations are working to create an environment in which business prospers and livelihoods are resilient. Agriculture, in particular, employs
75% of the population and accounts for 85% of Uganda's export earnings. However, many smallholder farmers
experience volatile cashflows around crop cycles. Consequently, farmer livelihoods are vulnerable to uncertain growing conditions, market price fluctuations, and financial shocks, such as hospital bills or school fees. Subject to a high degree of uncertainty, it is difficult for farmers to improve their quality of life through agriculture alone.
Agribusinesses--commodity traders in particular-are well positioned to help farmers access knowledge, goods, and services to increase yields and improve crop quality In some cases, provision of knowledge, goods, and services aligns with an agribusiness's regular profit-earning strategies. For example, some traders provide farmers with financing to purchase seeds and fertilizer at the beginning of the growing season; the farmer benefits from less cash volatility while the trader ensures crops will be available at harvest.
This thesis explores the extent to which trader business strategies might be leveraged to mutually benefit agribusi-ness growth and farmer livelihoods. Specific goals were to identify common busiagribusi-ness strategies used by agricul-tural commodity traders and understand the mechanisms by which certain business strategies also benefit farm-ers. Semi-structured interviews and subsequent qualitative analysis shed light on the types of business strategies traders adopt. System dynamics modeling was then used to explain why certain strategies can be mutually benefi-cial. The combination of qualitative and quantitative methods yielded unique insight on ways mutually-beneficial behavior might be encouraged.
Thesis Supervisor: Jarrod Goentzel
Title: Director, Humanitarian Supply Chain Lab
5
Acknowledgments
Writing a thesis is no small feat. This work would not have been possible without support from innumerable colleagues, friends, and family members. First and foremost, my advisor, Dr. Jarrod Goentzel, guided me through the academic somersaults of asking difficult questions, narrowing the scope to a single, manageable, research topic, and conducting a rigorous investigation despite gaps in data and methodological challenges. Additionally, Dr. Rogelio Oliva provided invaluable feedback as I developed my system dynamics model.
My research and experience at MIT has been generously supported by the United States Agency for
Interna-tional Development's Mission to Uganda through the USAID/Uganda Feed the Future Market System Monitoring Activity (contract number AID-OAA-A-12-00095), headquartered at the Massachusetts Institute of Technology (MIT) and The George Washington University (GWU). Opinions expressed in this publication do not necessarily reflect the views of the United States Agency for International Development, the United States Government, MIT, or GWU. However, I am deeply grateful to USAID/Uganda Feed the Future staff who made this work possible, particularly Andrew McCowan, Rita LakerOjok, Douglass Griffith, and Marion Kyomuhendo.
Special thanks go out to Tim Russell, Micaela Wiseman, Courtney Blair, Dr. Erica Gralla, Megan Peters, and Jillian Miles, my teammates from the USAID/Uganda Market System Monitoring Activity In particular, I am so grateful to Tim Russell for being my advocate, sounding board, and reality checker, always ready to challenge my assumptions, push me think more critically about my work, and, at the same time, help me find the silver linings. Tim, I really couldn't have done this without you. In the second year of my studies, I was extremely fortunate to work with Micaela Wiseman, the best lab-mate ever, who was a constant source of reassurance. Numerous colleagues in Uganda facilitated fieldwork, especially Jackson Isiko and Jane Asiimwe, translators who let me drag them all over Iganga district, and William Kigozi, our driver.
In addition, the following people were influential and supportive throughout my time at MIT: Michael Windle and Olumurejiwa Fatunde, colleagues from MIT's Humanitarian Supply Chain Lab; the TPP 2018 and 2019 cohorts, my friends and fain from day one; the Center for Transportation and Logistics Cohort of Research Post-docs and Students (CTL-COPRS), the first people to hear me present my work and let me draw on the walls; and finally the finance team at MIT's Center for Transportation and Logistics, who watered my plants, fed me when I was wilting, and never failed to make me laugh.
I owe a huge debt of gratitude to TPP Academic Administrator Barbra DeLaBarre, my cheerleader, life coach, and fashionista, for drying my tears and quelling my fears each time I hit road blocks over the past two years. Similarly, I would not even be here without TPP Admissions and Administrative Assistant Ed Ballo who first encouraged me to apply to TPP. And no thesis would be complete without input from TPP's Academic Director, Dr. Frank Field. Since day one I have deeply admired the thoughtful, meticulous, and passionate way he steers TPP. Thanks for pushing me to keep going, Frank.
One of the greatest challenges in graduate school is to build a support group, find the people who will give you an open invitation to supper, send you words of encouragement at all hours, go out of their way to check in and make sure you are okay. The people who love you unconditionally, and you really have no idea why except that it's mutual. The people who inevitably become lifelong friends. A number of those mentioned above certainly fill this role in my life, but there are a few others who went above and beyond for me. Dr. Shlomiya Lightfoot and family welcomed me into their home, gave me thoughtful insight on my work throughout, and kept me laughing and playing when things got tough. My dear friend Natalia Guerrero, who sponsored more dinners than I can count, helped me find artistic outlets for all kinds of stress and kept cheering me on when I wanted to quit. Finally, thanks to Nikhil Mallareddy, who was there at the end.
6
I don't think it is possible to express in writing (and certainly not on the Acknowledgements page, though I'll give it a shot) the gratitude, love, and admiration I have for my parents and brother (and fuzzy brothers, Russell and Bently). With family challenges squeezing us all, you somehow managed to encourage me to take advantage of every opportunity at MIT, explore my interests to the fullest, and keep working hard, even when it was hard to keep working. Thanks for all the love, puppy videos, and time spent listening to me talk about my thesis, though I know half the time it didn't make any sense to either of us. This is for you, Dad.
7
Contents
I
Introduction 112 Background and Literature Review 12
2.1 Agriculture and Economic Growth in Uganda . . . . 12
2.2 Qualitative Research Methods . . . . 13
2.3 System Dynamics Modeling . . . . 14
2.4 Framing Current Work . . . . 15
3 Research Design and Methodology 16 3.1 Research Questions and Approach . . . . 16
3.2 Qualitative Methods . . . . 17
3.2.1 Semi-Structured Interviews on Quality Differentiated Pricing . . . . 17
3.2.2 Semi-Structured Interviews with Agribusinesses in Iganga District . . . . 18
3.2.3 Analysis of Interview Data . . . . 19
3.3 System Dynamics Modeling Methodology . . . . 20
4 Trader Business Strategies 21 4.1 Traders opportunistically diversify business activities, often filling multiple roles . . . . 21
4.2 Increasing quantity sold . . . . 22
4.3 Improving quality . . . . 24
4.4 Increasing price margins . . . . 26
4.5 Quantity, quality, and price are closely linked . . . . 28
4.6 Enablers and Barriers to Economic Growth in Uganda . . . . 30
5 System Dynamics Modeling and Analysis 32 5.1 Base Model Design . . . . 33
5.1.1 Assumptions and Limitations . . . . 34
5.1.2 Modeling Trader Business Operations . . . . 35
5.1.3 Modeling Farmer Livelihoods . . . . 37
5.1.4 Monthly Prices . . . . 39
5.2 Base Model Behavior and Sensitivity Analysis . . . . 40
5.3 Inputs Financing . . . . 46
5.4 Trader Storage . . . . . 48
5.5 Increasing Farmer Yields . . . .. . . . 52
6 Discussion 53 6.1 Summary of Findings . . . . 53
6.2 Methodological Contribution . . . . 54
6.3 Remaining Gaps and Opportunities . . . . 55
7 Conclusion
57
8 CONTENTS
Appendix A Quality-Differentiated Pricing Study 60
Appendix B 2016 Interview Guide on Quality-Differentiated Pricing 85
Appendix C Preliminary Findings From Agribusiness Interviews 87
Appendix D August 2017 Agribusiness Interview Guide 91
Appendix E Market System Monitoring Activity Maps 95
E.1 Supply Chain Role M ap . . . . 95 E.2 Behaviors, Relationships, and Conditions Map . . . . 97
9
List of Figures
2-1 Supply Chain Role Map . . . .. ... ... 13
4-1 Diagram depicting the complex relationship between quantity, quality, and price. . . . . 30
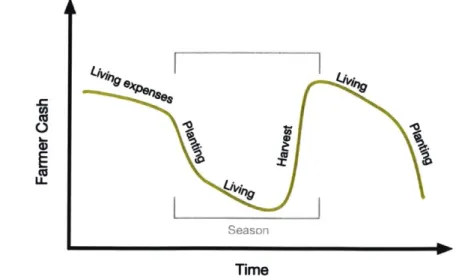
5-1 Farmer cash reference mode . . . . 32
5-2 Cash conversion causal loop diagram . . . . 33
5-3 Transactional causal loop diagram . . . . 34
5-4 Trader stock and flow diagram . . . . 36
5-5 Farmer stock and flow diagram . . . . 37
5-6 Average monthly prices in Iganga district. Data are from the WFP Global Food Prices database. . 40 5-7 Farmer and Trader Cash under base case conditions . . . . 42
5-8 Farmer and Trader expenditures and earnings under base case conditions . . . . 42
5-9 Farmer Cash, Trader Cash, and Stock levels under conditions that lead to bankruptcy . . . . 43
5-10 Simulating equilibrium conditions . . . . 43
5-11 Simulating crop production in equilibrium . . . . 44
5-12 Simulating production costs . . . . 44
5-13 Simulating production delays . . . . 45
5-14 Stock and flow diagram of inputs financing . . . . 47
5-15 Comparative outcomes of inputs financing . . . . 48
5-16 Increasing average storage time . . . . 49
5-17 Stock and flow diagram of additions for simulating storage . . . . 50
5-18 Effect of storage capacity with a desired sales rate . . . . 51
10 LIST OF TABLES
List of Tables
3-1 Characteristics of traders interviewed in August 2016 . . . . 18
4-1 Factors that affect trader quantity . . . . 23
4-2 Quality attributes described by traders . . . . 25
4-3 Tactics to improve crop quality . . . . 25
4-4 Tactics to increase prices . . . . 26
11
Chapter 1
Introduction
Uganda is a developing country in East Africa that, like many African nations, faces high poverty rates among a confluence of socio-political issues, including rapid population growth, high unemployment, and climate change. In the pursuit of fiscal and political stability, international development organizations are working with the Gov-ernment of Uganda to create an environment in which businesses prosper and livelihoods are resilient. Agricul-ture, in particular, is a prevalent and promising area of engagement for development organizations.
In Uganda, the agricultural sector employs 75% of the population and accounts for 85% of export earnings (USAID/Uganda, 2017). However, many smallholder farmers, who typically cultivate less than two hectares, experience volatile cashflows around crop cycles (US Agency for International Development, 2013). Before the growing season begins, farmers invest in seeds, agrochemicals, tools, and field preparations; at harvest time, farmers receive concentrated income from sales, though not without risk. Financial services are limited in rural Uganda, and crop insurance is essentially non-existent for smallholder farmers (US Agency for International Development, 2016). Consequently, farmer livelihoods are vulnerable to uncertain growing conditions, market price fluctuations, and financial shocks such as hospital bills or school fees. Subject to a high degree of uncertainty, it is difficult for farmers to improve their quality of life through agriculture alone.
Presumably, improved access to knowledge, goods, and services would enable farmers to increase yields, im-prove crop quality, and become better connected to agricultural markets (US Agency for International Devel-opment, 2016). Agribusinesses-commodity traders in particular-are well positioned to help farmers access these resources. In some cases, providing knowledge, goods, and services to farmers aligns with a business's profit-earning strategies (Feed the Future Knowledge-Driven Agricultural Development, 2015). For example, some traders offer financing for farmers to purchase seeds and fertilizer at the beginning of the growing sea-son; the farmer benefits from less cash volatility while the trader ensures crops will be available for purchase at harvest.
This thesis explores the extent to which trader business strategies might be leveraged to mutually benefit agribusi-ness growth and farmer livelihoods. Specific goals were to identify common busiagribusi-ness strategies used by agri-cultural commodity traders and understand the mechanisms by which certain strategies also benefit farmers. Semi-structured interviews and subsequent qualitative analysis shed light on the types of business strategies traders adopt. System dynamics modeling was then used to understand the ways in which certain strategies can be mutually beneficial. The combination of qualitative and quantitative methods yielded unique insight on what incentives exist or might exist to encourage mutually-beneficial behavior. Conclusions shed light on opportunities for development organizations to engage traders in activities that strengthen the agricultural supply chain and ultimately lead to more resilient businesses and livelihoods.
CHAPTER 2. BACKGROUND AND LITERATURE REVIEW
Chapter 2
Background and Literature Review
2.1 Agriculture and Economic Growth in Uganda
Located at the equator, and perched upon the East African Plateau, Uganda experiences two growing seasons and is endowed with fertile soil ripe for crop production. Agricultural exports include coffee, maize, wheat, rice, and a variety of pulses (Uganda Bureau of Statistics, 2010). Commodities consumed domestically include cassava, millet, sorghum, ground nuts (peanuts), potatoes, sweet potatoes, matooke (an indigenous variety of green banana), and various fruits and vegetables. Indeed, Uganda has the potential to be the bread basket of East Africa (USAID Feed the Future, 2011).
Currently, agricultural production is largely subsistence-based. According to the 2009 Agricultural Census, the average national holding size is 1.1 hectares (Uganda Bureau of Statistics, 2010), and it is believed that many smallholder farmers are disconnected from markets (USAID Feed the Future, 2011). Ongoing research is ex-ploring the extent to which smallholder farmers across Uganda have access to and utilize agricultural inputs, services, information, finance, and sales channels.
Rich literatures of economics and social policy support the theory that development occurs as economic systems modernize and governance systems democratize (e.g. Michael Todaro, 2015, Viscusi, Vernon, Jr., Harrington, and Harrington, 2015, Duflo and Banerjee, 2012). In the aftermath of nation-wide genocide under dictator Idi Amin, Uganda has spent four decades rebuilding social and political institutions with assistance from numerous international development organizations. Support for smallholder farmers has been a major focus alongside addressing HIV/AIDS, malnutrition, education reform, governance, and others (US Agency for International Development, 2016).
In 2013, the US Agency for International Development mission to Uganda instituted the Feed the Future-Value Chain project (FTF-VC) to strengthening the agricultural supply chains for maize, beans, and coffee (US Agency for International Development, 2013). Market facilitation is an approach to improving livelihoods for individuals
by strengthening the institutions and businesses that form the system in which they are nestled. Through market
facilitation, FTF-VC "focuses interventions at strategic leverage points within a system, such as economic or social structures and incentives,ii in order to optimize its functionality and inclusiveness for improved development results" (Feed the Future Knowledge-Driven Agricultural Development, 2015).
Under USAID FTF-VC, the Market System Monitoring Activity, headquartered at MIT's Center for Transportation and Logistics and The George Washington University, is developing approaches for assessing the systemic impact of FTF-VC market facilitation activities (Market System Monitoring Activity, 2017a). One of the tools produced
by the Market System Monitoring Activity is the Supply Chain Role Map (SCR). The SCR is a diagram that depicts
how materials, cash, and services flow between actors that fill different roles. In addition, the Behaviors, Rela-tionships, and Conditions Map (BRC) is a diagram that captures complexity among system conditions, behaviors taken by various actors, and relationships between types of actors. Detailed information about the BRC and SCR maps can be found in Appendix E, excerpts from the System Maps Release Notes produced by the Market Sys-tem Monitoring Activity in 2017 (Market SysSys-tem Monitoring Activity, 2017a). These maps, based on empirical 12
2.2. QUALITATIVE RESEARCH METHODS
evidence, are useful tools for capturing and communicating complexities and causal relationships in the agricul-tural market system. In March 2017, for example, USAID hosted an event where these mapping approaches were used to engage a wide variety of stakeholders in identifying opportunities for future interventions and setting development priorities (Market System Monitoring Activity, 2017b).
The SCR map (Figure 2-1) brings clarity around the roles of actors in the value chain; this study focuses on the outputs side of the map. The Market System Monitoring Activity has developed a categorization of roles that differs from other organizations in a few key ways. In the SCR framework, an agribusiness may fill several supply chain roles, but role titles do not comprehensively define actors. Roles are more general categories of activities in which actors engage.
Inputs outputs P'OONsO'
mooir DmWe Fa nw COM&Wto Tradt10Mr
- --- r--p nmiseoes
- -- -- + FinacWa SendA=
Figure 2-1: Supply Chain Role Map. Developed by the Market System Monitoring Activity, the SCR Map shows how materials, money, and services flow among actors in Uganda's agricultural market system.
A relevant construct used in the BRC Map is the idea of system conditions. Conditions, defined broadly, are
"qualities or attributes of the market environment that enable activities or changes in the market system" (Mar-ket System Monitoring Activity, 2017a). Examples may include policies, political will, and training programs. Furthermore, conditions can be categorized as enablers and barriers of systemic change. Enablers and barriers include social, political, environmental, and technological factors that define the context in which a market exists. It follows that ertain systemic conditions enable growth through trade.
It follows that there is a set of enabling and impeding conditions under which individuals see trade as a mecha-nisms for increasing income. As the results and analysis show, individuals have indeed seen such opportunities in trade. A guiding question is, how can these conditions-these institutions-be reinforced through the efforts of development organizations to strengthen incentives for agricultural commerce? What incentives could drive adoption and reinforcement of these conditions? In order to approach these questions, this thesis combines the development of grounded theory through qualitative research with differential equation modeling to provide additional explanations and insights.
2.2 Qualitative Research Methods
Qualitative research hinges upon triangulating data sources through rigorous analysis (Berg & Lune, 2012), weaving together information from different sources to obtain a deeper understanding of context and offer expla-nations. In the 1967 seminal work Developing Grounded Theory, Glaser and Strauss position qualitative research as a normative process of theory-building through data-driven inductive reasoning. Qualitative research is one avenue toward developing grounded theory. Stemming from Dr. Kathleen Eisenhardt's work, case-based research
CHAPTER 2. BACKGROUND AND LITERATURE REVIEW
is well-established in literature and practice as a method for developing grounded theory (Barratt, Choi, & Li,
2011; Eisenhardt, 1989; Ketokivi & Choi, 2014; Yin, 2009).
Qualitative methods for conducting case-based research and building grounded theory can be subdivided into two categories: data collection methods and data analysis methods. Data collection methods include interviews, focus groups, ethnography, action research, and archival study (Berg & Lune, 2012). Sampling for interviews in qualitative research studies often involves random walk or snowball sampling methods, the former of which consists of interviewing people met randomly in a selected area and the latter of which samples from a list of references and then connections leading from those references.
Methods for analyzing qualitative data range from quantitative approaches, such as word counts, to pattern matching and content analysis (Berg & Lune, 2012; Yin, 2009). Coding is a useful tool for identifying common themes among numerous narrative documents, such as interview transcripts, stories, and reports. Atlas.ti is a software package that enables code creation, document annotation, and various tools to observe patterns across and within documents.
Less formal analyses also emerge as a qualitative researcher engages the population studied (Berg & Lune, 2012). Action research involves constant observation and curiosity over an extended period of time. At some point, saturation is reached where the researcher stops learning new things and is able to articulate a deep and nuanced understanding of a context.
Qualitative research methods were widely used in the course of this work. Results from qualitative analysis provided a basis for quantitative modeling using System Dynamics, discussed below.
2.3 System Dynamics Modeling
In the vernacular, people often talk about "the system" and how it works for or against them. At a higher level, underlying causal system structures can be analyzed with a variety of modeling methodologies, including discrete events modeling, agent based modeling, and differential equations modeling. The method chosen depends on the question or problem at hand.
System dynamics modeling, a form of differential equations modeling that had its genesis at MIT in the mid twentieth century, has been widely used to analyze complex social and qualitative systems (Sterman, 2000). System dynamics models view the world through stocks and flows, quantities of things and the rates at which they change. Vensim and other software packages provide a user-friendly interface to graphically portray causal loops and define mathematical functions that govern interactions among variables. The rest of this section reviews relevant established models that informed this thesis.
In the context of agricultural commodity markets, the Market Growth Model is an intuitive reference (Morecroft,
1983; Sterman, 2000). Combining firm-level decision-making and perceptions about the demand for and price
of goods, the Market Growth Model provides an analytical framework for analyzing a firm's behavior in a broader market system. In the Market Growth Model, the firm has some market power over prices, supply, and employ-ment. The main decisions a firm makes are whether to invest in production capacity and whether to hire workers. These decisions are driven by demand, which in turn is driven by price and the firm's ability to deliver.
The Market Growth Model has several elements that are useful to understanding the dynamics that affect farmer livelihoods. The idea of capacity utilization is analogous to a farmer's decision on how much of their field to sow. Similarly, a trader's business sometimes behaves like the firm in the Market Growth Model: negotiating prices,
2.4. FRAMING CURRENT WORK
deciding how much inventory is profitable to procure and how much storage space is necessary, hiring employees when appropriate.
The Stock Management Model, notably, John Sterman's incarnation in Business Dynamics concerning the pro-duction of Widgets (Sterman, 2000), provides structures for simulating deterministic material flow rates, order placement decision-making, and interactions among supply chain actors. Stock management is essential to both traders and farmers in their decisions on how much to plant or purchase. The Widgets model contains stocks and flows for materials in various stages of production. Similarly, farmers have stocks of crops growing in their fields and crops in storage. In the Widgets model, Work in Process Inventory is modeled as a pipe delay, a construct that transfers nicely to crop production.
Several elements of the Stock Management Model are inapplicable or unavailable in the current context. Order rates and order fulfillment, though relevant measures for some traders who have sales contracts with exporters or government procurement entities (e.g. school, food aid), bear no weight on farmer production. Farmers will pro-duce as much as possible without adjusting production to meet demand, and demand itself is not known.
Several other models are also worth noting. The Bass Diffusion Model (Sterman, 2000), which explains delays in adoption of new technologies, is relevant to understanding how information and knowledge of agricultural practices spreads among the farmer population. The Getting Big Fast Model (Sterman, Henderson, Beinhocker,
& Newman, 2007) describes how a firm can get ahead of competition by using new technologies, just as an
agribusiness might have a competitive edge after adopting or inventing a new agricultural technology. Finally, the Commodity Cycles Model (Sterman, 2000) offers a structure of underlying market dynamics and how firms update their decision-making processes based on the current state of the system and available information. Reviewing variables included in all of these models highlights the challenges with modeling in data-poor envi-ronments. Due to poor record keeping and the informal nature of many businesses, USAID/Uganda lacks data on the number and size of firms, their inventory flows and revenues, earnings, strategies and operations. Business records are difficult to obtain and often incomplete, and small agribusinesses do not seem to cogently control inventory flows. Demand is driven by both domestic and export markets, and sales channels are multitudinous and varied for many traders.
2.4 Framing Current Work
Empirical methods in economics research are typically based on the logic of causal inference. Statistical and econometric methods have become the norm for precisely estimating the impact of specific interventions. Yet, capturing the complexity of the Ugandan agricultural market system in a system dynamics model requires nu-anced understanding of the linkages and interactions among actors. The Market System Monitoring Activity's "Behaviors, Relationships, and Conditions" map, a first graphical representation of the system was developed through short-term studies and stakeholder engagement. While this map does not fully capture feedback loops, decision-making policies, market forces, or levels, it sheds light on the complexity of interactions. Modeling the full scope of market growth is outside the scope of this paper.
CHAPTER 3. RESEARCH DESIGN AND METHODOLOGY
Chapter 3
Research Design and Methodology
3.1 Research Questions and Approach
Market systems are complex; numerous parallel causal feedback loops make it difficult to isolate the effects of a single decision or policy. Like chaos theory dictates, the outcomes of complex systems are impossible to accurately predict beyond a certain time step. Logically, if policy makers could predict the effects of the behaviors of market actors, programs and interventions could be designed with less uncertain (and criticized) effects. This is impossible to do without trial and error.
While neoclassical economics explains how trade can lead to growth and why individuals may decide to enter a market, academia has less to say about how heterogenous business strategies used by individual actors affect market systems in aggregate. In addition, the socio-cultural nuances unique to each country, district, and town make it difficult to generalize grounded findings or, inversely, adapt and apply theories developed from first principles. My research aims to fill a piece of this gap by exploring the incentives that motivate Ugandan traders to adopt various business strategies and the mechanisms by which said business strategies affect smallholder farmers. Though the context is unique, the causal structure of the system may be more universal.
Thus, there are three questions I address in the following chapters:
1. What business strategies are used by traders in Uganda?
2. How do these strategies affect farmers, and
3. What is the structure of the underlying system that governs mutually beneficial behavior?
I approach these questions using both qualitative and quantitative methods. The nature of a business strategy is qualitative in nature, and thus qualitative methods, described in detail below, were used to gather information about business strategies. Qualitative analytical methods were appropriate for drawing connections among and across interviews since the goal was to characterize the nature of business strategies used, not necessarily to discuss the extent to which each is employed in Uganda.
Quantitative methods, notably System Dynamics, were used to approach the second question. As explained in Chapter 5, System Dynamics modeling is useful for articulating the feedback loops and key factors that cause observed trends. Lacking comparable farmer-level data, System Dynamics modeling allowed me to develop a hypothesis about the ways in which trader business activities can benefit farmers. Section 6.3 notes opportunities for future work that elaborates on the feedback mechanisms I describe.
Finally, in the discussion in Chapter 6, I tie together the qualitative and quantitative analyses to propose incentives that exist or might exist to encourage traders to use business strategies that strengthen the market system. In particular, I analyze the reasons traders gave for why they use various business strategies and describe where incentives exist or might emerge in the market system.
Throughout, the analysis and conclusions reflect my interdisciplinary training in mechanical engineering, science and technology studies, and technology and policy. Having completed numerous technical projects with social components, my approach is to analyze data with the expectation that there is no singule 'right answer' to
3.2. QUALITATIVE METHODS
socio-technical inquiries, but that solutions can be designed. Nuance and details are important. Technologies, broadly defined, exist within complex contexts. Data and information present only snapshots of a more intricate landscape. The role of the researcher is to put the pieces together, fill in blanks with logic and previous work, and distill poignant, accessible insights.
In the sections and chapters that follow, I have attempted to piece together evidence to show that traders can and do make decisions that benefit farmers. Furthermore, there are opportunities for USAID and other development organizations to promote these mutually beneficial business strategies.
3.2 Qualitative Methods
Data was collected and analyzed using qualitative methods. Semi-structured interviews held in August 2016 and August 2017 were the primary source of information on trader business strategies and the reasons traders adopt them. Originally for related USAID/Uganda studies, interview reports were digitized and then analyzed using pattern matching, content analysis, and narrative analysis. The following sections describe the process used to
develop interview instruments, conduct interviews, and analyze the data.
3.2.1
Semi-Structured Interviews on Quality Differentiated Pricing
The first set of interviews, held in August 2016, explored the nature of quality-differentiated pricing (QDP) among Ugandan traders. Quality-differentiated pricing occurs when traders set prices based on crop quality. The extent of QDP in the Uganda market was previously poorly understood, and, per request of USAID/Uganda, we took an inductive approach to generate new theory on how traders evaluate crop quality and set prices.
This analysis used a multiple case study approach in which we compared the experiences of six Ugandan com-modity traders. Traders were purposively selected to represent variety in location, business size, comcom-modity, organizational structure, and level of success in providing and accessing quality-differentiated pricing. Research support was provided by the Feed the Future Uganda Commodity Production and Marketing Activity (CPMA) staff, who facilitated interviews with knowledge of local markets and language. Table 3-1 summarizes notable demographics of each trader.
An interview guide was developed to conduct semi-structured interviews with the traders. Two interviews were used as pilot studies. The interview guide was revised after reviewing transcripts and initial learnings from the pilots, and four additional interviews were held using the revised version, reproduced in Appendix B. Interviews lasted one to two hours and were accompanied by short tours of processing facilities and store rooms where appropriate.
Interviews were structured around four topics:
- Background: general information about what crops traders deal in, the numbers of farmers and village agents they work with, and who they sell to;
- Buying: how traders have improved the quality of crops they are able to buy; how they set their prices and purchase crops; and how they interact with village agents and farmers;
- Selling: learn how traders access markets and provide high-quality products to achieve good market prices; learn about the challenges they face in accessing markets and good prices; and,
CHAPTER 3. RESEARCH DESIGN AND METHODOLOGY
- Business practices: learn about how changes in business practices have affected quality and prices; learn about traders' goals for the future and barriers to progress.
In total, five MSM team members were involved in the interview process. Interviews were captured with an audio recorder and later transcribed. Field notes and short summaries were also recorded electronically. Data collection methods received approval from the MIT Committee on the Use of Humans as Experimental Subjects
(COUHES) and the Institutional Review Board of George Washington University to ensure appropriate handling
of human subjects information.
Table 3-1: Characteristics of traders interviewed in August 2016
Trader Region Organization Type Commodity Annual Production Storage Capacity
1 Central Multiple collectors, Bean Seed 300-500 MT 566 MT
sells domestically
2 Central Multiple collectors Coffee 730 MT 100 MT
3 Central Multiple collectors Maize (some Coffee) 500-1000 MT 100 MT
4 Central Multiple collectors Maize (some Beans) 700-1000 MT 250 MT
5 Western Cooperative; Coffee 280 MT unknown
farmers sell directly
6 Western Multiple collectors Maize 7,200 MT 10,300 MT
and distributors
Full analysis of QDP interview data is included in Appendix A, a report originally produced for USAID in March
2017. Relevant findings and analysis are discussed in Chapter 4.
3.2.2 Semi-Structured Interviews with Agribusinesses in Iganga District
The second set of interviews, held in August 2017, was used to understand and categorize the business strategies employed by different types of agribusinesses. Forty semi-structured interviews were held with traders, dealers, processors, and agents in Iganga district.
Interviews were designed to complement a survey on farmer market engagement, providing context around quantitative data. Iganga, one of the districts selected for the Farmer Market Engagement Study (FMES), was selected for additional interviews because of its proximity to Kampala, dense population, and availability of translators. Interviews lasted 45-90 minutes and were primarily conducted in Lusoga with the assistance of translators. With two interview teams, we completed forth interviews over five days.
Interviews were held in the trading centers of Busembatya, Namirembe, Idudi, and Iganga Town. Five inter-views were also held in villages ten to fifteen kilometers away from trading centers. Trading centers were pur-posively selected to represent different parts of the district. Within each location, we used a combined random walk/snowball sampling strategy to find interviewees. Upon arriving in a trading center, input dealers, traders, and processors could be identified by storefronts. At the conclusion of each interview, we asked for connections to other types of agribusinesses or business partners. This was how we were able to interview agents, who are often transient and lack a store or other permanent location.
3.2. QUALITATIVE METHODS
We aimed to interview two or three of each type of business in each trading center and overall completed between nine and twelve interviews with each type of actor. It quickly became clear that our notion of business typology was prematurely discrete, that agribusinesses often opportunistically adopted a portfolio of business activities that made them more difficult to define than we expected.
Interviews were semi-structured, with a list of questions that had pre-meditated answer choices for easy note-taking and additional space for explanations and commentary. Questions were divided into seven topics:
- Basic business information and demographics;
- Business model, including information on customers, suppliers, and whether the agribusiness works with agents;
- Ways the business engages with farmers, if applicable;
- Primary business activities (these questions were retrospectively used to better categorize business types); - How the business accesses information;
- Cost structure and access to finance; and,
- Narrative about how and why the business was started.
Additional questions were asked for each type of business, where appropriate. The interview questions have been reproduced in Appendix D for reference. Topics were approved by MIT COUHES prior to commencement of the interviews, and interviewees were compensated 20,000 UGX (about $5.00 USD). After all interviews were complete, notes were typed up in a format that corresponded with the interview questions. A memo with preliminary findings, reproduced in Appendix C, was delivered to USAID/Uganda shortly after interviews were complete.
3.2.3 Analysis of Interview Data
The objective of this analysis was to identify categories of trader business strategies observed in fieldwork. Inter-view data were approached from the methodological perspective of grounded theory, generalizing from empirical evidence, narrative accounts, and observation.
For the traders interviewed on Quality-Differentiated Pricing, findings emerged through coding and pattern matching. Interview recordings, field notes, and memos were transcribed and reviewed. Important themes were identified via a deep reading of one transcript. Rather than cherrypicking mentions of pre-determined topics, attention was devoted to emergent topics that came up in discussion. These themes were then compared to the research questions and used to construct a set of codes, tags used to annotate transcripts. Codes included: Quality perception, Quality change, Action taken to improve quality, Driver of quality change, Price perception, Price change, Action taken to improve price, Driver of price change, Price based on quality, Driver of QDP, Buy, Sell, Decision-making on buy/sell, Decision making on investment, Transaction process, Goals, Challenges, Requests, Sustainability, Intervention, Relationship, Relationship change.
Once a list of codes was developed, the interview transcripts were reviewed and annotated in Atlas.ti, which allowed coded text segments to be sorted and collected thematically. Subsequently, patterns were identified throughout the transcripts. Notes on main themes were recorded on worksheets and in a Microsoft Excel spread-sheet. The data tables that appear in Chapter 4 were constructed based on careful analysis and review of transcript quotes. Each data point was cross referenced to a transcript and considered in context for relevance.
CHAPTER 3. RESEARCH DESIGN AND METHODOLOGY
For the interviews conducted in Iganga, findings were derived from similar pattern matching analyses and nar-ratives. Since interviews were more structured and reports were typed in a format that retained the original questions asked, no coding was necessary; data that corresponded across interviewees was already tagged, in a sense. Again, spreadsheets were used to make notes of the similarities and differences among respondents. In addition, field notes and reflections diligently recorded during the interview period were important in this analysis, providing observational evidence to enhance the content provided by interviewees.
In the analysis of this second set of interviews, special attention was paid to the rationale behind decisions made by agribusinesses and the context in which these decisions were made. Ultimately, the rationale underlying decisions made in various contexts was distilled to a more nuanced understanding of the types of business strategies used. These rationale were then analyzed using system dynamics modeling, as described in the next section.
3.3 System Dynamics Modeling Methodology
Findings from the qualitative analysis described above were used to develop a system dynamics model of a farmer-trader transactional relationship. With system dynamics, differential equation models are developed using a graphical interface that enables iterative analysis of causal structures. Rather than building a model and assessing the outputs of the model, as is often the case with mathematical modeling, system dynamics modeling can be explanatory. Once a model can recreate known trends, or reference modes, the causal structure of the model can be analyzed more deeply.
My goal was to build a model that simulates known cash and inventory flow, then systematically change variables
and connections to observe the effect each part has on cash and inventory levels for traders and farmers. I developed the base model using Vensim software, drawing on model structures from literature and causal links identified by traders in interviews. The base model was considered complete when simulations showed trends that mimicked the known reference modes described above. I then added additional variables and structure to simulate the potential effects of different business strategies and articulate why these strategies work. The model is explanatory, rather than predictive.
Reaffirmed in interviews, we know that farmer cash is highest during harvest and lowest during the growing season. Consequently, farmers are most vulnerable to financial shocks that occur during the growing season. The dynamic hypothesis that guided model building was that this volatility is due to the fact that farmers face long delays between periods of earning income. Chapter 5 describes the model building process and how this dynamic hypothesis was clarified and assessed.
The shortcomings of qualitative data analysis are well documented. In this case, the sample size is small, inter-views were localized, and, though legitimate methods in social science research, snowball and random walk sam-pling likely introduced selection bias. Coding is not an exact science, allowing room for interpretation of cultural and linguistic nuances. No doubt, another researcher would read into interview reports with a different perspec-tive. Throughout, I have tried to be transparent in communicating the logic used to draw conclusions.
Yet, these methods are appropriate for answering the research questions. This thesis is not intended to distill uni-versal truths, but rather to examine rationale offered by Ugandan traders and unravel the causal influences and effects of their' decisions. In addition, this work provides an example of how system dynamics, paired with qual-itative data, can be used to identify drivers of systemic change in an international development context.
'Recognizing that Ugandan agribusinesses are operated by both men and women, I have chosen to use the gender-neutral they/their pronouns throughout.
21
Chapter 4
Trader Business Strategies
Through qualitative analysis of interview data, I propose a taxonomy of trader business strategies. There are four high level ways that traders grow their business: increase quantity sold, improve quality, sell at higher prices, and diversify business activities. Quantity, quality, price, and activities can be thought of as pathways to business growth; traders then adopt sets of strategies to cause change in one or more of these dimensions. Approaches to alter quantity, quality, price, and activities are not mutually exclusive. On the contrary, they are tightly intertwined. This section first addresses the diversity and fluidity of trader business activities, then dis-cusses how said activities affect quantity, quality, and price. Secondary analysis investigated how these strategies mutually benefit traders and farmers.
4.1 Traders opportunistically diversify business activities, often filing
multiple roles
During interviews, it quickly became clear that actors do not play discrete, exclusive roles such as those defined
by the Market System Monitoring activity (Figure 2-1 is reproduced here for reference). Agribusiness activities
often span several roles. For example, a business that operates a milling machine might also buy and sell grain at the wholesale level, filling the roles of both processor and trader. Some businesses that identify as traders also have storefronts where they sell grain at the retail level.
Inputs Outputs Reoa
- - - nMM
-401 eaibxdSesica
Many of the business owners interviewed started out playing a single role in the market, usually one that required low startup capital such as using a bicycle to collect and sell grain, and then diversified to take advantage of new opportunities. Several role combinations appeared frequently among actors who self-identified as traders or whose primary business activities fall under the trader role:
e Trader: buys from collectors/agents/brokers and sells to other businesses. These pure traders do not
interact with farmers or end consumers.
* Trader-collector: may buy from other businesses, but also has direct interactions with farmers. These traders have potential to provide farmers with production services, improved inputs, information, and credit.
CHAPTER 4. TRADER BUSINESS STRATEGIES
* Trader-processor: usually buy from and sell to other businesses, but also transform commodities. Some
trader-processors own processing equipment, some pay for processing services. Regardless, these traders purchase one commodity and sell a transformed commodity For example, they may purchase whole grain maize and sell maize flour.
- Trader-retailer: buys from other businesses (traders or collectors) and sells to individuals in local markets. - Trader-exporter: buys from other businesses (traders or collectors) and sells to buyers in other countries. Agribusinesses that self-identify as traders seem to move smaller quantities and purchase from a smaller geographic area than those who identify as exporters.
Some traders and collectors who identified as 'agents' or 'brokers' filled more than two roles. When asked why they started their business, a common response was that they saw trading, processing, exporting, etc. as a way to overcome poverty and have a more stable livelihood. As their businesses grew, they were able to invest in additional assets (e.g. milling machines, silos, trucks) and diversify business activities, effectively assuming more roles.
While the role map framework is useful for understanding the various activities that take place to move com-modities from producers to consumers, actors rarely play one role exclusively. Rather, diversification into new roles is seen as an opportunity, one of which many agribusinesses take advantage.
4.2 Increasing quantity sold
Traders often commented that their businesses are limited by the current yields and volumes of crops they trade. This sentiment was sometimes framed as a request for further trainings that would help them work with farmers to increase yields. Sometimes, it was a lamentation that limited supply prevents them from becoming exporters themselves. Overall, it was clear that quantity is a significant obstacle in the minds of the traders. Traders understand that there are several avenues by which increased quantity leads to growth, evidenced by statements such as:
"The money I have determines the amount I can buy" "If I have money, I buy as much as I can"
"I saw this was the business that could lift me from poverty..You buy your stock and sell it in bulk to make the difference."
"The amount we buy depends on the amount of money we have. We store in bags in the house and spray the room."
"I need more farmers [so that more grain is available to buy]"
These quotes and others reveal a number of tactics by which traders increase the quantity they sell. Table
4-1 summarizes these modalities in generic terms. The quantity purchased and sold depends on the number of
suppliers, the amount each supplier can sell, the amount lost to spoilage, and capacity constraints.
Of these tactics, increasing yields and reducing loss warrant further inspection. After all, farmers, not traders,
are responsible for determining the quantity grown per acre and preventing short-term spoilage. Farmers can use a variety of techniques, known as Good Agricultural Practices (GAP), to increase yields. These practices include irrigation, soil-maintenance techniques, use of fertilizers, planting drought-resistant varieties, spraying pesticides and herbicides, harvesting when crops are ripe, and the use of quality inputs (as opposed to counterfeits, which are rampant in Uganda.) When farmers use Good Agricultural Practices, they can expect to produce more crops 22
4.2. INCREASING QUANTITY SOLD
Table 4-1: Factors that affect trader quantity
Quantity Determinant Description
Number of Suppliers Traders can increase the number of farmers and other suppliers they source
from. If each supplier can provide a certain amount of grain, the effect of adding more suppliers is multiplicative.
Farmer Yield Some traders work closely with farmers, training them in ways to increase the
quantity produced on a given plot. Yield is greatly improved when farmers use Good Agricultural Practices.
Post-Harvest Loss Using good post-harvest handling practices, including drying and hermetically
sealed storage bags, farmers and traders can both reduce spoilage and crop infestations. With less loss, traders have more quantity to sell.
Storage Traders can purchase additional silos to increase the space they have for grain
storage. Increased storage allows them to purchase more grain when it is avail-able, alleviating one of the budget constraints on purchase quantity
Cash Traders purchase what they can afford. Some keep records to assist in assessing
how much cash to invest in purchases.
According to traders, the quantity of commodities they deal in is affected by the number of suppliers they have, the amount produced
by each supplier, the amount lost to spoilage post-harvest, and the amount they can purchase given storage space capacity and cash
constraints.
per acre than without. Similarly, farmers who use good Post-Harvest Handling practices (PHH) can prevent post-harvest loss by drying crops to prevent spoilage.
Traders, then, can affect the quantity produced by encouraging farmers to use GAP and PHH. Traders typically engage farmers through:
- providing trainings, demonstrations, and continuing advice; - offering spraying and pruning services;
- providing farmers with quality inputs or credit for inputs at the beginning of the season; and - giving traders tarps to dry crops after harvest.
Interestingly, through these activities a trader takes on the role of a provider of agricultural production services or extension services. As a provider of extension service, traders equip farmers with knowledge and skills to be more productive. There is a suite of services and trainings recommended by USAID/Uganda and other develop-ment organizations, all intended to help farmers increase yields and improve crop quality. Traders may arrange trainings with an external organization, train farmers themselves, or provide ad-hoc advice. Topics range from use of good agricultural practices to proper post-harvest handling techniques. Traders who invest in farmer skills and knowledge typically have relationships with farmers that go beyond transactions.
Since no interviews were held with individuals who identified as service providers, little information was available for deeper analysis of how being a service provider benefits traders. At the surface, provision of services increases agricultural productivity, which in turn increases trader income, which enables traders to continue providing services. Yet, there is likely something deeper going on; many traders seem to provide these services out of obligation to farmers with whom they have established business or personal relationships, not as a business strategy on its own. The role of the service provider is enacted in extraordinarily diverse ways and provides
CHAPTER 4. TRADER BUSINESS STRATEGIES
ample opportunity for further investigation.
Formal financial services are expensive and scarce in rural Uganda. Some traders lend cash or give cash ad-vances to farmers. Some provide farmers with financing to purchase seeds and fertilizer at the beginning of the growing season or provide farmers these inputs directly. This form of in-kind credit can enable farmers to plant more than they may have otherwise been affordable. Often, when traders provide credit they arrange buying agreements with farmers that are enforced through verbal agreements and social capital or, occasionally, official signed contracts. Providing inputs allowed farmers to plant and, in some cases, also ensured that farmers were using quality inputs. Counterfeits are common in Uganda. Some manufacturers dilute chemical fertilizers and pesticides. Often, seeds are old or have an extremely low germination rate. Several third-party services have arise to mark verified inputs using ICT-enabled scratch labels, but have had difficulty gaining traction among farmers. Traders who are aware of these services or have direct connections to quality input dealers can procure quality products for their farmers. Providing tarps reduces post-harvest loss. Both efforts increase the quantity produced by farmers.
4.3 Improving quality
For many traders, improving quality is another strategy for growing business. Some traders claim that their reputation is staked on quality, that customer retention depends on delivering reliable goods. For others, quality-differentiated pricing and reduction in post-harvest loss are sufficient financial incentives for investing in quality. Objectively, attention to crop quality is important for avoiding public health hazards like aflatoxins and for im-proving food security by reducing loss to spoilage and insect infestations.
Uganda subscribes to the East African Grain Quality Standards, established by the East African Community, but has few policies or regulations in place to incentivize investment in quality improvement for domestic markets. For export commodities, including coffee and maize, quality standards are imposed by international buyers. Coffee quality standards, for example, are enforced because exporters will only be able to sell coffee that has been adequately preserved and processed. Certain types of crop certifications (e.g. organic, non-GMO) impose additional quality requirements that require verification by a third-party auditor. However, few farmers in Uganda are currently subject to or have access to these avenues of quality enforcement. Instead, quality is perceived and adjusted according to less formal heuristics.
Though quality is measured in different ways for different crops, interviews revealed that there are common attributes traders consider when evaluating quality. While formal quality standards are not always in effect, Table 4-2 briefly describes a number of quality attributes that traders consider when buying and selling. For some attributes, there are things traders can do to improve quality. Similar to the quantity determinants described above, each tactic has context-dependent nuances. Some traders differentiated quality based on well-defined grades. For example, maize traders identified five grades of milled maize that depend on coarseness of grind and whether the bran has been removed. One trader similarly noted three grades of beans. In the case of coffee, traders distinguished between kiboko and Fairly Average Quality (FAQ), the former of which is dry, unprocessed coffee cherries and the latter is hulled. Traders who discussed grade said that different grades fetch different prices and agreed that there were clear differences between grades.
For other quality attributes, the line between good and bad quality is more ambiguous, partly due to lack of measurement technologies. Moisture content, for example, can be estimated by placing a few pieces of grain inside an empty water bottle with salt; if the salt sticks to the side of the bottle, the grain is not dry enough. In 24
4.3. IMPROVING QUALITY
Table 4-2: Quality attributes described by traders
Quality Attribute Description
Moisture content Foreign matter Spoilage
Roughage
Size and shape
Color Grade Variety
The percentage of water in a product; generally, drier products are considered higher quality since they perish less quickly.
Rocks and other inedible objects reduce the quality of goods and must be removed. Molds and bacteria can cause crops to spoil, leaving metabolites linked to cancer and liver disease. Aflatoxins are harmful metabolites present in spoiled maize; Ochratoxin-A is a similar byproduct in coffee.
Coffee and maize have hulls-roughage-around the seed and grain, respectively, that are removed during post-harvest processing. Crops with hulls intact are con-sidered lower quality
Small and/or deformed crops are less desirable. They may be indicative of poor agricultural practices or poor growing conditions. Traders use screens of different mesh size to sort crops like maize or rice by size.
In the case of coffee, the color of the hull indicates maturity. When coffee berries are red (cherries) they are ready for harvest.
Coarseness of grind for commodities that are milled (e.g. maize, wheat, millet, cassava) is perhaps most universal. The finer the grind, the higher the grade. For some crops, certain genetic variants are valued more highly and considered better quality Arabica coffee is considered better quality than Robusta, for exam-ple. Some species of rice have larger grains.
Quality is multidimensional. Traders describe a number of commodity attributes that affect quality, listed here. Some attributes, such as variety, are discrete, while others, like amount of roughage in a milled commodity, are continuous.
Table 4-3: Tactics to improve crop quality
Quality Determinant Description
Good Agricultural Prac-tices (GAP) Post-Harvest (PHH) Processing Storage Handling
Certain production practices improve the quality of crops produced. Agrochem-icals can reduce damage from insects and plant diseases. Fertilizer and atten-tion to soil quality affect the size of produce and, for some crops, the flavor. Planting and harvesting at the right times affect crop size, color, and shape. Post-harvest handling practices include drying (to remove moisture and reduce perishability), grain cleaning (to remove dirt, rocks, and other foreign matter), and fumigation (to kill pests and prevent mold).
Overlapping with PHH, quality can be improved by removing hulls and milling. Processing is the key to increasing grade and transforming goods to higher value commodities.
Distinct from the other categories, which are mainly focused on improving quality, improved storage practices are paramount to preventing the loss of quality Using hermetically sealed storage bags and silos, crop quality can be preserved for longer periods of time by preventing infestations and rotting. Traders explained that crop quality is affected by the practices used in crop production, post-harvest handling, and processing. While these practices are intended to improve quality, storage technologies preserve current quality