HAL Id: hal-00297085
https://hal.archives-ouvertes.fr/hal-00297085
Submitted on 9 Apr 2008
HAL is a multi-disciplinary open access
archive for the deposit and dissemination of
sci-entific research documents, whether they are
pub-lished or not. The documents may come from
teaching and research institutions in France or
abroad, or from public or private research centers.
L’archive ouverte pluridisciplinaire HAL, est
destinée au dépôt et à la diffusion de documents
scientifiques de niveau recherche, publiés ou non,
émanant des établissements d’enseignement et de
recherche français ou étrangers, des laboratoires
publics ou privés.
Certified accuracy of rainfall data as a standard
requirement in scientific investigations
L. G. Lanza, L. Stagi
To cite this version:
L. G. Lanza, L. Stagi. Certified accuracy of rainfall data as a standard requirement in scientific
investigations. Advances in Geosciences, European Geosciences Union, 2008, 16, pp.43-48.
�hal-00297085�
Adv. Geosci., 16, 43–48, 2008 www.adv-geosci.net/16/43/2008/
© Author(s) 2008. This work is distributed under the Creative Commons Attribution 3.0 License.
Advances in
Geosciences
Certified accuracy of rainfall data as a standard requirement in
scientific investigations
L. G. Lanza and L. Stagi
Department of Construction, Environmental and Territorial Engineering, University of Genoa, Italy
Received: 30 August 2007 – Revised: 27 November 2007 – Accepted: 29 January 2008 – Published: 9 April 2008
Abstract. This paper elaborates on the rationale behind the
proposed standard limits for the accuracy of rainfall intensity measurements obtained from tipping-bucket and other types of rain gauges. Indeed, based on experimental results ob-tained in the course of international instrument Intercompar-ison initiatives and specific laboratory tests, it is shown here that the accuracy of operational rain gauges can be reduced to the limits of ±1% after proper calibration and correction. This figure is proposed as a standard accuracy requirement for the use of rain data in scientific investigations. This limit is also proposed as the reference accuracy for operational rain gauge networks in order to comply with quality assur-ance systems in meteorological observations.
1 Introduction
The impact of non accurate rainfall measurements on the re-sults of scientific investigation in rainfall related fields is not yet fully clear nor quantified. With the exception of very few dedicated papers (see e.g. La Barbera et al., 2002; Molini et al., 2001; 2005a, b) and/or various papers dealing with the analysis of measurement errors themselves (Adami and Da Deppo, 1985; Calder and Kidd, 1978; Marsalek, 1981; Maksimovi´c et al., 1991; Niemczynowicz, 1986), the issue of how deeply affected are the obtained results by the actual accuracy of the data sources is rarely addressed.
The scarce attention paid at the quality of data often poses serious doubts about the significance of the experimental re-sults made available in the literature. Obviously not in all cases the effects are really dramatic, since the error propaga-tion could be negligible as well, depending on the applica-tion. Nonetheless scientific soundness requires that all
possi-Correspondence to: L. G. Lanza
(luca.lanza@unige.it)
ble uncertainties are properly taken into account, and is there-fore clear that the quality of basic data sources – such as rain-fall measurements – should not be an exception. Also, cer-tified accuracy is needed for operational meteo-hydrological networks operating within the framework of a quality assur-ance system.
Rainfall is indeed the forcing input of the land phase of the hydrological cycle. The knowledge of rainfall, its vari-ability and the observed/expected patterns of rain events in space and time, are of paramount importance for most hy-drological studies, and a large number of consequences of such studies on the engineering practice are exploited in the everyday technical operation.
Traditionally, the volume of rainfall received by a collector through an orifice of known surface area in a given period of time is assumed as the reference variable, namely the rain-fall depth. Under the restrictive hypothesis that rainrain-fall is constant over the accumulation period, a derived variable – the rainfall rate, or intensity – can be easily calculated. The shorter the time interval used for the calculation, the nearer to the real flow of water ultimately reaching the ground is the estimated intensity. This approximate measure of the rain rate has been accepted for a long time as sufficiently accurate to meet the requirements of both scientific and technical ap-plications. Reasons for this are on the one hand that most tra-ditional applications in hydrology operate at the basin scale, thus dealing with a process of rainfall aggregation on large space and time scales, while on the other hand the available technology of measurement instruments – especially in terms of data storage and transmission capabilities – was lower than presently exploited.
Nowadays, the requirements are tighter and sound re-search in the geosciences does require enhanced quality in rainfall intensity measurements. The interpretation of rain-fall patterns, speculations about the nature of the rain field, scaling vs. non scaling issues, rainfall event modelling and forecasting efforts, everyday engineering applications, etc.,
44 L. G. Lanza and L. Stagi: Certified accuracy of rainfall data are all based on the analysis of rainfall intensity arrays that
are recorded at very fine intervals in time. Therefore the relevance of rain intensity measurements is dramatically in-creased and very high values of such “new” variable are recorded, due to the shortening of the reference time frame.
Precipitation intensity is defined by the World Meteoro-logical Organization (WMO) as the amount of precipitation, collected per unit time interval. According to this definition, precipitation intensity data can be derived from the measure-ment of precipitation amount using an ordinary precipitation gauge. In that sense, precipitation intensity is a secondary parameter, derived from the primary parameter precipitation amount.
The thirteenth session of the WMO Commission for In-struments and Methods of Observation (CIMO-XIII, 2002) noted that, as a result of an Expert Meeting held in Bratislava, Slovakia, in 2001, significant efforts were necessary in order to obtain the required information about uncertainties in rain-fall intensity measurements. CIMO-XIII adopted for precip-itation intensity the measuring range and related uncertain-ties as recommended by the expert team and published in the WMO Guide to Instruments and Methods of Observation (WMO-No. 8, 7th edition):
Full range: 0.02 to 2000 mm·h−1
(0.02 to 0.2 mm·h−1reported as “trace” or “rain detected”) Output averaging time: 1 min
Required measurement uncertainty:
– 0.2 to 2 mm·h−1: 0.1 mm·h−1
– 2 to 2000 mm·h−1: 5 %
The objective of this paper is to demonstrate, based on experimental results obtained in the course of international instrument Intercomparison initiatives and specific labora-tory tests, that the accuracy of operational rain gauges can be reduced far beyond the present requirements of the WMO Guide to Instruments and Methods of Observation (WMO, 2006), and contained in the limits of ±1% after proper cali-bration and correction.
This latter figure is proposed as a standard accuracy re-quirement for the use of rain data in scientific investigations, in case no explicit treatment of the errors derived from the uncertainty of source data is provided. Furthermore, this limit is also proposed as a reference accuracy to be met by operational rain gauge networks in order to comply with a reasonable quality assurance system in meteorological ob-servations.
2 Errors in rainfall intensity measurements
All types of rain gauges can be divided into catching and non-catching instruments. Gauges of the first group collect precipitation through an orifice of well-defined size and mea-sure its water-equivalent volume or mass that has been accu-mulated in a certain amount of time. At present, catching rain
gauges are widely used in operational networks to measure rainfall intensities and amounts. Instruments of the second group are commonly used as disdrometers for the detection of droplet size distributions. Rainfall intensity or amount can be calculated by mathematical integration over all particles passing a cross section in a certain time interval. As a point of concern, it has to be stated that at present there is no pri-mary or generally agreed reference standard for the tion of any type of rain gauge. Nevertheless, many calibra-tion practices have been developed, especially for catching rain gauges.
The errors due to the weather conditions at the collector, as well as those related to wetting, splashing and evaporation processes, are referred to as catching errors. They indicate the ability of the instrument to collect the exact amount of water that applies from the definition of precipitation at the ground, i.e. the total water falling over the projection of the collector’s area over the ground. Non-catching instruments may also show “catching” errors although they do not have any collector for rain water and the water is simply observed while falling through the sensing volume of the instrument.
On the other hand counting errors are related to the ability of the instrument to correctly “sense” the amount of water that is collected by the instrument. They can be experienced both in catching and non-catching type of instruments, al-though in the latter case the assessment of such errors is very difficult, and hard to be performed in controlled laboratory conditions. These errors may derive from the very different aspects of the sensing phase since the instruments may dif-fer in the measuring principle applied, construction details, operational solutions, etc.
This paper concentrates on the counting errors of tipping-bucket rain gauges (TBRs) and specifically on the correction procedures to be applied for appropriate post-processing of raw measured data. Although a residual uncertainty within
±5% can be easily obtained for properly calibrated instru-ments, the errors observed under constant flow rate condi-tions are still higher than those associated with other types of gauges (e.g. weighing gauges; WGs). However, under vari-able (real) rain intensity, TBRs have the potential to perform much better than weighing gauges since they have practically no delay in sensing rainfall variations at sufficiently intense rain rates. The objective of the present work is to demon-strate that the residual errors of TBRs can be reduced to less than ±1% provided accurate procedures are used for calibra-tion and suitable post-processing is implemented.
Typical counting errors of TBRs derive from the combina-tion of different factors:
– the uncertainty about the real volume of the bucket
when the tipping movement is initiated;
– the possible different behaviour of the two
compart-ments of the bucket;
L. G. Lanza and L. Stagi: Certified accuracy of rainfall data 45
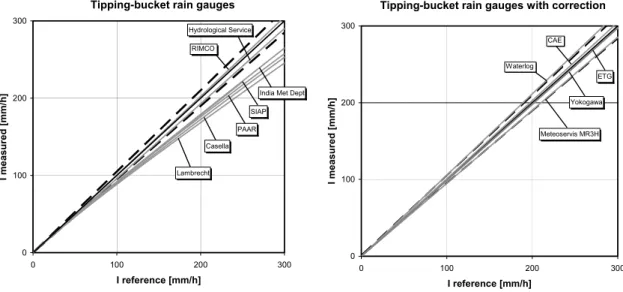
Tipping-bucket rain gauges Hydrological Service
PAAR India Met Dept SIAP Lambrecht Casella 0 100 200 300 0 100 200 300 I reference [mm/h] I m e a s u re d [m m /h ] RIMCO
Tipping-bucket rain gauges with correction
Meteoservis MR3H ETG Yokogawa 0 100 200 300 0 100 200 300 I reference [mm/h] I m e a s u re d [m m /h ] CAE Waterlog
±
Fig. 1. Response curves obtained for corrected/non corrected TBRs (dashed lines indicate ±5%, names of the manufacturers are reported as
curve labels).
– the mechanical error due to the water losses during the
tipping movement of the bucket.
The first source of error derives from using a nominal vol-ume instead of the actual figure to calculate rainfall intensity starting from the number of tips in a given time window. This can be used to compensate mechanical errors in order to lead to a zero error condition at a given rain intensity (and this au-tomatically produces an obvious overestimation effect at the lower intensities). The second source is due to the difference in the actual volume of the two compartments, which may not be the same in case of inappropriate balancing of the tip-ping device. This error reduces with increasing rain rates and may result in calculating different intensities depending on the number of tips recorded for each single compartment. As for the third source of error, it is well known that TBRs underestimate rainfall, especially at the higher intensities, be-cause of the rainwater amount that is lost during the tipping movement of the bucket. The related biases are known as systematic mechanical errors and can be quantified on aver-age as 10–15% at rain intensities higher than 200 mm·h−1.
3 The WMO Intercomparison of rainfall intensity gauges
The WMO performed a Laboratory Intercomparison of Rain-fall Intensity Gauges (LIRIG) from September 2004 to September 2005. The intercomparison was held simulta-neously in the laboratories of the Royal Netherlands Me-teorological Institute, M´et´eoFrance and, as project leader, the Department of Environmental Engineering (University of Genoa) – now DICAT. The main objective of this labora-tory intercomparison was to test the performances of
catch-ing type rainfall intensity gauges uscatch-ing different measurcatch-ing principles under constant flow rate conditions. Other objec-tives were to define a standardized procedure for laboratory calibration of catching type rain gauges, to comment on the need to proceed with a field intercomparison of catching type rainfall intensity gauges and to identify and recommend the most suitable method and equipment for reference purposes within the follow-on field intercomparison of catching and non-catching types of gauges. Finally, the aim was to pro-vide information on different measurement systems relevant to improving the homogeneity of rainfall time series with special consideration given to high rainfall intensities.
This LIRIG was the very first attempt at understanding of their performance, thus providing quantitative information regarding various errors associated with this measurement. The results provided basic information for the planning of the WMO Field Intercomparison of Rainfall Intensity Gauges, started in September 2007 in Vigna di Valle, Rome (Italy). The Final Report of LIRIG is available as IOM Report No. 84 (Lanza et al., 2005), and can be found on the Internet at the following URL:
http://www.wmo.int/web/www/IMOP/reports/ 2003-2007/RI-IC Final Report.pdf.
The results of the Intercomparison indicate that those tipping-bucket rain gauges that apply proper correction per-form quite accurately (see Fig. 1). As for the perper-formance of weighing gauges, their accuracy is debatable, being gen-erally higher than tipping-bucket rain gauges in terms of cu-mulated rainfall, although many of them are subject to a quite long delay in response, with large errors in the measurement of rainfall intensity. Other measuring principles were also tested, but the small number of instrument submitted (two) did not allow obtaining any conclusive information.
46
±
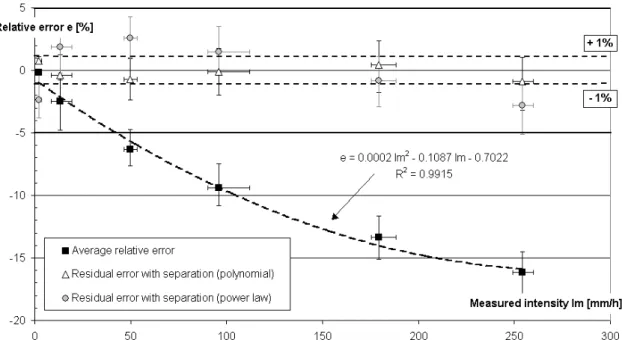
L. G. Lanza and L. Stagi: Certified accuracy of rainfall dataFig. 2. Average (family) error after separation of the errors and correction with a power law and polynomial curve for the ETG model.
The laboratory tests were performed under controlled con-ditions and constant flow rates (rain intensities) so as to de-termine the intrinsic counting errors. It must be considered that rainfall intensity is highly variable in time. Furthermore, catching errors may have a strong influence on the overall uncertainty of the measurement. The catching errors in the atmosphere are dependent on the wind field and during any field comparison tests the spatial variability of the precip-itation must be considered in the interpretation of the re-sults. The weather related conditions (wind, wetting, evap-oration, etc.) that may produce significant catching errors could hardly be reproduced in the laboratory, unless very large economical and human resources are involved. The same is true for calibration of non-catching types of gauges that were excluded for this reason from the Laboratory Inter-comparison.
4 The actual accuracy of tipping-bucket rain gauges
The WMO Intercomparison concluded that the ETG and CAE gauges (Italy) are the most accurate TBRs for the mea-surement of rainfall intensity since providing the less relevant errors over the respective actual range of intensities. These two Italian models were therefore investigated further in or-der to assess their potential performances after suitable cal-ibration in the laboratory is performed and the related cor-rection applied. A single corcor-rection curve, suitable for the whole family of gauges belonging to each model is sought as indicative of an average behaviour.
Each gauge was tested using the standard calibration pro-cedure established by WMO, and therefore both an error and a correction curve were derived per each gauge. Since the two manufacturers already apply some correction using post-processing software, both the raw and corrected data were recorded and plotted as a function of rain intensity using the operational procedure employed by the manufacturer. Note that while CAE employs a single correction curve for all the examined gauges, ETG applies an individual correction curve per each gauge. In order to obtain homogeneous data sets, an average curve was calculated for the ETG model and applied to all gauges, so the variability shown here is not representative of the actual performances of the individual gauges.
In order to improve the correction capabilities of the two instruments, the three sources of error defined in the intro-ductory paragraph were separately addressed. Therefore the actual capacity of the bucket was used in calculating the rain intensity, instead of the nominal volume, so as to later iso-late mechanical errors from the uncertainty due to improper counting of the contribution of each tip. The actual capacity was estimated based on the performances observed at intensi-ties where mechanical errors are negligible. The balancing of the two compartments was carefully performed, although the effect of such calibration is not relevant in this work, since long duration tests are performed and only average results are reported. On the other hand, the unbalanced capacity of the two compartments influences the one-minute rainfall intensity values that are requested in output by the WMO specifications.
L. G. Lanza and L. Stagi: Certified accuracy of rainfall data 47
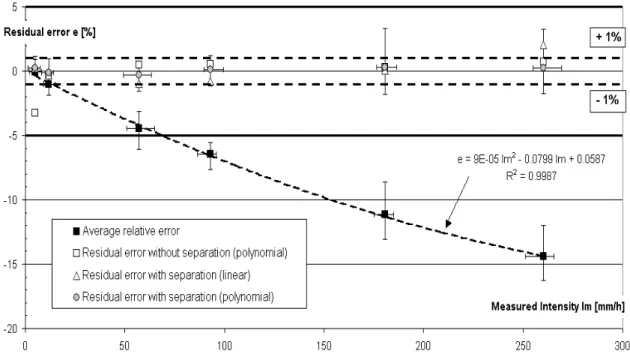
Fig. 3. Average (family) error after separation of the errors and correction with a linear and polynomial curve for the CAE model.
Based on the above considerations, the contribution due to systematic mechanical errors is now the only component of the relative error that is obtained as a result of the labora-tory tests under constant flow rate conditions. Note that the relative error is defined as:
e =Im−Ir Ir
·100% (1)
where Imis the intensity measured by the instrument and
Ir the actual reference intensity.
An error curve can be fitted to the experimental data in the (e, Im) space, a second order polynomial being the best
suited to represent the behavior of the gauges over the whole range of operation of the investigated instrument. The error curve is expressed as follows:
e(Im) = a · Im2+b · Im+c (2)
where the coefficients a, b, c are experimentally deter-mined.
Using this curve to derive a proper correction algorithm provides the best results in terms of residual errors, in the form:
Imc=
Im
e(Im)/100 + 1
(3)
where Imcis the corrected rainfall intensity according to the
test results.
The correction algorithm employed by CAE uses a linear expression for e(Im), while ETG uses a correction curve in
the form of a power law in the (Ir, Im) space.
The residual error is now analogously obtained by com-paring the corrected and actual rain rates, using the position:
e = Imc−Ir Ir
·100% (4)
In Figs. 2 and 3 the average correction curves providing the best fit of the experimental data for each family, or se-ries, of instruments are reported for the two types of rain gauges, and residual errors after correction are shown. Note that the actual volume of the bucket is used for calculation of the measured intensity Im.
The two instruments comply with the WMO requirements for rainfall intensity measurements (e=±5%) already with the correction applied by the manufacturers. It is also evi-dent that, after separation of the error components and use of the actual capacity of the bucket instead of the nominal one, calibration can be improved and the resulting residual errors can be limited to less than ±1%, even when an average (fam-ily) curve is used to perform such correction. Correction per-formed with individual curves per each single gauge further improves such results.
5 Conclusions
Results of laboratory tests performed on good quality TBRs indicate that correct balancing of the buckets is essential for
48 L. G. Lanza and L. Stagi: Certified accuracy of rainfall data good instrument performances at one-minute resolution,
al-though the average behaviour is scarcely influenced, while precise calibration of the bucket capacity is not essential, pro-vided the actual volume is used in calculating the resulting rain intensity instead of the nominal figure (although this is difficult to achieve in operational gauges). The actual volume can be determined based on the performances observed at the lowest intensities, where mechanical errors are negligible.
The variability of individual rain gauges with respect to the average correction curve is reduced when the above condi-tions are met and an optimal correction curve can be suitably determined in the laboratory for each model. After proper correction is applied, the residual errors on rain intensity measurements are lower than ±1% for the instruments inves-tigated and are comparable to those associated with weighing type of gauges – if not even lower in case one-minute resolu-tion is addressed according to the WMO specificaresolu-tions.
In order to determine the intrinsic counting errors, all tests were performed under controlled laboratory conditions and constant flow rates (rain intensities). Further tests are necessary to investigate the performances of TBRs, WGs and other types of gauges under variable (real) rain rate conditions, where catching errors may have a strong influ-ence on the overall uncertainty of the measurement. Also, non-catching types of rain gauges should be investigated (e.g. optical, radar, etc.), which was not possible in the laboratory phase. This will be accomplished in the course of the follow-up WMO Intercomparison of Rain Intensity Gauges in the Field, a presently ongoing effort at the test site of the Italian Military Aeronautics (Re.S.M.A.) in Vigna di Valle (Rome), Italy.
Edited by: S. C. Michaelides
Reviewed by: two anonymous referees
References
Adami, A. and Da Deppo, L.: On the systematic errors of tipping bucket recording rain gauges. Proc. Int. Workshop on the Correc-tion of PrecipitaCorrec-tion Measurements, Zurich, 1–3 April 1985. Calder, I. R. and Kidd, C. H. R.: A note on the dynamic calibration
of tipping-bucket gauges, J. Hydrology, 39, 383–386, 1978. CIMO-XIII: Commission for Instruments and Methods of
Observa-tion, Thirteenth Session, Final Report, Bratislava, 25 September– 3 October 2002, WMO Rep. No. 947 (available at http://www. wmo.int/pages/prog/www/IMOP/reports.html), 2002.
La Barbera, P., Lanza, L. G., and Stagi, L.: Influence of systematic mechanical errors of tipping-bucket rain gauges on the statistics of rainfall extremes, Water Sci. Techn., 45(2), 1–9, 2002. Lanza, L. G., Leroy, M., Alexadropoulos, C., Stagi, L., and
Wauben, W.: WMO Laboratory Intercomparison of Rainfall In-tensity Gauges – Final Report, IOM Report No. 84, WMO/TD No. 1304, 2005.
Marsalek J.: Calibration of the tipping bucket raingage J. Hydrol-ogy, 53, 343–354, 1981.
Maksimovi´c, `E., Buˇzek, L., and Petrovi´c, J.: Corrections of
rain-fall data obtained by tipping bucket rain gauge, Atmospheric Re-search, 27, 45–53, 1991.
Molini, A., La Barbera, P., Lanza, L. G., Stagi, L.: Rainfall inter-mittency and the sampling error of tipping-bucket rain gauges, Phys. Chem. Earth (C), 26(10–12), 737–742, 2001.
Molini, A., Lanza, L. G., and La Barbera, P.: The impact of tipping-bucket raingauge measurement errors on design rain-fall for urban-scale applications, Hydrol. Proc., 19, 1073–1088, 2005a.
Molini, A., Lanza, L. G., and La Barbera, P.: Improving the un-certainty of rain intensity records by disaggregation techniques Atmos. Res., 77, 203–217, 2005b.
Niemczynowicz J.: The dynamic calibration of tipping-bucket rain-gauges, Nordic Hydrology, 17, 203–214, 1986.
WMO: Guide to Meteorological Instruments and Methods of Ob-servation, WMO-No. 8, 7th ed., World Meteorological Organi-zation, Geneva, Switzerland, 2006.