HAL Id: hal-00301627
https://hal.archives-ouvertes.fr/hal-00301627
Submitted on 29 Jul 2005
HAL is a multi-disciplinary open access
archive for the deposit and dissemination of
sci-entific research documents, whether they are
pub-lished or not. The documents may come from
teaching and research institutions in France or
abroad, or from public or private research centers.
L’archive ouverte pluridisciplinaire HAL, est
destinée au dépôt et à la diffusion de documents
scientifiques de niveau recherche, publiés ou non,
émanant des établissements d’enseignement et de
recherche français ou étrangers, des laboratoires
publics ou privés.
Remote sensing of glacier- and permafrost-related
hazards in high mountains: an overview
A. Kääb, C. Huggel, L. Fischer, S. Guex, F. Paul, I. Roer, N. Salzmann, S.
Schlaefli, K. Schmutz, D. Schneider, et al.
To cite this version:
A. Kääb, C. Huggel, L. Fischer, S. Guex, F. Paul, et al.. Remote sensing of glacier- and
permafrost-related hazards in high mountains: an overview. Natural Hazards and Earth System Science,
Coperni-cus Publications on behalf of the European Geosciences Union, 2005, 5 (4), pp.527-554. �hal-00301627�
Natural Hazards and Earth System Sciences, 5, 527–554, 2005 SRef-ID: 1684-9981/nhess/2005-5-527
European Geosciences Union
© 2005 Author(s). This work is licensed under a Creative Commons License.
Natural Hazards
and Earth
System Sciences
Remote sensing of glacier- and permafrost-related hazards in high
mountains: an overview
A. K¨a¨ab1, C. Huggel1, L. Fischer1, S. Guex1, F. Paul1, I. Roer2, N. Salzmann1, S. Schlaefli1, K. Schmutz1, D. Schneider1, T. Strozzi3, and Y. Weidmann4
1Department of Geography, University of Zurich, Switzerland
2Department of Geography, University of Bonn, Germany
3Gamma Remote Sensing, Berne, Switzerland
4University of Applied Sciences, Muttenz, Basel, Switzerland
Received: 9 May 2005 – Revised: 1 July 2005 – Accepted: 1 July 2005 – Published: 29 July 2005
Abstract. Process interactions and chain reactions, the present shift of cryospheric hazard zones due to atmospheric warming, and the potential far reach of glacier disasters make it necessary to apply modern remote sensing techniques for the assessment of glacier and permafrost hazards in high-mountains. Typically, related hazard source areas are situ-ated in remote regions, often difficult to access for physi-cal and/or politiphysi-cal reasons. In this contribution we provide an overview of air- and spaceborne remote sensing methods suitable for glacier and permafrost hazard assessment and disaster management. A number of image classification and change detection techniques support high-mountain hazard studies. Digital terrain models (DTMs), derived from optical stereo data, synthetic aperture radar or laserscanning, rep-resent one of the most important data sets for investigating high-mountain processes. Fusion of satellite stereo-derived DTMs with the DTM from the Shuttle Radar Topography Mission (SRTM) is a promising way to combine the advan-tages of both technologies. Large changes in terrain volume such as from avalanche deposits can indeed be measured even by repeat satellite DTMs. Multitemporal data can be used to derive surface displacements on glaciers, permafrost
and landslides. Combining DTMs, results from spectral
image classification, and multitemporal data from change detection and displacement measurements significantly im-proves the detection of hazard potentials. Modelling of haz-ardous processes based on geographic information systems (GIS) complements the remote sensing analyses towards an integrated assessment of glacier and permafrost hazards in mountains. Major present limitations in the application of remote sensing to glacier and permafrost hazards in moun-tains are, on the one hand, of technical nature (e.g. combina-tion and fusion of different methods and data; improved
un-Correspondence to: A. K¨a¨ab
(kaeaeb@geo.unizh.ch)
derstanding of microwave backscatter). On the other hand, better dissemination of remote sensing expertise towards in-stitutions involved in high-mountain hazard assessment and management is needed in order to exploit the large potential of remote sensing in this field.
1 Introduction
The glacial, paraglacial and periglacial environment is de-fined, respectively, as the zone of glaciers or their action, the non-glacial zone directly conditioned by glaciation or deglaciation, and the non-glacial zone in cold regions with frost action being the predominant geomorphic process. Dis-asters associated to that environment can cause thousands of casualties in one event. Related damages or mitigation costs are on the order of several 100 million EUR as a long-term annual average global sum (K¨a¨ab et al., 2005). Glacier and permafrost hazards (here used as a synonym for glacial, peri-, and paraglacial hazards) in high mountains include glacier-and permafrost related floods, stable glacier-and unstable glacier length changes as well as glacier fluctuations, glacier- and permafrost-related mass movements, permafrost thaw settle-ment and frost heave, and hazards from glacier-clad volca-noes (Table 1). Often, combinations of these (and other) pro-cesses lead to the most severe glacier and permafrost catas-trophes. Whilst above direct glacier and permafrost haz-ards are very palpable, so too are indirect hazhaz-ards, such as changes in dry-season river flows, adverse effects on moun-tain tourism, and related socio-economic consequences.
Assessment and management of glacial, peri- and
paraglacial hazards require the application of modern inte-grative earth-observation techniques for a number of reasons:
– Typically, related hazard source areas are situated in
528 A. K¨a¨ab et al.: Remote sensing of glacier and permafrost hazards
Table 1. Overview of glacier- and permafrost-related hazards in high mountains, processes involved, important remote sensing aspects, and
selected remote sensing applications (see also GAPHAZ, 2004; Huggel, 2004; K¨a¨ab et al., 2005; Quincey et al., 2005).
Hazard type
Processes Remote sensing Selected remote sensing applications
(1) Glacier-and perma-frost-related floods
(1.1) Breaching of moraine dams
Outburst of moraine-dammed lakes. Par-ticularly far reaching glacier disasters (up to hundreds of km). Causes: enhanced runoff; impact waves (1.5); temporary damming/jamming at outlet.
Moraine-dammed lakes usually detectable by remote sensing, in particular optical tech-niques. Time series particularly useful for assessing lake dynamics and estimating fu-ture development. Assessment of moraine dam characteristics requires high-resolution and -precision techniques (dam geometry, deformation, settlement, surface material, etc.). Monitoring of associated glacier char-acteristics (geometry, surface type), changes and kinematics (thickness changes, veloc-ity) may help assessing the evolution of proglacial lakes.
(Buchroithner et al., 1982; K¨a¨ab, 1996; Ageta et al., 2000; Haeberli et al., 2001; Mool et al., 2001a, b; Huggel et al., 2002, 2004b)
(1.2) Failure or overtopping of ice-dams Outburst of ice-dammed lakes. Particularly far reaching glacier disasters. Often repeat-ing for permanent ice dams. Sources: ice-marginal or supraglacial lakes; temporary ice dams from ice avalanches (3.1) or glacier surges (2.1).
Detection of ice-dammed lakes depending on temporal resolution and timing of remote sensing system; detection of ice dams de-pending on spatial resolution and spectral characteristics. Time series particularly use-ful. Monitoring of thickness changes and kinematics of long-lasting ice dams supports assessment, e.g. of floatation level.
(Espizua and Ben-gochea, 1990; Haeberli et al., 2001; Huggel et al., 2002; K¨a¨ab et al., 2003c), (Fig. 4)
(1.3) Glacier outbursts
Catastrophic water discharge from the en-or subglacial drainage system. Causes: geothermal or volcanic activity; temporary en- or subglacial water storage; catastrophic water release connected to surge termination (2.1).
Particularly difficult or impossible to assess due to sub-surface character.
(Bj¨ornsson et al., 2001), (cf. Haeberli, 1983; Walder and Driedger, 1995)
(1.4) Breaching of thermokarst and supra-glacial lakes
On ice-rich permafrost or stagnant glacier ice. Progressive lake growth through ther-mal convection. Outburst causes: similar to (1.1), and progressive melt of ice/permafrost dam.
Detection of related lakes usually requires high image resolution due to the small lake size. Time series particularly useful. Dis-position of lake development partially de-tectable through remote sensing of surface characteristics and kinematics.
(Reynolds, 2000; K¨a¨ab and Haeberli, 2001; Wessels et al., 2002)
(1.5) Displacement waves
Displacement-wave impacts on people, nat-ural and artificial lake dams, and other instal-lations. Trigger for a number of lake outburst events of types (1.1) and (1.2). Causes: lake impact from snow-, ice-, rock-avalanches, landslides, debris flows, etc.; floatation of icebergs.
Assessment requires integrative remote sens-ing and modellsens-ing approaches of source pro-cesses.
No direct air- and space-borne remote sensing ap-plication. (cf. Haeberli and R¨othlisberger, 1975; M¨uller, 1995; Tinti et al., 1999; Walder et al., 2003; Zweifel, 2004)
(1.6) Enhanced runoff from permafrost Permafrost is for the most part impermeable for surface water, a fact that leads to runoff concentration at the permafrost table, in par-ticular with enhanced surface runoff from snow-melt and intense rainfall; ice melt at permafrost table. Temporary water storage in or underneath permafrost is particularly difficult to investigate but suggested for rare cases (causes: taliks; ice-melt in permafrost; (temporary) water blockage in or under the permafrost?). Both phenomena, runoff con-centration and water storage, may lead to un-usually enhanced runoff. Potential trigger mechanisms of debris flows (4.3).
Can hardly be directly investigated by re-mote sensing. No published remote sensing applications. (cf. Haeberli et al., 1990; Zimmermann and Haeberli, 1992)
A. K¨a¨ab et al.: Remote sensing of glacier and permafrost hazards 529
Table 1. Continued.
Hazard type
Processes Remote sensing Selected remote sensing applications
(2) Glacier length and volume changes
(2.1) Glacier surge (unstable length change) Temporary instability of large glacier parts with ice velocity increased by an order of magnitude (or more). Usually accompanied by drastic glacier advance. Besides the di-rect impact from glacier advance (overriding of structures, blockage of rivers, etc), glacier surges often trigger further hazards such as ice-dammed lakes (1.2). Enhanced englacial water storage, possibly released at surge end (1.3).
Surges can be tracked by high-frequency re-mote sensing. Former glacier surges, and thus surge-type glaciers, can often be recog-nised from deformed, so-called ”looped” moraines. Geometry changes, if involved in the surge disposition and build-up, can be de-tected as glacier thickness changes.
(Espizua and Ben-gochea, 1990; Zhang, 1992; Rolstad et al., 1997; Jiskoot et al., 2001; Luckman et al., 2002; Strozzi et al., 2002; Copland et al., 2003; Dowdeswell and Benham, 2003), (Figs. 1, 13 and 17)
(2.2) Stable glacier advance
Advancing glaciers may inundate land, over-ride installations, dam rivers and form lakes (1.2), cause ice break-offs (3.1), etc. Causes: positive mass balance, ice dynamics.
Can usually be monitored by remote sensing. Glacier area changes from repeat imagery, glacier mass changes from repeat DTMs. Forecast best done by a combination of re-mote sensing, glaciological field work and modelling.
(K¨a¨ab, 1996; Paul, 2002) and many others (see text)
(2.3) Glacier retreat
Glacier retreat forms usually no direct haz-ard but is able to trigger a number of sec-ondary hazards such as various slope insta-bilities (3). Causes and remote sensing see (2.2).
(Silverio and Jaquet, 2005), see (2.2) and (3), (Fig. 2)
(2.4) Changes in glacier runoff and season-ality
Glacier mass loss leads to reduction of wa-ter resources as stored in glaciers and to changes in dry-season river flows. Short-term perspective: increasing discharge due to enhanced melt; long-term perspective: de-creasing discharge when glaciers become substantially smaller or disappear. Conse-quences for drinking water supply, irrigation, hydropower production, industrial water use, fishery, water quality, etc.
Best investigated through a combination of remote sensing, meteorology, and combined glaciological and hydrological modelling. Causes and remote sensing see (2.2).
(Huggel et al., 2003a), see (2.2) and (Wagnon et al., 1999)
physically for topographic, political and/or security rea-sons (Fig. 1).
– The remote location of most glacial hazard sources, the
potential process interactions and chain reactions, and the far reach of some of the high-mountain hazards re-quire remote sensing sensors capable to cover large ar-eas at once (Fig. 1).
– Climate change induces disturbance in glacier and
per-mafrost equilibrium and can shift hazard zones beyond historical knowledge. In addition, human settlements and activities increasingly extend towards endangered
zones in many regions. As a result, historical data
alone are not sufficient any more for hazard assess-ments and have to be combined with new observation and modelling approaches (Grove, 1987; Evans and Clague, 1994; Haeberli and Beniston, 1998;
Richard-son and Reynolds, 2000; Huggel et al., 2004a; K¨a¨ab et al., 2005).
– Due to the rapid change of high-mountain
environ-ments, hazard assessments shall be undertaken routinely and regularly, combined with continuous monitoring. Remote sensing is particularly suited for both regular and rapid observation.
Recent developments in air- and spaceborne remote sensing open up new possibilities for the assessment of natural haz-ards in general (Mantovani et al., 1996; Sabins, 1997; Ostir et al., 2003) and glacier and permafrost related hazards in particular (Huggel, 2004; K¨a¨ab, 2004; Quincey et al., 2005). Remote sensing will therefore substantially gain importance for such works in the near future. Obstacles to the full ex-ploitation of the remote sensing potential for high-mountain hazard assessments are of technical nature, on the one hand, but also due to the lack of expertise dissemination, on the other hand. The present contribution provides for the first
530 A. K¨a¨ab et al.: Remote sensing of glacier and permafrost hazards
Table 1. Continued.
Hazard type
Processes Remote sensing Selected remote sensing applications
(3) Glacial and para-glacial mass movements
(3.1) Ice fall and ice avalanches
Ice break-offs and subsequent ice avalanches from steep glaciers. In rare cases detach-ment of complete glaciers. Particularly dan-gerous in winter with reduced basal friction, extended runout, and mass gain from snow. Glacier parts can fail due to a failure of the underlaying rock (3.2). Ice avalanches can be triggered by earthquakes. Ice avalanches can trigger lake outbursts (1.5), dam rivers (1.2), transform into mud/debris flows (3.5) (3.6).
Detection of steep glaciers through combi-nation of spectral data with DTM. High-resolution, -precision, and -frequency re-mote sensing (e.g. terrestrial close range techniques) enables sometimes monitoring of mass changes and kinematics related to entire steep glaciers or unstable sections.
(K¨a¨ab, 1996; Clague and Evans, 2000; K¨a¨ab, 2000; K¨a¨ab et al., 2003c; Salzmann et al., 2004) (Fig. 20)
(3.2) Rock fall, rock avalanche
Glacier retreat uncovers and debuttresses rock flanks. The related change in ther-mal, hydrologic, hydraulic and mechanic conditions can lead to rock fall and rock avalanches (fast mass movement). Rock avalanches can carry parts of overlaying glaciers. Rock avalanches can be of in-creased magnitude in glacial environments (extended runout on glaciers or when com-bined with ice, mass gain from ice, entrain-ment of glacier parts through impact, detach-ment of glaciers overlaying the rock mass breaking off). Rock avalanches can be trig-gered by earthquakes.
Mapping of rock faces and some bound-ary conditions (e.g. glacier retreat) possible through remote sensing.
(K¨a¨ab et al., 2003c; Huggel et al., 2005) (Figs. 1 and 2)
(3.3) Landslide/rock slide
Among other causes, glacier retreat (2.3) or slope undercutting by floods uncovers and debuttresses rock and debris flanks. The re-lated change in hydrologic, hydraulic and mechanic conditions can lead to mass move-ments (slow mass movement). These can create secondary hazards such as river dams.
Landslide surface characteristics, geometry and kinematics can be monitored by repeat high-resolution and -precision remote sens-ing.
(Mantovani et al., 1996; K¨a¨ab, 2002; K¨a¨ab, 2004; Singhroy and Molch, 2004)
(Figs. 15 and 19)
(3.4) Destabilisation of unconsolidated glacial deposits
Glacier retreat (2.3) leaves unprotected and unconsolidated moraine material that is prone to enhanced erosion and debris flows.
Related zones can be detected trough remote sensing combined with DTMs.
(Huggel et al., 2004b)
(3.5) Debris flows from glacier floods Glacier and permafrost floods (1) are often accompanied by debris flows when erodi-ble material is availaerodi-ble in steep parts of the flood path. Such debris flows can show a sequence of erosion and deposition. Debris flow deposits may dam tributaries or main rivers.
Remote sensing with sufficient spatial reso-lution supports estimating the availability of debris in a potential flood path and its slope (i.e. disposition to erosion or deposition).
see (1)
(3.6) Interaction between volcanic activity and glaciers
Potentially among the most devastating glacier disasters. Enhanced geothermal ac-tivity, geometric and mechanic changes, de-position of hot eruptive materials, or albedo change by volcanic ash can lead to drastic melt of ice or ice break-off on ice-clad vol-canoes and to volcanic landslides or lahars. Ash layers thicker than some mm-cm insu-late the underlying ice.
Ice cover on volcanoes and its changes (and partially also volcanic activity) can be moni-tored by remote sensing (see 2)
(Bj¨ornsson et al., 2001; Dean et al., 2004; Julio Miranda et al., 2005) (Fig. 23)
A. K¨a¨ab et al.: Remote sensing of glacier and permafrost hazards 531
Table 1. Continued.
Hazard type
Processes Remote sensing Selected remote sensing applications (4) Perma-frost- and ground ice-related mass movements
(4.1) Adverse effects of permafrost creep Permafrost creep (often forming rock-glaciers) can inundate land and destabilise or destroy constructions situated on or in it. Cause: gravity-driven deformation of ice-rich debris.
Monitoring of permafrost deformation by re-peat high-resolution optical remote sensing and DInSAR.
(K¨a¨ab, 2000; K¨a¨ab, 2002; Kenyi and Kauf-mann, 2003; Strozzi et al., 2004), (Figs. 11 and 18)
(4.2) Thaw settlement and frost heave Changes in permafrost surface geometry due to changes in ground ice content from ice-lense accumulation or thermokarst pro-cesses. Affecting constructions; possibly triggering thermokarst lakes (1.4). Thaw and frost heave processes may be caused by constructions (e.g. changes in snow cover regime, basement heating).
Monitoring of geometry changes from repeat high-precision DTMs.
(K¨a¨ab et al., 1997), (Fig. 11)
(4.3) Debris flows from permafrost Permafrost thaw changes mechanic and hy-drological conditions in permafrost. As a consequence the disposition of periglacial debris flows may increase. Temporary runoff concentration (1.6) and ground saturation is, thereby, often involved as trigger.
Only detectable using remote sensing when accompanied by changes in surface geome-try (4.2).
(K¨a¨ab, 1996; Hoelzle et al., 1998)
(4.4) Rockfall from rockglacier front Advance of rockglaciers involves continu-ous transport of surface debris over the rock-glacier front. This may lead to local rockfall endangering people and mountain infrastruc-ture.
Remote sensing see (4.1) (Bauer et al., 2003; K¨a¨ab and Reichmuth, 2005)
(4.5) Destabilisation of frozen debris slopes In rare cases entire sections of rockglaciers or frozen debris slopes might destabilise. Reasons largely unknown (dynamic, ground warming, ?). Can lead to (4.1), (4.3), and (4.4).
For slow movements detectable using high-resolution remote sensing (4.1 and crevasse formation).
(Kaufmann and Ladst¨adter, 2002; Roer et al., 2005), (Fig. 14)
(4.6) Rockfall and rock avalanches from frozen rock faces
The thermal regime and ground ice in frozen rock faces have complex thermal, mechan-ical, hydraulic and hydrological effects on rock stability. Related changes can cause mass movements. Processes often also re-lated to surface ice (3.2).
Remote sensing see (3.2). (Fischer, 2004; Noetzli et al., 2005), (Fig. 2)
time a comprehensive overview of remote sensing methods available for glacier and permafrost hazard assessments in mountains. The wide range of, partially novel, application studies discussed aims at evaluating and demonstrating the potential and limits of remote sensing in the topic considered. In this way the contribution intends to elaborate present search needs, but also to contribute to the dissemination of re-mote sensing methods for high-mountain hazard assessment and management.
The first part of the paper concentrates on the acquisition of base data, covering a method overview (Sect. 2), image classification (Sect. 3), production of digital terrain models
(DTMs; Sect. 4), computation and analysis of terrain eleva-tion changes (Sect. 5), and measurement of surface displace-ments (Sect. 6). The second part focuses on the integration of these data into hazard assessments, and on advanced analysis methods including the detection of hazard sources (Sect. 7), modelling of hazard potentials (Sect. 8), and disaster man-agement (Sect. 9). Conclusions and perspectives finalize this overview article.
532 A. K¨a¨ab et al.: Remote sensing of glacier and permafrost hazards
FIGURES
Fig. 1.
Fig. 1. Synthetic oblique views computed from sections of ASTER satellite scenes draped over ASTER-derived DTMs. Up-per panel: area at the Pik Ismail Somoni in the Tajik Pamirs with a typical surge-type-glacier as indicated by deformed (“looped”) moraines (Lat.:39.9◦N, Lon.: 72.1◦E; terrain section shown roughly 15×15 km). Lower panel: rock/ice-avalanche event in the Tajik Pamirs from around spring 2002 (38.8◦N, 71.9◦E; terrain section shown roughly 10×10 km). The upper image is Landsat ETM+ data from 2000, the lower is ASTER data from 2003. The red arrow points to the approximate source zone of the avalanche, the yellow arrows point to lakes dammed by the avalanche deposits. The avalanche deposits cover an area of roughly 6×10⁶m2, hori-zontal runout distance is roughly 10 km, and vertical drop roughly 2000 m (overall slope roughly 11◦).
2 Method overview
2.1 Important factors
The applicability of remote sensing for high-mountain haz-ard assessments is predominantly governed by the following factors:
– The “spatial resolution” of the sensor decides about the
degree of detail that can be detected from the data. Of-ten, fine resolution is required to assess important pa-rameters of glacier- and permafrost hazards (e.g.
dis-crimination of debris versus rock surface). In
or-der to characterise spatial resolution, we use here the terms high resolution (<5 m) and medium resolution (5–100 m). Low (100–1000 m) and very-low resolution systems (>1000 m) are not covered in this overview.
– The “spatial coverage”, i.e. the ground area or width
of the ground track sensed is roughly related to the spatial resolution of the sensor through technical con-straints e.g. concerning detectable level of incoming sig-nal strength (sensor noise-level), or onboard-recording and down-link capacities. While, for instance, medium-resolution Landsat, IRS, or ASTER data are very useful for first-order regional-scale hazard assessments, high-resolution IKONOS, QuickBird, or Orbview data are preferable for detailed local-scale investigations. SPOT-5 data (up to 2.SPOT-5 m resolution, 60 km scene width) com-bine both advantages to some extent.
– The “temporal resolution”, i.e. revisit time of the
re-mote sensing system has to be in agreement with the rate of hazard development, or the changes observed. The temporal resolution of a system is among others connected to its spatial coverage, and to the pointability of the sensor, e.g. how far the sensor can be rotated in cross-track direction in order to cover areas far off the ground-projected track. As an example, the ASTER vis-ible and near infrared (VNIR) instrument can be pointed
up to ±24◦allowing for repeat imaging as frequently as
every two days (and better in high latitudes) for urgent priorities. For instance, annual resolution might be suf-ficient to monitor the development of proglacial lakes, whereas repeat times of a few days are required for dis-aster management in connection with ice-avalanche or landslide induced temporary lakes.
– The “timing” of data acquisition has to be under control
of the user, or to coincide with the user needs by chance. The probability for the latter increases with temporal resolution. Timing is of particular importance when re-mote sensing data are required at a given repeat cycle (e.g. early warning, seasonal restrictions) or when rapid response is needed (e.g. search and rescue operations, disaster management).
– The “section of the electromagnetic spectrum” available
A. K¨a¨ab et al.: Remote sensing of glacier and permafrost hazards 533 recorded at the sensor and the dependence of the sensor
to weather and illumination conditions (e.g. all-weather and time capability of microwave sensors, night-time capability of thermal infrared (TIR) sensors).
– “Stereo, interferometric or ranging capability” of the
re-mote sensing system enables the computation of terrain elevations, often a crucial prerequisite for the analysis of high-mountain environments in the absence of ap-propriate topographic maps.
– “Usability of data” for the user, with the respect to
e.g. existence and access to data archives, speed of on-demand acquisition, speed of delivery, simplicity of data formats and size, financial resources as well as hard- and software resources, and processing and anal-ysis knowledge of the user.
2.2 Airborne remote sensing
Airborne remote sensing technologies that are applicable for high-mountain hazard assessments include the following techniques (Fig. 2):
– Hard-copy or digital aero-photogrammetry based on
frame imagery or linear array CCD sensors are well established techniques for generation of digital terrain models (DTMs), detection of vertical terrain changes, measurement of terrain displacements, and detailed in-terpretation (Baltsavias et al., 1996; Hauber et al., 2000; K¨a¨ab, 2000, 2002; Kaufmann and Ladst¨adter, 2002; Mi-randa and Granados, 2003).
– Whereas modern digital air cameras have also
multi-spectral capabilities by including a few bands in the visi-ble and near infrared (VNIR), there are also some hyper-spectral sensors available with tens to hundreds of nar-row bands in the VNIR and SWIR (short-wave infrared) spectrum. Airborne hyperspectral remote sensing al-lows for detailed spectral analysis of the ground sur-face (e.g. lithology, vegetation, lake water) (e.g. Keller et al., 1998), but is so far little applied directly for moun-tain hazard assessments due to the high data acquisition costs and the large expertise required for data analysis. As yet the method is subject to scientific research rather than available on an operational level.
– Airborne laserscanning is an upcoming and highly
promising tool for acquiring high-resolution DTMs (Baltsavias et al., 2001; Geist et al., 2003; Janeras et al., 2004). From repeat DTMs it is also possible to derive terrain displacements. Some laserscanning instruments are able to record the signal intensity and, thus, to in-clude spectral terrain characteristics (Lutz et al., 2003).
– Airborne synthetic aperture radar (SAR) is rarely used
in high-mountains, mainly due to topographic restric-tions. The applied microwave spectrum, however, bears
Fig. 2.
SAR Altimeter Optical Optical Space Air SAR LIDAR 100-10 m 1000-10 m 1-0.01 m 100-1 m 1-0.1 m 0.1 m DTM Platform: Data: Sensor: Thickness change Horizontal surface displacements Vertical surface displacements Classification of surface and changes Stereo parallaxes, (photo- clinometry) Repeat DTM Image matching, (change detection) Multispectral segmentation, DTM analysis, change detection Multi-, hyper- spectral analysis, thermal IR change det. Multi-, hyper- spectral analysis, thermal IR, change detect. (Multi-) spectral segmentation, DTM analysis (Backscatter, polarimetry, multifrequency; interfer. coherence) Backscatter, polarimetry, multifrequency, interfer. coherence, change detect. (Backscatter, polarimetry, multi-freq., DTM analysis) Backscatter, polarimetry, multi- frequency, change detect. Image matching, (image algebra, DTM matching) Image matching in multitemp. stereo models DTM matching (DTM matching) Intensity segmen- tation, DTM analysis Intensity (,multi- frequency) Differential InSAR Differential InSAR (Differential InSAR) (Differential InSAR) Repeat DTM Repeat DTM Repeat DTM Repeat DTM Repeat meas. Stereo parallaxes Interfero- metry Interfero- metry Laser-scanning, -profiling -(RADAR, LIDAR, interfero- metry) Surface characteristic and changes GIFOV:
Fig. 2. Overview of remote sensing methods suitable for
high-mountain hazard assessment, in relation to platforms and sensors, and data types to be derived. Abbreviations: DTM: digital terrain model; GIFOV: ground-projected instantaneous field of view (i.e. spatial sensor resolution); IR: infrared; LIDAR: light detection and ranging (laserscanning); SAR: synthetic aperture radar; InSAR: in-terferometric SAR.
a high potential due to its all-weather and day/night ca-pability, and for extracting surface and sub-surface char-acteristics that influence the complex di-electrical con-stant of the ground (e.g. roughness, humidity) (Vachon et al., 1996; Stevens et al., 2003).
Airborne remote sensing campaigns in mountains cover
usually of a few or a few tens of km2by one scene/image.
Data costs range from a few EUR/km2 for reproduction of
existing data to hundreds of EUR/km2for original
acquisi-tions. Beside many advantages of airborne remote sensing such as level of detail and direct customer control, this class of platforms is often not applicable for areas where major to-pographic, political, security or financial restrictions are in-volved. Satellite sensors overcome these restrictions in parts. They are able to cover large areas without ground access needed, data are comparably cheap and well accessible, and for some sensors a repeat cycle of a few days is possible (Gao and Liu, 2001; Huggel, 2004; K¨a¨ab, 2004).
2.3 Spaceborne remote sensing
Spaceborne remote sensing technologies suitable for high-mountain hazard assessments include the following tech-niques (Fig. 2):
– Optical multispectral spaceborne imaging represents a
534 A. K¨a¨ab et al.: Remote sensing of glacier and permafrost hazards
Fig. 3.
Fig. 4.
22/07/2001
27/09/2002
09/04/2004
1 km 1 kmKarmadon
Karmadon
avalanche
avalanche
deposits
deposits
lakes
lakes
ponds
ponds
decay
decay
structures
structures
gorge
gorge
N
rivers
rivers
Fig. 3. Changes in glacier extent in the Monte Rosa east face
(45.9◦N, 7.9◦E) as derived from orthophotos between 1956 (light blue) and 2001 (dark blue). In the recently de-glaciated zones dras-tic mechanical, thermal, hydraulic and hydrological changes affect the frozen and unfrozen rock and debris deposits, and cause in-creased rock fall activity. Background: topographic map, sheet Zer-matt, by Swisstopo, permission BA046472.
mapping and monitoring ground cover and its changes. It is often used for detecting hazard source areas and terrain changes, and for mapping of endangered zones (Buchroithner et al., 1982; K¨a¨ab et al., 2000, 2003c; Huggel et al., 2002, 2004c; Liu et al., 2005; Silverio and Jaquet, 2005).
– Satellite optical stereo, usually combined with
multi-spectral imaging, enables the computation of DTMs, a crucial prerequisite for most high-mountain studies (Toutin, 2001; Gamache, 2004; K¨a¨ab, 2004).
– Interferometric SAR (InSAR) from space can also be
used to derive DTMs. In particular useful for supporting hazard assessments in remote areas is the DTM from the single pass InSAR campaign Shuttle Radar Topography Mission (SRTM). Repeat InSAR can further be applied to measure terrain movement (e.g. differential InSAR, DInSAR) (Gens and van Genderen, 1996; Mantovani et al., 1996; Rignot et al., 1996; Kelley et al., 1997; Moor-man and Vachon, 1998; Toutin and Gray, 2000; Strozzi et al., 2004). In addition, the microwave backscatter (i.e. the intensity of the return-signal recorded at the sen-sor), the interferometric phase coherence, and the signal (de-)polarisation can be analysed (Coltelli et al., 1996) (see Sect. 3).
Spaceborne remote sensing data of medium resolution cover
up to tenthousands of km2by one scene. Data costs are on
the order of few EUR/km2or much less.
Here, we do not cover terrestrial remote sensing meth-ods since the focus of our contribution is on remote areas. However, it should be stressed that, for instance, terrestrial photogrammetry (Brecher and Thompson, 1993; Kaufmann and Ladst¨adter, 2004; Pitk¨anen and Kajutti, 2004), touch-less laser rangers, terrestrial laser scanning (Bauer et al., 2003; Janeras et al., 2004) and terrestrial SAR (Tarchi et al., 2003) can be highly valuable techniques for detailed monitoring tasks.
3 Image classification
The most common application of remotely sensed image data for high-mountain hazard assessment consists in the inter-pretation and classification of the image content. Thereby, both the spectral image information and the spatial context of such information are exploited. The technologically simplest form of image analysis (though by no means the least impor-tant and easiest analysis!) is the manual mapping of features of interest from the imagery available (Fig. 3). In particu-lar under conditions of difficult topography and weak opti-cal contrast, or for highly complex assessment tasks, manual image segmentation might be superior to semiautomatic and automatic techniques. A number of image enhancement and fusion techniques are available to facilitate manual interpre-tation (Lillesand and Kieffer, 2000).
However, for rapid, repeated, and/or large-area quanti-tative applications, automatic image classification is able
to offer valuable support. The large variety of
avail-able techniques ranges from mono-spectral (i.e. grey-value) segmentations, multi- and hyperspectral classifications, to spatio-spectral analyses utilising not only the spectral in-formation of the image pixels but also their spatial context (Schowengerdt, 1997; Lillesand and Kieffer, 2000; K¨a¨ab, 2004).
For instance, glacierized areas (Hall et al., 1989; Aniya et al., 1996; K¨a¨ab et al., 2000, 2003a; Albert, 2002; Paul, 2002; Paul et al., 2002, 2004b; Salzmann et al., 2004) or glacier lakes (Huggel et al., 2002; Wessels et al., 2002) can be mapped automatically. Archived data sets are an invalu-able source for comparison between past and present situa-tions (Fig. 4) (K¨a¨ab and Haeberli, 2001; K¨a¨ab et al., 2003c; Silverio and Jaquet, 2005).
Mountain permafrost, a purely thermal phenomenon, can hardly be remotely sensed in a direct way, but related indi-cators such as rockglaciers, thaw lakes, polygones, etc. can be detectable in remote sensing data (e.g. Lewkowicz and Duguay, 1999; Frauenfelder et al., 2005).
Many glacier- and permafrost-related hazards are con-nected to terrain changes. Thus, multitemporal applications are of particular interest for assessing high-mountain haz-ards. Beside the measurement of elevation changes and ter-rain displacements as discussed in the following sections, a
A. K¨a¨ab et al.: Remote sensing of glacier and permafrost hazards 535
Fig. 3.
Fig. 4.
22/07/2001 27/09/2002 09/04/2004 1 km 1 km Karmadon Karmadon avalanche avalanche deposits deposits lakes lakes ponds ponds decay decay structures structures gorge gorgeN
riversriversFig. 4. ASTER false colour imagery of the Karmadon area from before (left) and after (middle and right) the 20 September 2002
Kolka/Karmadon rock-ice avalanche disaster, North Ossetia, Caucasus (42.8◦N, 44.5◦E). During this event, a rock-ice avalanche of several million m3from the north face of the Kazbek massif sheared off the entire Kolka glacier tongue. This combined avalanche rushed 18 km down the Genaldon valley. Approximately 100 million m3of ice and debris were deposited near the village of Karmadon where the avalanche was stopped by a narrow gorge (K¨a¨ab et al., 2003c; Kotlyakov et al., 2004; Haeberli et al., 2005; Huggel et al., 2005). The rivers in the area (blue arrows) were dammed by the avalanche deposits and formed lakes (dark blue line: lake extent as of 27 September 2002; light blue line: lake extent as of 22 October 2002). On the 9 April 2004 image, the rock-ice dam showed already distinct melt and decay structures.
group of change detection techniques are applied. Related strategies include (Schowengerdt, 1997; K¨a¨ab, 2004):
– “multitemporal data overlay and comparison”, i.e.
in-terpretation of change after individual classifications, where the results from monotemporal image classifi-cations are superimposed (e.g. lakes in Fig. 4, middle panel).
– “animation”, where repeat images or derived
classifi-cations are shown sequentially (so-called ”flickering”) (K¨a¨ab et al., 2003b).
– “multitemporal false colour composites” (FCC), where
the individual channels of a colour image (e.g. red, green, blue) are composed by images of different ac-quisition times. Thereby, radiometric changes between the acquisition times lead to the emphasis or attenuation of individual colour channels in the multitemporal FCC with respect to the unchanged terrain sections. As a re-sult, changes can become visible as ”unnatural” colours (Fig. 5) (Ostir et al., 2003; K¨a¨ab, 2004).
– “image algebra”, (also called band math, or algebraic
expressions), where a change image is computed from two or more multitemporal input images through alge-braic band operations such as band ratios or normalised differences (Schowengerdt, 1997; Huggel et al., 2002; K¨a¨ab, 2004, 2005; Paul and K¨a¨ab, 2004). For instance, for a multitemporal band ratio ((channel X of image at time 1)/(channel X of image at time 2)) changed image sections are indicated by ratio values far off the value 1.
– “multitemporal principle component transformation”.
A principle component transformation (PCT) computes
Fig. 5.
Fig. 6.
1 kmlakes
rock-ice
avalanche
deposits
avalanche track
N
1
10
100
1000
Vertical DTM difference (m)
20%
40%
60%
80% 100%
0
Percentage of DTM points
SRTM3 – ASTER 30 m, Bhutan SRTM3 – ASTER 120 m, Bhutan max. 3200 m max. 1100 m1
10
100
1000
Vertical DTM difference (m)
20%
40%
60%
80% 100%
0
Percentage of DTM points
Ref.-DTM – SRTM3, Chico Ref.-DTM – ASTER, Chico Ref.-DTM – SRTM3, Gruben Ref.-DTM – ASTER, Gruben Fig. 5. Deposits of the Kolka/Karmadon rock-ice avalanche (seeFig. 4). Change detection is done by a multitemporal RGB-composite. Red: ASTER band 3 of 22 July 2001; green and blue: ASTER band 3 of 13 October 2002. The dashed outline marks the avalanche path running from south to north, the deposits in front of the gorge at the upper edge of the image, and the lakes, which were dammed by the avalanche deposits. Red-coloured changes in northern slopes are due to different shadow/illumination conditions between the acquisition dates.
536 A. K¨a¨ab et al.: Remote sensing of glacier and permafrost hazards Fig. 5. Fig. 6. 1 km lakes rock-ice avalanche deposits avalanche track N 1 10 100 1000 Vertical DTM difference (m) 20% 40% 60% 80% 100% 0 Percentage of DTM points SRTM3 – ASTER 30 m, Bhutan SRTM3 – ASTER 120 m, Bhutan max. 3200 m max. 1100 m 1 10 100 1000 Vertical DTM difference (m) 20% 40% 60% 80% 100% 0 Percentage of DTM points Ref.-DTM – SRTM3, Chico Ref.-DTM – ASTER, Chico Ref.-DTM – SRTM3, Gruben Ref.-DTM – ASTER, Gruben
Fig. 6. Cumulative histograms of vertical differences between SRTM3, ASTER and aerophotogrammetric DTMs for a study site in Bhutan (left panel), and Gruben, Swiss Alps, and Glaciar Chico, Chile (right panel). (Bhutan 30 m: 100%=201 000 points; Gruben ASTER: 100%=37 100 points; Gruben SRTM: 100%=4760 points; Chico ASTER: 100%=71 700 points; Chico SRTM: 100%=29 000 points).
a new colour space for a multi-channel image in a way that the individual channels of the new, transformed im-age are sorted according to the spatial imim-age variabil-ity they contain. Thus, the first principle component(s) computed from a multitemporal image data set tend to indicate the largest radiometric changes between the im-ages (Schowengerdt, 1997). Multitemporal PCT can be useful for sets of many repeat data where FCCs or sim-ple image algebra fail, e.g. for long time-series such as from the Landsat instrument series.
– “change vector analysis”, and “change axis analysis”,
where the digital numbers (DNs) of the same or dif-ferent channels of multitemporal image data are plot-ted against each other in scatter plots and compared (Schowengerdt, 1997; K¨a¨ab, 2004). Thereby, certain radiometric changes appear as different change-patterns in the scatter plots, and according change-pixels can be re-identified and marked in the multitemporal images. These techniques are heavily affected by illumination differences between the acquisition dates and thus sel-dom used in mountains.
– “multitemporal classifications”, where repeat data sets
are included in a combined classification scheme and the “change classes” and “non-change classes” (e.g. ice-to-rock, debris-to-vegetated, ice-to-water) are derived automatically or through training areas.
These techniques work both on optical and SAR data. In the microwave spectrum, analysis of the backscatter, the coherence of the SAR interferometric phase, and the sig-nal polarisation is able to support delineation and charac-terisation of the terrain surface and its dynamic (Coltelli et al., 1996; Engeset and Weydahl, 1998; Friedman et al.,
1999; Floricioiu and Rott, 2001). Analysis of the
mi-crowave backscatter is, however, seldom used in the context
of high-mountain hazards due to the complex electromag-netic nature of the ground reflection and topographically-and sensor-induced geometric problems such as layover topographically-and radar shadow (Coltelli et al., 1996). Beside the backscat-ter amplitude, also inbackscat-terferometric coherence or its spatio-temporal changes (Weydahl, 2001) can be exploited. For instance, interferometric coherence points to stable terrain, whereas its loss over time may hint to changes in surface conditions such as from terrain destruction (cf. Fig. 18). Fur-thermore, the signal (de-)polarisation can be analysed (Ste-bler et al., 2002). If a clear polarisation or depolarisation in the backscatter signal from a polarimetric SAR system can be observed for a certain terrain section, certain surface charac-teristics can be inferred (e.g. a blocky surface acting as corner reflectors).
Particularly promising for hazard assessment and disas-ter management is the (multitemporal) fusion of optical and SAR data because it is able to combine the advantages of dif-ferent sections of the electromagnetic spectrum (Ostir et al., 2003). In that way, for instance, SAR data can bridge gaps in optical time series due to cloud cover. Snow humidity con-ditions, that are hardly detectable from optical sensors alone, can be inferred from SAR data in snow mapping (Rott and Strobl, 1992; Rott, 1994; K¨onig et al., 2001).
Accurate co-registration of the repeat data, i.e. identical ground coordinates for identical (stable) terrain points, is a mandatory prerequisite of any change detection procedure.
4 Digital terrain models
4.1 Satellite stereo
DTMs represent the core of any investigation of high-mountain hazards, because many high-high-mountain geomor-phologic processes are driven by the relief energy. Further-more, DTMs are needed for orthorectification of image data, and thus for accurate georeferencing and co-registration with other or repeat data. An efficient spaceborne way to gener-ate such DTMs for nearly any place on the Earth is sgener-atel- satel-lite along-track stereo from sensors such as JERS, ASTER or SPOT-5. For mountain environments with rapidly chang-ing surface conditions such as snow-cover, along-track stereo (acquired within minutes during one overflight) is preferable to cross-track stereo that utilises imagery from neighbour-ing tracks, sometimes with a temporal baseline of weeks or months (Ehlers and Welch, 1987). DTMs can be produced for mountain terrain through digital photogrammetric meth-ods with a vertical accuracy approaching the pixel size of the applied sensor (e.g. 15 m for ASTER; Fig. 6) and with typical horizontal grid spacings equivalent to 2–4 image pix-els in size (Al-Rousan and Petrie, 1998; Bishop et al., 2000; Toutin, 2001; K¨a¨ab, 2002, 2005; Toutin, 2002; Zomer et al., 2002; Hirano et al., 2003; K¨a¨ab et al., 2003a; Berthier et al., 2004; Gamache, 2004; Stevens et al., 2004; Cuartero et al., 2005, Kamp, 2005 #1826; Eckert et al., 2005).
A. K¨a¨ab et al.: Remote sensing of glacier and permafrost hazards 537
Fig. 7.
Fig. 8.
30 m ASTER DTM 60 m ASTER DTM 25 m aerophot. DTM
ASTER band 3N 60 m DTM errors
30 m DTM errors
30 m matching score 60 m matching score
1 km DTM errors Matching score 600 m 0 m 1 (high) 0 (low) N 1 km a b c d e ASTER Aerophotogrammetry Weights for fusion
SRTM ASTER
ASTER-SRTM fusion SRTM
N
Fig. 7. Gruben area, Swiss Alps (46.2◦N, 7.9◦E). First row: 30 m ASTER DTM (left), 60 m ASTER DTM (middle), aerophotogrammetric DTM (right). Contour interval is 100 m. Second row: Grayscale-coded vertical DTM differences between the aerophotogrammetric DTM and the ASTER DTMs of first row (left and middle). Right: ASTER nadir band 3N orthoimage for better location of DTM errors and matching correlation. Third row: score channels of DTM matching correlation. The darker the pixel the worse the correlation. Severe vertical DTM errors and matching problems are more pronounced for the 30 m ASTER DTM, which on the other hand shows more terrain details.
However, large errors in DTMs derived from optical satel-lite stereo can occur due to the following reasons:
– steep flanks facing away from the oblique stereo
sen-sor (e.g. northern slopes are strongly distorted or even hidden in the back-looking stereo channel for the de-scending ASTER),
– particularly rough topography with sharp peaks, that are
too small to be clearly matched in both stereo partners, and/or
– insufficient optical contrast (e.g. snow cover).
In such cases, the stereo parallaxes required for DTM gen-eration can be matched at different image resolutions and/or using different image chip sizes. Coarser image resolutions and larger matching chip sizes tend to produce more robust but less detailed DTMs (Figs. 6 and 7). Potential DTM er-rors can then be detected from analysing the vertical de-viations between the different DTMs, and erroneous zones can be filled by interpolation or using data from the coarser
DTM levels (Zollinger, 2003; K¨a¨ab, 2004, 2005; K¨a¨ab et al., 2004b; Weidmann, 2004). In addition, filters can be con-structed to eliminate errors formed as sharp spikes and holes in DTMs. Such errors can be detected as exceptionally large elevation differences over short distances, and related large gradients and curvatures in the DTM (Zollinger, 2003; Eck-ert et al., 2005).
Often, DTM errors are accompanied by low correlation values from the stereo-parallax matching procedure between the stereo image partners and can thus be identified using a so-called matching score-channel of the DTM (Fig. 7). Where this channel indicates weak correlation between the stereo image partners involved in the computation of an in-dividual elevation value, the according DTM points can be eliminated or filtered (Weidmann, 2004). The procedure can be combined with the above error detection from DTMs gen-erated at different resolutions.
A further simple and efficient method for evaluating DTMs and detecting severe errors is to produce multiple or-thoimages using the same DTM but source images from dif-ferent positions such as the stereo partners from along-track
538 A. K¨a¨ab et al.: Remote sensing of glacier and permafrost hazards
Fig. 7.
Fig. 8.
30 m ASTER DTM 60 m ASTER DTM 25 m aerophot. DTM
ASTER band 3N 60 m DTM errors
30 m DTM errors
30 m matching score 60 m matching score
1 km DTM errors Matching score 600 m 0 m 1 (high) 0 (low) N 1 km a b c d e ASTER Aerophotogrammetry Weights for fusion
SRTM ASTER
ASTER-SRTM fusion SRTM
N
Fig. 8. Fusion between a DTM from ASTER stereo and SRTM. (a)
hillshade of an ASTER DTM of the Gruben area, Swiss Alps, de-rived at 60 m resolution; (b) SRTM DTM with data gaps in white;
(c) fusion between both DTMs; (d) fusion weights for filling the
SRTM gaps with ASTER DTM data (white: SRTM is used, black: ASTER is used; grey: weight of SRTM elevation values with re-spect to ASTER DTM); (e) aerophotogrammetric DTM for com-parison.
stereo. Thereby, vertical DTM errors translate into horizontal distortions, which become different for different incidence angles and can thus be easily visualised by animated overlay or other change detection techniques between the different orthoimages (K¨a¨ab, 2004, 2005).
DTMs from satellite stereo show characteristics such as data gaps, accuracy, etc., that are in parts different from the characteristics of InSAR-derived DTMs. It can, therefore, be of particular interest to merge DTMs from satellite stereo with DTMs from satellite InSAR, namely the SRTM DTM, in order to combine the advantages of both sensor types. Such DTM-fusion helps especially in finding severe verti-cal and horizontal DTM errors, and filling data gaps in either of the DTMs to be fused. DTM-merging techniques range from replacement of data (K¨a¨ab, 2005), weighted fusion re-sulting in smooth transitions between DTMs (Fig. 8) (Wei-dmann, 2004), to merging in support of the DTM process-ing itself (e.g. DTM-approximation in order to geometrically constrain stereo parallax matching or interferometric phase unwrapping) (Honikel, 2002).
Photoclinometry, i.e. the inversion of terrain shading to de-rive terrain geometry (also called ”shade-to-shape” or ”shape from shading”) is hardly useful for mountain hazard studies because a constant reflectivity over the terrain is necessary in order to attribute changes in reflection to terrain slope and as-pect alone (Bindschadler and Vornberger, 2000). Therefore, the technique has been applied to ice sheets.
An important processing step before merging or compar-ing multi-source DTMs is to ensure accurate co-registration of the multiple data sets. If the original sensor model and orientation is inaccessible, cross-correlation and according transformations between the DTMs to be compared, or be-tween products derived thereof (e.g. orthoimages) is
recom-mended (for more details see below section on elevation changes).
4.2 Radar interferometry; Shuttle Radar Topography
Mis-sion
Sensors in the microwave spectrum are able to overcome limitations connected to optical sensors, namely the weather
and sunlight dependency. Interferometric synthetic
aper-ture radar (InSAR) is used to generate DTMs (Renouard et al., 1995; Toutin and Gray, 2000; Crosetto, 2002). DTMs from spaceborne repeat-pass interferometry such as from ENVISAT, ERS-1/2, or Radarsat reach a vertical accuracy in the order of metres and a spatial resolution of tens of me-tres (Renouard et al., 1995; Sties et al., 2000; Crosetto, 2002; Stevens et al., 2003; Strozzi et al., 2003b).
A particularly interesting campaign is the single-pass Shuttle Radar Topography Mission (SRTM) of February 2000, which produced DTMs with about 30 m (1 arc-second, SRTM1) and 90 m (3 arc-seconds, SRTM3) grid size, and with a vertical accuracy of a few meters to decameters (Fig. 6) (Rabus et al., 2003; Rignot et al., 2003; Stevens et al., 2003; K¨a¨ab, 2005). The SRTM covered the continents
between 60◦N and 54◦S. Where available, the SRTM
in-deed represents a revolutionary data set for all kinds of terrain studies, in particular also for high-mountain hazard assess-ments. However, due to radar shadow, foreshortening, lay-over and insufficient interferometric coherence, the SRTM DTM has significant voids in high mountains (Fig. 8). In such cases, we regard the fusion between spaceborne pho-togrammetric DTMs and the SRTM DTM as a promising ap-proach (see previous section on satellite stereo; Fig. 8).
The spatial resolution of airborne SAR DTMs is in the or-der of metres or even less, and their vertical accuracy for mountainous terrain lies in the order of decimetres to metres, both depending on the wavelength applied. Current systems (e.g. AeS-1, GeoSAR, TOPSAR) use X- to P-band SAR (i.e. around 3 to 80 cm wavelength) (Vachon et al., 1996; Stevens et al., 2003; Stebler et al., 2004). Airborne InSAR sensors usually apply single-pass interferometry. However, multiple overflights with different azimuths may be required to over-come limitations from radar shadow or layover.
4.3 Aerial photogrammetry
Airborne photogrammetry applies similar techniques com-pared to the spaceborne optical methods, though with higher accuracy due to the better spatial image resolution generally available. The method is still, in most cases, based on ana-logue (i.e. hard-copy) airphotos (K¨a¨ab, 2000). Digital pho-togrammetry based on digitised hard-copy images or digi-tal imagery enables automatic DTM and orthoimage genera-tion (Chandler, 1999; Hauber et al., 2000; K¨a¨ab and Vollmer, 2000; Zhang and Gr¨un, 2004). Related DTMs have, depend-ing on the image scale and pixel size, a vertical accuracy on the order of centimetres to metres, and a spatial resolution
A. K¨a¨ab et al.: Remote sensing of glacier and permafrost hazards 539 on the order of metres to decametres (Baltsavias et al., 1996;
K¨a¨ab and Vollmer, 2000; Mora et al., 2003).
Aerial photogrammetry is a particularly important tool in view of the existing archives of analogue airphotos, which represent an invaluable source to quantitatively compare tem-poral evolutions (Fox and Nuttall, 1997; K¨a¨ab and Vollmer, 2000; Weber and Herrmann, 2000; Haeberli et al., 2001; K¨a¨ab and Haeberli, 2001; Julio Miranda et al., 2005). Al-though most aerial photographs are taken in an analogue way, digital frame or linear array cameras are increasingly applied (Hauber et al., 2000; Gr¨un and Zhang, 2002; Roer et al., 2005). Due to the large technical knowledge and spe-cial equipment needed to handle airborne digital imaging, it is difficult to use this technique worldwide, so far. How-ever, the possibility from digital imaging to generate DTMs and orthophotos nearly in real-time (literally “on the flight”) has, in theory, an important advantage in disaster manage-ment and response.
4.4 Laserscanning (airborne LIDAR)
DTM accuracy similar to the one of airborne photogram-metry can be obtained from airborne laserscanning (or light detection and ranging, LIDAR) – a promising technique in particular for glacier and permafrost monitoring (Favey et al., 1999; Baltsavias et al., 2001; Geist et al., 2003; Lutz et al., 2003; Janeras et al., 2004). In terms of flight conditions required, laserscanning is comparable to aero-photogrammetry. As an active sensor it provides also good results over snow cover, where photogrammetric methods fail due to the lack of optical contrast. DTMs from laser-scanning have a spatial resolution on the order of meters. The resulting high degree of terrain details represented en-ables new methods of geomorphometric terrain analysis as well as terrain dynamics analysis. If available – what will be rarely the case in remote areas, though – laserscanning is a method, which should be considered whenever accurate DTMs and elevation changes are required for hazard assess-ments and disaster management. Airborne laserscanners are increasingly able to record the signal intensity (Lutz et al., 2003) or are equipped with electro-optical imaging devices, too, enabling combined analyses.
5 Terrain elevation changes (DTM differences)
Terrain elevation changes over time, i.e. vertical differences between repeat DTMs, are indicators for glacial and geomor-phodynamic processes such as glacier fluctuations and mass movements. Thus, their detection can be an important step of high-mountain hazard assessment and disaster mapping (K¨a¨ab, 1996, 2000).
In general, changes in terrain elevation are derived by sub-tracting repeat DTMs. The accuracy of such-derived vertical changes is, in principle, on the order of the accuracy of the repeat DTMs that are used. If the DTMs compared repre-sent independent measurements, the root mean square error
Fig. 9.
Fig. 10.
200 m N 1000 2000 3000 0 500 1500 2500 3500 1800 1900 2000 2100 2200 2300 2400 2500 2600 12 Oct 1995 2 Sep 1999 6 Sep 2001 11 Oct 2001 Elevation (m a.s.l.) Distance (m)Fig. 9. Horizontal residuals from matching the SRTM DTM (white
arrows) and an ASTER DTM (black arrows) onto an aeropho-togrammetric reference DTM. Glaciar Chico, Southern Patagonia Icefield, Chile (49.0◦S, 73.1◦W). Matching grid width used was 1500 m, matching chip size was 750 m. For the flat glacier obvi-ous mismatches occur due to missing relief contrast. No residual vectors are available for the SRTM DTM in the lower right section due to data gaps. For the DTMs shifted according to the residual vectors the vertical deviations from the aerophotogrammetric DTM were reduced by about 10%.
(RMS) of an individual elevation change RMS1zcan be
es-timated from the RMS of the repeat (here: two) DTMs (Et-zelm¨uller, 2000):
(RMS1z)2=(RMSz1)2+(RMSz2)2. (1) Special pre- and post-processing procedures help to reach or improve the latter accuracy:
“Pre-processing, i.e. procedures beforehand the DTM sub-traction”: As for all multitemporal analyses, accurate co-registration of the multiple DTMs is a necessary prerequisite to obtain elevation changes free of global systematic errors. If the repeat DTMs are produced using the same method (e.g. optical stereo), the co-registration of the DTMs (and other products) can be assured by orienting the original data as one common, multitemporal data set. For instance, repeat satellite or aerial imagery should be oriented as one (multi-temporal) image block with common ground control points (GCPs) and all the images connected by (multitemporal) tie points (TPs) (K¨a¨ab and Vollmer, 2000; K¨a¨ab et al., 2004b; K¨a¨ab, 2005).
If the original sensor model and orientation is inaccessible, or the DTMs have different sources, matching between the
540 A. K¨a¨ab et al.: Remote sensing of glacier and permafrost hazards
Fig. 9.
Fig. 10.
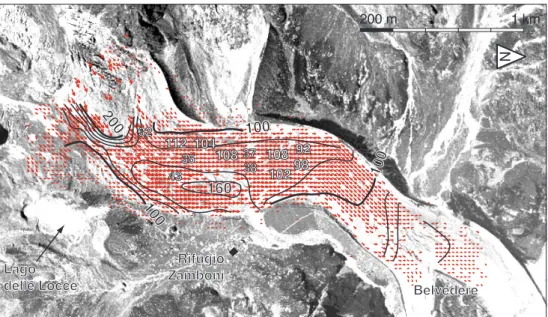
200 m N 1000 2000 3000 0 500 1500 2500 3500 1800 1900 2000 2100 2200 2300 2400 2500 2600 12 Oct 1995 2 Sep 1999 6 Sep 2001 11 Oct 2001 Elevation (m a.s.l.) Distance (m)Fig. 10. Repeated longitudinal surface profiles over Ghiacciaio
del Belvedere (45.9◦N, 7.9◦E). The position of the summer 2002 supraglacial lake is indicated schematically. Since autumn 2000 the glacier experienced a surge-type movement with severe glacial haz-ards associated (Haeberli et al., 2002; K¨a¨ab et al., 2003c, 2004a) (see also Fig. 13).
individual DTMs to be compared is recommended. Through cross-correlation techniques the vertical and horizontal shifts of selected sections of the “slave DTM” with respect to the “master-DTM” can be measured so that the vertical differ-ences between the DTMs to be co-registered become min-imal for the stable terrain sections. From these shift vec-tors (Fig. 9) an optimal horizontal and vertical shift, rotation, scale, etc., between the DTMs to be compared can be com-puted and the “slave DTM” transformed accordingly (Pil-grim, 1996a, b; Li et al., 2001; Weidmann, 2004). The cross-correlation focuses on stable terrain with sufficient relief (i.e. topographic contrast). Alternatively, also products of the DTMs can be matched, for instance orthoimages (Berthier et al., 2004), or DTM derivatives such as slope or curvature maps, or edge-filtered DTMs.
“Post-processing of the elevation differences”: Once the raw differences between repeat DTMs are computed it is of-ten necessary to filter the elevation differences obtained, be-cause the noise in the derived differences is larger than in the original DTMs (see Eq. 1) (Etzelm¨uller, 2000; K¨a¨ab, 2004). The task is to define a noise model adapted to the na-ture of the process under investigation. For instance, thick-ness changes of a debris-free glacier are expected to show a smooth spatial variability so that a coarse filter might be applied. Coarse filters are less suited for mass movements such as landslides with a high spatial variability and with many secondary local terrain movements overlain, because the filter tends to remove important “real” signals. In gen-eral, low-pass filters exist in the spatial domain (e.g. median, medium, Gauss, etc.) or for the spectral domain (e.g. fourier or wavelet) (K¨a¨ab et al., 1997; Gudmundsson and Bauder, 1999; Etzelm¨uller, 2000; K¨a¨ab, 2004).
A well-established method for detecting terrain elevation changes is the subtraction of repeat aero-photogrammetric
Fig. 11.
Fig. 12.
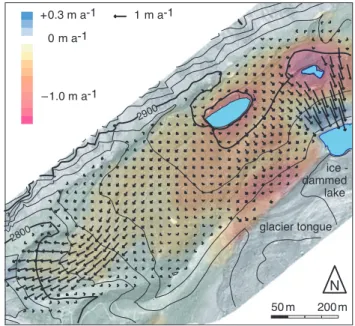
50 m 200 m 1 m a-1 – 1.0 m a-1 + 0.3 m a-1 0 m a-1 2800 2900 glacier tongue ice -lake dammed N 0-30 m 30-60 m 60-90 m 90-120 m 120-150 m 1 kmN
Fig. 11. Gruben rockglacier, Swiss Alps (46.2◦N, 7.9◦E). Overlay of the horizontal surface velocities (vectors) and the colour-coded changes in elevation, both for 1970 to 1995. The multitemporal three-dimensional data merging clearly reveals differences within the rockglacier in terms of dynamics and thermal equilibrium. To the north-east, a patchy distribution of horizontal velocities and high rates of thaw settlement indicate dead ice occurrences that are not in thermal equilibrium. To the south-west, a coherent flow field and almost constant thickness point to creeping permafrost in thermal equilibrium (K¨a¨ab et al., 1997). The lakes on Gruben rockglacier were subject to hazard assessments and mitigation measures (Hae-berli et al., 2001).
DTMs. A large number of applications exists ranging from, for instance, measuring glacier thickness changes (Fig. 10) (Benson and Follet, 1986; Fox and Nuttall, 1997; K¨a¨ab and Funk, 1999; Kaufmann and Pl¨osch, 2000; Jiskoot et al., 2001; Julio Miranda and Delgado Granados, 2003), volumes of deposited materials (Clague and Evans, 2000), permafrost agradation (i.e. development of ice lenses and connected frost heave) or degradation (e.g. melt-out of ground ice and connected thaw settlement) (K¨a¨ab et al., 1997), develop-ment of thermokarst processes or many types of peri- and paraglacial slope instabilities (Fig. 11) (K¨a¨ab, 2000, 2004; K¨a¨ab and Vollmer, 2000). Repeat laserscanning will increas-ingly be applied for similar studies (Geist et al., 2003).
Compared to airborne techniques, elevation changes from repeat satellite stereo can only be measured for a limited number of geomorphodynamic processes due to the reduced accuracy of the according DTMs. Nevertheless, the accu-racy obtained might be sufficient to detect and quantify large changes in terrain geometry, such as from avalanche deposits or glacier mass changes (Fig. 12) (Berthier et al., 2004; K¨a¨ab, 2004).
Sometimes, also differential SAR interferometry (DIn-SAR) can be used to detect vertical terrain changes (e.g.
Bj¨ornsson et al., 2001). However, strictly speaking this
A. K¨a¨ab et al.: Remote sensing of glacier and permafrost hazards 541 rather than elevation changes at fixed positions. The
tech-nique is therefore covered in the following section.
6 Surface displacements
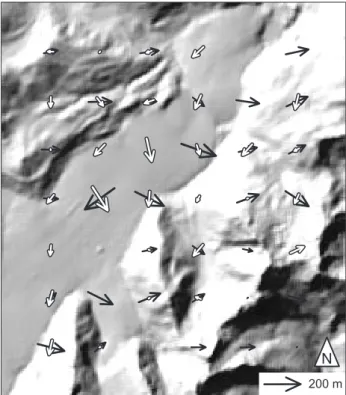
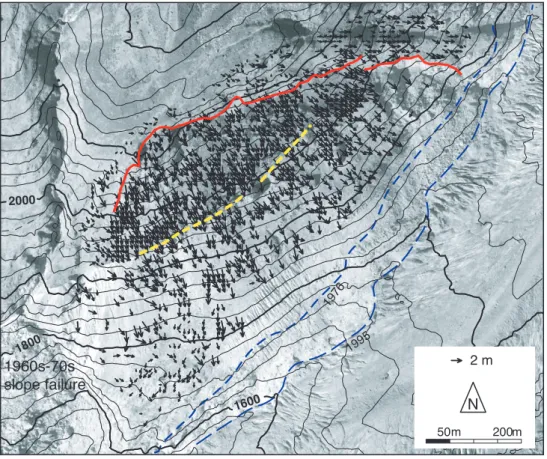
Terrain movements can directly pose a hazard (e.g. land-slides) or provoke follow-up processes, which then develop into hazards (e.g. river damming by a glacier surge). The measurement of terrain displacements from repeat image data can thus support high-mountain hazard assessments (Powers et al., 1996; K¨a¨ab et al., 1997; Knizhnikov et al., 1998; K¨a¨ab and Funk, 1999; Weber and Herrmann, 2000; Jiskoot et al., 2001; K¨a¨ab, 2002; Casson et al., 2003; Dela-court et al., 2004).
If digital image correlation techniques are used, the mea-surements are possible at a horizontal accuracy on the order of the pixel size of the sensor applied (K¨a¨ab, 2002). Sub-pixel accuracy can be reached as well but is often limited by changes in terrain and illumination conditions between the repeat data acquisitions. Image matching techniques can be applied equally to terrestrial photos, air photos, optical satel-lite images, SAR images (Michel and Rignot, 1999; Strozzi et al., 2002) or high-resolution DTMs (e.g. derived from laserscanning, or aerophotogrammetry). Depending on the data and technique employed either the horizontal compo-nent of the surface displacement is measured or the fully three-dimensional surface displacement vector (Kaufmann and Ladst¨adter, 2002; K¨a¨ab, 2004).
The rate of terrain movement, which can be detected at a statistically significant level of accuracy, depends among others on the image pixel size, the temporal baseline, and the terrain preservation between the repeated data acquisi-tions. From air and high-resolution satellite images slope instabilities such as rock mass movements, or permafrost creep can be detected (i.e. movement rates in the order of cm to m per year; Figs. 11, 14 and 15) (K¨a¨ab, 2002; Dela-court et al., 2004). Comparably fast movements, in particular glacier flow (i.e. rates of tens to hundreds of metres per year), can be sometimes quantified from airphotos (Fig. 13), but also from medium-resolution satellite imagery (e.g. Land-sat ETM+, ASTER) (Figs. 16 and 17) (K¨a¨ab, 2002, 2005; Dowdeswell and Benham, 2003; Skvarca et al., 2003; K¨a¨ab et al., 2004b; Berthier et al., 2005).
Differential InSAR (DInSAR) enables measuring slow ter-rain movement with an accuracy of a few millimetres. Ap-plicability of the method depends on terrain topography and SAR imaging geometry, leading to areas of missing infor-mation in layover and shadow, and on preservation of in-terferometric coherence (Ferretti et al., 2001; Nagler et al., 2002; Eldhuset et al., 2003; Strozzi et al., 2004). Coherence is usually lost when, among others, the terrain is destruc-ted or the surface humidity changes significantly (Weydahl, 2001). In high mountains the presence of snow and its tem-poral changes have significant influence on the electromag-netic response in the microwave spectrum. Related interfero-metric de-correlation effects can be avoided by short
tempo-Fig. 11.
Fig. 12.
50 m 200 m 1 m a-1 – 1.0 m a-1 + 0.3 m a-1 0 m a-1 2800 2900 glacier tongue ice -lake dammed N 0-30 m 30-60 m 60-90 m 90-120 m 120-150 m 1 kmN
Fig. 12. Thickness of the 20 September 2002 avalanche deposits
at Karmadon computed from ASTER DTMs of 22 July 2001 and 6 October 2002. The strong elevation changes to the upper right corner are due to errors in the ASTER DTMs in steep slopes (see also Figs. 4 and 5).
ral baselines, when the observed terrain movements are fast enough to be detectable over such short periods (see Fig. 18). DInSAR directly provides the line-of-sight displacement, i.e. the projection of the actual terrain displacement vector on the line between terrain point and sensor. Except for high latitudes, where ascending and descending satellite-track az-imuths are significantly different, the line-of-sight displace-ment cannot be well decomposed into horizontal components (Joughin et al., 1999). The horizontal and vertical displace-ment components can be separated by combining the line-of-sight displacements measured from ascending and descend-ing orbits, at least in theory. In mountain areas such pro-cedure is often hindered by the fact that slopes which are well visible from the ascending orbit lie in shadow or lay-over in the descending orbit, and vice versa. The vertical and horizontal components have rather to be estimated or mod-elled from the type of terrain movement under investigation (Wang and Li, 1999; Strozzi et al., 2001). Typical DInSAR applications in high-mountains are the detection of rock mass movements, glacier flow and permafrost creep (Figs. 18 and 19) (Fruneau et al., 1996; Rignot et al., 1996; Mattar et al., 1998; Joughin et al., 1999; Rott et al., 1999; Ferretti et al., 2001; Kenyi and Kaufmann, 2001; Nagler et al., 2002; Eld-huset et al., 2003; Forster et al., 2003; Squarzoni et al., 2003; Strozzi et al., 2004).
For glacier hazard assessments, DInSAR and optical im-age matching methods for deriving terrain movement are highly complementary in terms of accuracy and applicabil-ity. As a very general rule, DInSAR has the potential to work where image matching fails, and vice versa (K¨a¨ab, 2004).