HAL Id: insu-02945123
https://hal-insu.archives-ouvertes.fr/insu-02945123
Submitted on 22 Sep 2020
HAL is a multi-disciplinary open access archive for the deposit and dissemination of sci-entific research documents, whether they are pub-lished or not. The documents may come from teaching and research institutions in France or abroad, or from public or private research centers.
L’archive ouverte pluridisciplinaire HAL, est destinée au dépôt et à la diffusion de documents scientifiques de niveau recherche, publiés ou non, émanant des établissements d’enseignement et de recherche français ou étrangers, des laboratoires publics ou privés.
mineral equilibrium in pantelleritic magmas
Pierangelo Romano, Bruno Scaillet, John C. White, Joan Andújar, Ida Di
Carlo, Silvio Rotolo
To cite this version:
Pierangelo Romano, Bruno Scaillet, John C. White, Joan Andújar, Ida Di Carlo, et al.. Experimental and thermodynamic constraints on mineral equilibrium in pantelleritic magmas. Lithos, Elsevier, 2020, 376-377, pp.105793. �10.1016/j.lithos.2020.105793�. �insu-02945123�
Experimental and thermodynamic constraints on mineral equilibrium in pantelleritic magmas
Pierangelo Romano, Bruno Scaillet, John C. White, Joan Andújar, Ida Di Carlo, Silvio G. Rotolo
PII: S0024-4937(20)30430-8
DOI: https://doi.org/10.1016/j.lithos.2020.105793
Reference: LITHOS 105793 To appear in: LITHOS
Received date: 11 April 2020 Revised date: 27 August 2020 Accepted date: 17 September 2020
Please cite this article as: P. Romano, B. Scaillet, J.C. White, et al., Experimental and thermodynamic constraints on mineral equilibrium in pantelleritic magmas, LITHOS (2020),https://doi.org/10.1016/j.lithos.2020.105793
This is a PDF file of an article that has undergone enhancements after acceptance, such as the addition of a cover page and metadata, and formatting for readability, but it is not yet the definitive version of record. This version will undergo additional copyediting, typesetting and review before it is published in its final form, but we are providing this version to give early visibility of the article. Please note that, during the production process, errors may be discovered which could affect the content, and all legal disclaimers that apply to the journal pertain.
Experimental and thermodynamic constraints on mineral equilibrium in
pantelleritic magmas
Pierangelo Romano1,*[email protected], Bruno Scaillet2, John C. White3, Joan Andújar2, Ida Di Carlo2, Silvio G. Rotolo1,4
1
Dipartimento di Scienze della Terra e del Mare (DiSTeM), Università degli Studi di Palermo, Via Archirafi 22, 90123 Palermo, Italy
2
Institut des Sciences de la Terre d'Orléans (ISTO) UMR 7327, Université d'Orléans – CNRS – BRGM, Campus Géosciences, 1A rue de la Férollerie, 45071 ORLEANS Cedex 2, France
3
Department of Geoscience, Eastern Kentucky University, Richmond, KY 40475, USA
4
Istituto Nazionale di Geofisca e Vulcanologia, sezione di Palermo, Via Ugo la Malfa 153, 90146 Palermo, Italy
*
Correspondig author: Pierangelo Romano, Ph.D, Dipartimento di Scienze della Terra e del Mare (DiSTeM), Università degli Studi di Palermo, Via Archirafi 22, 90123 Palermo, Italy.
1. Introduction
Peralkaline trachyte and rhyolite (peralkalinity index calculated as P.I.=[mol Na+K/Al] ≥ 1.0) frequently represent the felsic end-member in bimodal magmatic suites that characterize both oceanic and continental intra-plate and extensional tectonic settings. The origin of these magmas has been an extensively debated petrological issue, with two principal models: (i) protracted crystal fractionation from mafic (alkali gabbro) parental magma (Civetta et al., 1998; White et al., 2009; Neave et al., 2012; Romano et al., 2018), or (ii) partial melting of mafic (gabbroic) cumulates followed by low pressure crystal fractionation (e.g., Bohrson and Reid 1997; Avanzinelli et al., 2004; Macdonald et al., 2008, 2011; Marshall et al., 2009). Whatever their origin, the stability of mineral phases crystallising in peralkaline trachyte and peralkaline rhyolite (named as either
comenditic if ([Al2O3-4.4]/FeO* > 1.33 or pantelleritic if [Al2O3-4.4]/FeO* < 1.33, FeO*= total Fe
as FeO; Macdonald, 1974) has been also matter of considerable discussion in the petrological community. Carmichael (1962) published the first modern detailed study of the common mineral phases occurring in pantellerite (i.e., anorthoclase, sodian clinopyroxene and amphibole, fayalitic olivine, aenigmatite) and since then there have been many studies focused on the control of temperature, pressure, oxidation and melt peralkalinity on mineral equilibrium and on how these fractionating phases, in particular feldspar and clinopyroxene, affect the transition from metaluminous (P.I. < 1.0) to peralkaline silicic magmas (e.g., Carmichael and MacKenzie, 1963; Bailey and Schairer, 1966; Nichols and Carmichael, 1969; Lindsley, 1971; Marsh, 1975; Conrad, 1984; Scaillet and Macdonald, 2001, 2003, 2006; White et al., 2005; Macdonald et al., 2011; Romano et al., 2018).
On the island of Pantelleria, the type locality for pantelleritic rocks, metaluminous trachyte and pantellerite comprise about 90% of the outcrop, occurring as ignimbrites, pumice fall deposits, or vitric lava flows and domes (Mahood and Hildreth, 1986; Jordan et al, 2018). Recent petrological modelling and experimental studies have highlighted the low temperatures (T≤ 750°C) and reducing conditions (viz., oxygen fugacities an order of magnitude or more lower than the Nickel-Nickel Oxide [NNO] buffer, or log fO2 < NNO-1) that characterize the pre-eruptive conditions in
the pantelleritic magma chambers at Pantelleria (White et al., 2005, 2009; Di Carlo et al., 2010; Liszewska et al., 2018), and other peralkaline systems (Scaillet and Macdonald, 2001, 2003, 2006; Ren et al., 2006; White et al., 2005; Macdonald et al., 2011, 2019; Macdonald, 2012; Jeffery et al., 2017). Although considerable progress has been made, previous experimental studies have not been able to fully clarify the relationship between melt composition, intensive parameters, and the observed phenocrysts, particularly the role of fO2 on mineral assemblages that indicate peralkalinity.
Recent studies carried out on other (non-peralkaline) felsic systems have shown that small variations in bulk composition may profoundly affect phase relationships (and compositions), most
notably the stability fields of non-tectosilicate phases (which are minor phases in evolved silicate magmas) which are generally critical for the determination of pre-eruptive conditions (e.g., Scaillet et al., 2008; Andujar and Scaillet, 2012; Cadoux et al., 2014).
In this study we present the results of phase equilibrium experiments performed on two samples of pantellerites differing slightly in composition and mineral assemblages. Phase relationships were established at 1 kbar, for temperatures ranging between 680°C - 900°C and redox conditions around the fayalite-magnetite-quartz (FMQ) buffer (equivalent to NNO0.68 to -0.60). The experimental results are compared with the results of previous experiments carried out on similar material (Di Carlo et al., 2010). We also compare our data with thermobarometric results based on established mineral-mineral equilibria gathered from Pantelleria and other peralkaline localities (Pantelleria: White et al., 2005, 2009; Liszewska et al., 2018; Eburru, Kenya: Ren et al., 2006; and Menengai, Kenya: Macdonald et al., 2011). We focus our attention on how mineral assemblages are affected by (i) small variations of starting compositions, and (ii) temperature and redox conditions. Our findings shed new light on mineral-liquid and mineral-mineral equilibria governing the occurrence of aenigmatite, olivine, ilmenite and sodian amphibole phases in pantellerites.
2. Geological and petrological background
The island of Pantelleria is located in the Sicily Channel (Italy), within the transtensional rift system on the northern promontory of the African Plate (Figure 1). The eruptive history of Pantelleria can be subdivided into three major periods which include the formation of at least two calderas and the eruption of nine ignimbrites, each of which was followed by largely quiescent periods with occasional, volumetrically minor explosive and effusive eruptions (Jordan et al., 2018). The first period (324-190 ka) is characterized by alternating eruptions of lava flows and pumice fall deposits (Mahood and Hildreth 1986; Jordan et al., 2018). The second period (187-45 ka) begins with the formation of the La Vecchia Caldera and includes eight eruptions of trachytic to
pantellerite ignimbrite (Mahood and Hildreth 1986; Rotolo et al., 2013). The third period began 45.7 ± 1.0 ka (Scaillet et al., 2013) with the eruption of the compositionally zoned Green Tuff (pantellerite to trachyte, Williams et al., 2014), the caldera-forming ignimbrite of the Cinque Denti Caldera. This was followed by a prolonged period of effusive activity (to ~8 ka) that formed the trachytic Montagna Grande-Monte Gibele shield volcano and several other pantellerite shields and lava domes (Mahood and Hildreth, 1986; Scaillet et al., 2011). During this same period basaltic lava flows erupted in the northwestern sector of the island (Civetta et al., 1988; Rotolo et al., 2007).
Although erupted over a long period of time and therefore clearly not belonging to the same liquid lines of descent, peralkaline trachytes and pantellerites at Pantelleria have consistent compositional and mineralogical trends. White et al. (2005) described five subgroups of pantellerites, each characterized by different: (i) mineral assemblages, (ii) melt peralkalinity, and (iii) range of temperature and fO2. Alkali feldspar (anorthoclase) and clinopyroxene are present in
each assemblage, which differ from each other by the occurrence of oxides, fayalitic olivine, sodian amphibole, quartz and aenigmatite minerals. Mineral assemblages with Fe-Ti oxides and fayalite are found in rocks with the lowest P.I. (1.3-1.5) while mineral assemblages with aenigmatite ± ilmenite are associated with P.I. > 1.6. The low temperatures of equilibration (680-720°C) together with the reduced character (i.e., slightly below the FMQ buffer) of pantellerites have also been experimentally constrained by Di Carlo et al. (2010) as common features of these magmas (Scaillet et al., 2016). Melt inclusion studies have shown that despite their reduced nature, pantellerites are also characterized by high melt water contents (H2Omelt up to 4.5 wt%), along with high Cl (up 1
wt%; Lowenstern, 1994), and CO2 usually lower than 150 ppm or barely detectable by micro
infra-red spectroscopy (Gioncada and Landi, 2010; Neave et al., 2012; Lanzo et al., 2013). Regarding the storage pressure, field evidence suggests that peralkaline silicic magmas are stored at pressures < 2 kbar (Mahood, 1984), which has been supported at Pantelleria by thermodynamic (White et al., 2009), experimental (Di Carlo et al., 2010), and melt inclusion (Gioncada and Landi, 2010) studies. A low pressure of magma storage is also suggested by a phase equilibrium study of Pantelleria
trachyte (Romano et al., 2018), which also demonstrated that peralkaline silicic derivatives can be produced by low pressure fractionation of a metaluminous trachyte. The extensive fractionation from a common transitional basaltic magma parent that the production of pantellerite liquids requires is in line with the low temperature, CO2-poor, and water-rich character documented for
those rhyolites at Pantelleria and elsewhere. The fact that pantelleritic melt inclusions generally lack detectable CO2 by FTIR (e.g., Gioncada and Landi, 2010; Lanzo et al., 2013), does suggest that
most of the CO2 has been lost by the time pantelleritic magmas are produced in the plumbing
system.
3. Experimental methods
3.1 Starting materials
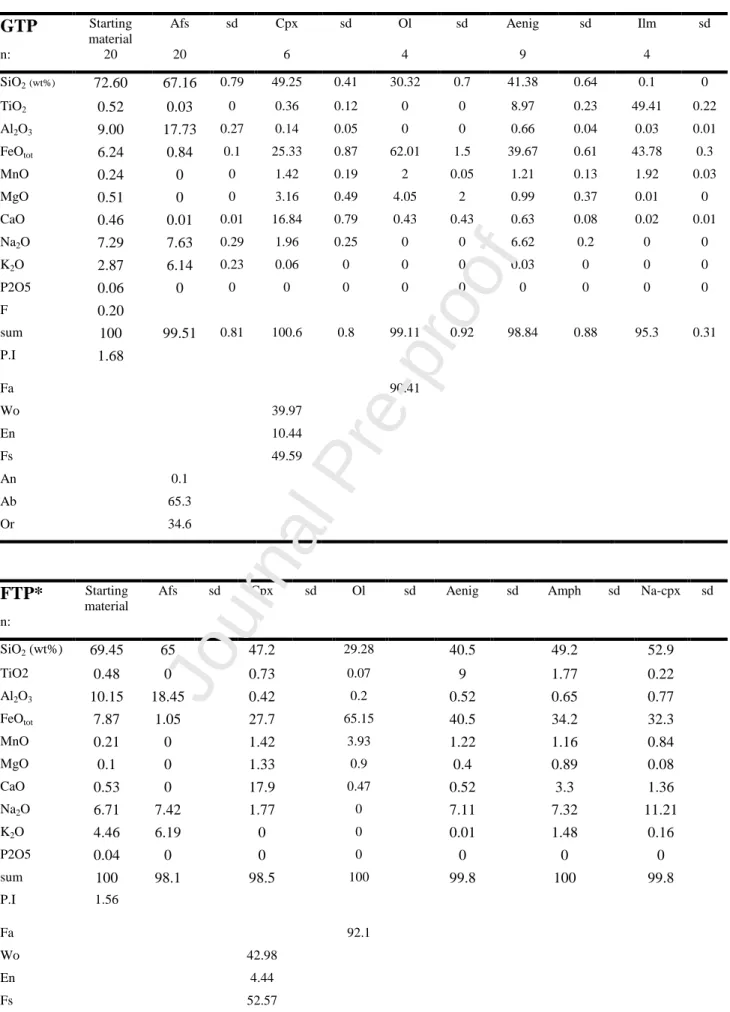
We selected two pantellerite samples with similar compositions (Table 1) but slightly different crystal content (about 10% volume), one representing the basal pumice fall of the Green Tuff eruption (GTP; P.I = 1.68) and one representing a younger pumice deposit („Fastuca‟ eruption, FTP; P.I.=1.56), which was also used in the experiments of Di Carlo et al. (2010).
3.1.1 The Green Tuff pantelleritic pumice (GTP)
The Green Tuff basal fallout consists of a 70-80 cm thick layer of poorly sorted pumice with scarce lithics. The pumice has a crystal content of ≤ 10 vol% (vesicle free) and its mineral assemblage is dominated (in order of decreasing abundance) by alkali feldspar, with minor aenigmatite and clinopyroxene, with fayalite, and quartz found occasionally embedded in a glassy groundmass. Ilmenite can be found as a uncommon inclusion in aenigmatite phenocrysts, a texture reminiscent of the antipathetic relationship proposed between FeTi-oxides and aenigmatite (Carmichael, 1962). Euhedral to subhedral alkali feldspars are homogeneous in composition
(An<0.1Ab65-64Or35-36) with a maximum length of 1 mm. Clinopyroxene microphenocrysts (length <
0.5mm) classify as sodian augite (Wo40En10Fs50, with Na ≈ 0.16 apfu) while aenigmatite
microphenocrysts have nearly homogenous compositions with XTi [Ti/(Ti+Fetot)] = 0.15-0.17.
3.1.2 Fastuca pantelleritic pumice (FTP)
The Fastuca unit is comprised of dense and variably welded near-vent pumice fall deposits, sometimes agglutinated to form lava-like layers (Rotolo et al., 2007; Di Carlo et al., 2010). The pumice has a crystal content close to 20 vol% (vesicle free) and has a mineral assemblage similar to that of GTP, dominated by alkali feldspar, aenigmatite and clinopyroxene, with fayalite, amphibole and quartz occurring in minor amounts. The groundmass is characterized by a few alkali feldspar microphenocrysts and alkali feldspar + aegirine microlites (<100 microns) embedded in a glassy matrix. Alkali feldspars (up to 3 mm length) have composition An<0.1Ab65-64Or35-36. Sodian (Na ≈
0.14 apfu) augite microphenocrysts (length ≤ 0.5mm) have a composition of Wo42En04-Fs54 and
microphenocrysts of aegirine are also present. Aenigmatite phenocrysts (up to 2 mm in length) and microphenocrysts also have nearly homogenous compositions with XTi = 0.15-0.17. Olivine has a composition of Fa91-96, and amphibole classifies as ferrorichterite-arfvedsonite group following
Leake et al. (1997).
3.2 Experimental methods and charges preparation
We performed ten crystallization experiments, the experimental conditions being selected on the basis of previous works carried out on peralkaline rocks of Pantelleria (White et al., 2005, 2009; Di Carlo et al., 2010; Romano et al., 2018). All experiments were performed at 1 kbar, between 680°C and 900°C, and redox conditions between NNO-0.5 and -2.5.
Due to the low crystal content, GTP was finely crushed to a grain size 10-30 µm and the powder obtained was used directly as starting material, using the same procedure of Scaillet and Macdonald (2001; 2003; 2006) for Kenyan rhyolites. For FTP the starting material was prepared using a standard procedure for phase equilibrium studies (e.g., Di Carlo et al., 2006, 2010; Andujar
et al., 2015, Romano et al., 2018), which consists of fusing twice the rock powder in air at 1200°C for 3 hours, then grinding the glass obtained to a 10-40 µm powder mesh size. This technique produces a crystal-free homogeneous glass with a composition similar to the starting bulk rock material (Table 1), favouring the attainment of bulk equilibrium.
Experimental charges were prepared by loading sequentially distilled water, CO2 (added as
silver oxalate) and 30 mg of starting material into gold capsules (1.5 cm long, inner and outer diameters of 2.5 mm and 2.9 mm, respectively). The amount of fluid (demineralized water and CO2) was maintained at 10 wt% of the starting material (3 0.5 mg) while the mole fraction of
water in the fluid [XH2Oin = H2O/(H2O+CO2)] was varied between 0.1 and 1; each run consisted of
4-5 capsules (charges) with different XH2Oin. Once loaded, the capsules were weighted, welded and
left for 10-20 minutes in an oven at 100°C, in order to homogenize the fluid within the capsules, and reweighed to check for leaks. After the experiment, capsules were reweighted and those with pre-post weight difference higher than 0.4 mg were excluded. About half of the experimental product recovered upon capsule opening was mounted in epoxy, polished and carbon-coated for subsequent SEM and electron microprobe analyses.
3.3 Experimental apparatus
Experiments were performed in internally heated pressure vessels at the Institut des Sciences de la Terre d‟Orléans, France (CNRS/UO/BRGM-ISTO), working vertically and equipped with a Kanthal furnace. The pressurizing medium, a mixture of argon (Ar) and hydrogen (H2), was loaded
sequentially at room temperature using an Ar/H2 ratio that allowed to reach the desired redox
conditions into the vessel (Scaillet et al., 1992, 1995). Different Ar/H2 ratios were used during the
experiments so as to reach redox conditions either around the FMQ buffer (similarly to those explored by Di Carlo et al., 2010) or below it. During the experiments the pressure was continuously recorded by a transducer calibrated against the Heise-Bourdon tube gauge ( 20 bar) while the temperature was continuously controlled through two S-type thermocouples ( 5°C)
bracketing the sample holder. Run duration varied between 146 and 552 hours and each experiment was terminated by switching off the power supply while keeping constant pressure (isobaric quench), except for experiments above 800°C for which a drop-quench device was used (Roux and Lefevre, 1992).
3.4 fH2, fO2 and H2Omelt in the experimental charges
The experimental redox conditions prevailing during the experiment were determined a
posteriori through solid sensors loaded along with the other capsules. This method allows the
determination of fO2 to 0.01 log fO2 (Taylor et al., 1992; Pownceby and O‟Neill, 1994). This in
turns allows the fH2 inside the vessel to be determined through the dissociation reaction of water:
Kw = f°H2O / (fH2 x fO21/2)
where Kw is the water dissociation constant from Robie and Hemingway (1995), f°H2O the fugacity
of pure water at the P and T of interest (Burnham et al., 1969) and fO2 is given by the sensor. Since
redox conditions lower than FMQ cannot recorded by Co-Pd solid sensors (Taylor et al., 1992), for below-FMQ runs we used the empirical relation of Di Carlo et al. (2010) to calculate fH2 during the
experiments. This relation, established from numerous experiments performed using H2 membranes
at ISTO (Scaillet et al., 1992), states that the final H2 pressure reached at P-T is 3 ± 1 times higher
than the H2 pressure loaded to the vessel at room temperature. It is worth noting that this empirical
relationships is verified by experiments performed with solid sensors (Table 2). The fO2 specific to
each capsule was then computed using either f°H2O for H2O-saturated charges or fH2O = f°H2O x
XH2Oin (moles) for those with CO2. The average error of computed fO2 is ± 0.2 log units. Redox
conditions range from NNO-0.5 to NNO-2.5 for the GTP and from NNO-1.3 to NNO-2.5 for the FTP.
The determination of the water content in glass (H2Omelt) was difficult in most
crystal-bearing runs (using either the „by difference’ method or FT-IR spectroscopy). Thus, H2Omelt in CO2
bearing charges was computed as follows: we first annealed 4 water-saturated glasses (fH2O =
fH2O°) at various pressures (up to 2 kbar) with FTP. Resulting glasses had dissolved water contents
up to 5.2 wt%, as determined by Karl Fisher Titration. From these, we derived an empirical relationship between f°H2O (following Burnham et al., 1969) and H2Omelt in the form f°H2O =
a(H2Omelt wt%)b, with a = 67.72 and b = 1.84 determined by regression. This equation can be
rewritten as H2Omelt (wt%)= (fH2O°/67.72) 1/1.84. In CO2-bearing charges, f°H2O was replaced by
fH2O as before [fH2O = f°H2O x XH2Oin (moles)]. This procedure requires an assumption of ideal
behaviour in the H2O-CO2 fluid phase and the H2Omelt values obtained must be considered as
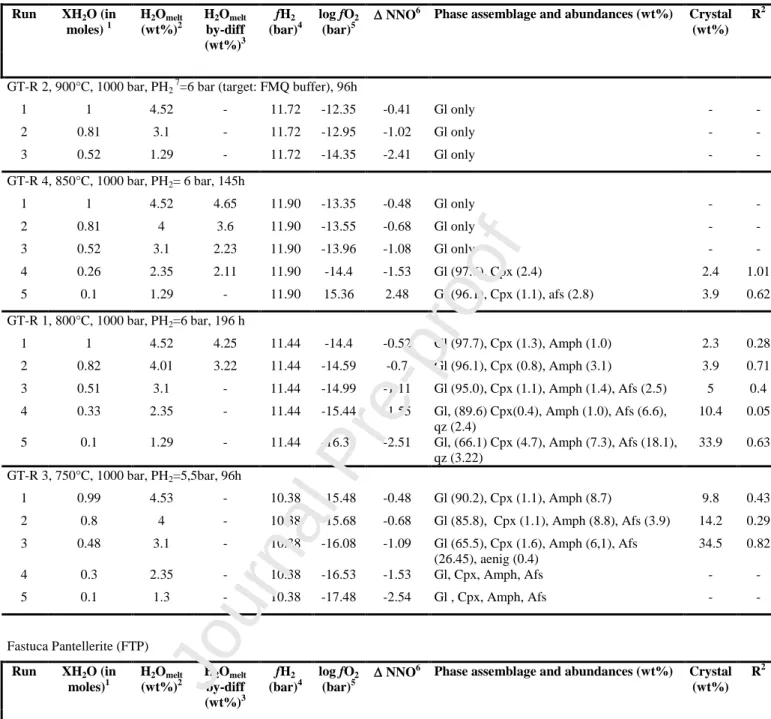
maxima (Di Carlo et al., 2010; Andujar et al., 2015, Romano et al., 2018). In some crystal-free charges (i.e. GTR1-GTR4 and GTR22) the water content was also measured using the „by
difference’ method (Devine et al., 1995) and the results obtained (Table 2) are consistent with
calculations. The standards used for the “by-difference” method were the four pantelleritic hydrous glasses used above. The accuracy of by-difference method for H2Omelt is estimated to be 0.5 wt%
(Devine et al 1995).
3.5 Analytical techniques
Experimental products were first characterised with the scanning electron microscope for preliminary phase identification. Quantitative analyses of mineral phases and glasses were then obtained by microprobe (Cameca SX-Five housed at ISTO-BRGM joint facilities in Orleans). The analytical conditions used were: acceleration voltage of 15 kV, sample current 6 nA and a 10 s peak counting time for each element. A focused beam was used for analysing mineral phases whereas the experimental glasses were analysed employing a defocused beam 10 µm or 5 µm, the latter only when the high crystal content prevented the use of a 10 µm beam size. Na and K were analysed first and a ρφ(z) correction was applied. There was negligible Na loss from the glasses analysed using a defocused beam.
4. Experimental results
4.1 General observations
A summary of the results of our experiments is presented in Table 2. Crystallization experiments performed in our study produce results with similar textural features observed in other experiments done with similar compositions (e.g., Scaillet and Macdonald, 2006; Di Carlo et al., 2010). Achievement of near-equilibrium conditions is suggested by (i) the homogeneous distribution of phases within the charges, (ii) the euhedral shape of crystals, (iii) the regular variations of crystal abundances and compositions as a function of T, H2Omelt and fO2, and (iv)
homogeneous glass compositions. Crystallization experiments reproduced all mineral phases observed in natural pantellerite: clinopyroxene (Cpx), olivine (Ol), alkali feldspar (Afs), ilmenite (Ilm), aenigmatite (Aenig), quartz (Qz) and amphibole (Amph), in addition to glass and vesicles, the latter indicating fluid-saturation conditions during the experiments. The compositions of minerals and glasses were used to determine phase proportions (Table 2) via mass-balance (Albarède, 1995), yielding square residuals (R2) generally ≤ 1. This suggests that (i) no major phases were overlooked and (ii) Na2O contents of experimental glasses have been evaluated
correctly.
4.2 Phase proportions
Phase proportions of both compositions obtained from mass-balance calculations are listed in Table 2; mass-balance calculation is missing for three charges (GTR3-4 GTR3-5 and GTR23-4) due to difficulties in analysing the residual glass. The amount of melt varies from 100 wt% to 36 wt% and is directly correlated with temperature and melt water content decrease (Figure 2a). Supra-liquidus conditions were attained at 900°C for the GTP and 800°C for the FTP while the most crystallised charges are those at T ≤ 750°C (Figure 2a). At decreasing temperature and H2Omelt,
alkali feldspar becomes the most abundant mineral phase reaching a mass proportion of 43 wt% in
Journal Pre-proof
the most crystallised charges (Figure 2b). The sum of iron-bearing mineral phases (clinopyroxene, olivine, aenigmatite, oxides and amphibole) never exceeds 11 wt% (Figure 2c) while quartz proportion ranges between 3 wt% and 9 wt%. It is worth noting that in FTP, amphibole crystallises at < 700°C but its proportion does not approach the 21 wt% obtained by Di Carlo et al., (2010) in their lowest temperature experiments (680°C). In contrast, the proportions of alkali feldspar and clinopyroxene are comparable to those obtained by Di Carlo et al., (2010) and Scaillet and Macdonald (2003, 2006), and similar to those reported from the natural samples.
4.3 Phase relationships
The experimental phase relationships of both starting compositions were established at 1 kbar pressure (P), with temperature (T) between 900 and 750°C for the GTP and between 800 and 680°C for the FTP.
4.3.1 Green Tuff pantellerite (GTP)
At 1 kbar and 900°C GTP charges are at supra-liquidus conditions regardless for melt water contents explored in this study. At 850°C clinopyroxene is the liquidus phase for H2Omelt < 2.5 wt%
(Figure 3a), followed by alkali feldspar at H2Omelt ~1 wt%. At T ≤ 800°C clinopyroxene is the
liquidus phase at water saturated conditions while alkali feldspar expands its stability field at 750°C becoming stable when H2Omelt is ~ 4 wt%. At T = 800°C and H2Omelt ≤ 2.5 wt%, quartz joins the
phase assemblage, whereas aenigmatite becomes stable at 750°C and H2Omelt ≤ 3 wt%. Amphibole
is stable in all charges at T < 850°C regardless of the melt water content (Figure 3a).
4.3.2 Fastuca pantellerite (FTP)
At 800°C all charges are at supra-liquidus conditions for H2Omelt >2 wt%. At 750°C,
clinopyroxene and fayalite (Figure 3b) are the liquidus phases at H2Omelt saturation conditions (~4.5
wt% H2Omelt), joined by alkali feldspar at 4 wt% H2Omelt and aenigmatite at 3 wt% H2Omelt and
quartz at 2.5 wt % H2Omelt.At 680°C feldspar is stable under water saturated conditions, along with
amphibole, aenigmatite and clinopyroxene while quartz crystallises between 3 and 4 wt% H2Omelt.
Fayalite is not stable at 680°C. Magnetite has been observed only at 750°C and H2Omelt close to the
saturation. Ilmenite occurs at 750°C and water-rich conditions, being replaced by aenigmatite at low H2Omelt. Similarly to fayalite, ilmenite is not present at 680°C.
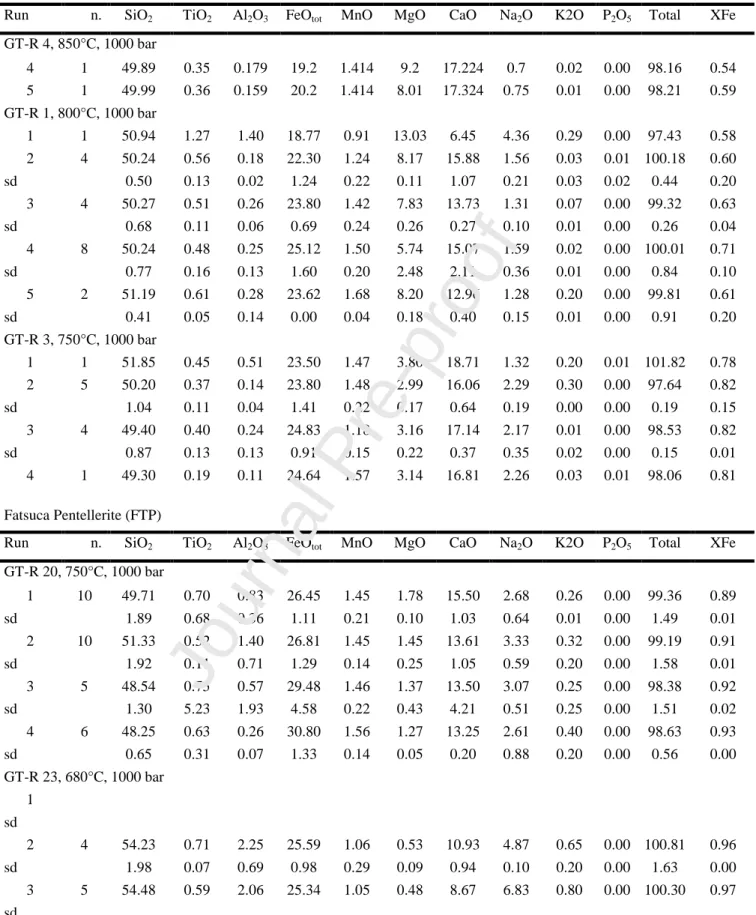
4.4 Phase compositions
Experimental phase compositions are reported in Tables 3-10, whereas the compositional variations with P-T-fO2 and H2Omelt are shown in Figures 4 to 9 and discussed below.
4.4.1 Clinopyroxene
Experimental clinopyroxene have compositions in the range En2.24-25.2 – Fs34.3-68.81 – Wo33.4
-38.5 and XFetot [apfu Fe/(Fe+Mg)] between 0.54 and 0.97. Ca and Na contents vary from augite to
aegirine-augite (Figure 4a, Table 3): pure aegirine end-member does not crystallise in our experiments even though it has been synthetized in similar compositions (Scaillet and Macdonald 2003; 2006; Di Carlo et al., 2010) at temperatures lower than 750°C. At a given temperature, changes in H2Omelt, and thus fO2, influence the XFetot in clinopyroxene (Figure 4b-c). In the GTP
charges, at constant H2Omelt a decrease in temperature of 50°C increases XFe from 0.60 to 0.80. In
FTP, clinopyroxene crystallizes only at < 800°C and has XFetot in the range 0.89-0.97, the Fe-richer
crystals being produced at 680°C. The Na2O content in clinopyroxene ranges between 0.70 wt%
and 2.3 wt% in GTP, and up to around 7 wt% in FTP, broadly increasing with increasing P.I. (Figure 4d). It worth noting that clinopyroxene compositions synthetized at 750°C reproduce the small compositional range displayed by natural clinopyroxenes. The average clinopyroxene-liquid exchange coefficient (KdMg-Fe cpx-liq) calculated using FeO = FeOtot is 0.18 0.03, which overlaps
with the values found by and Di Carlo et al., (2010) (Kd Fe-Mg cpx-liq=0.16 0.14).
4.4.2 Olivine
Experimental olivine, synthesized only in the experiments performed on FTP, is fayalitic ranging from Fa90 to Fa93 (Table 4, Figure 5). The compositional range of experimental olivine
perfectly matches that of corresponding phenocrysts in pantelleritic rocks (White et al., 2005; Civetta et al., 1998), having MnO contents up to 6.4 wt% (for a tephroite component as high as 6 mol%). Iron content increases with decreasing H2Omelt and fO2, while the Mn content roughly shows
the opposite behaviour. The average exchange coefficient Kd Fe-Mg ol-liq, calculated with FeO =
FeOtot, is 0.58 0.2. Considering instead the Fe2+/Fe3+ of the melt, estimated with the method of
Kress and Carmichael (1991) at the experimental T-fO2, the KdFe-Mg is 0.72 0.2. In both cases the
large standard deviation is associated with low MgO concentration (Table 4) in the melt. The Kd
calculated using olivine phenocrysts and the glassy groundmass is KdFe –Mg= 0.40 0.1 (this work
and data from Neave et al., 2012), which is at the lower end of that determined experimentally. The difference between the canonical Kd Ol-Liquid value of 0.30 (e.g., Roeder and Emslie, 1970; Toplis, 2005) and our calculated figures possibly comes in part from the insufficient calibration of Kress and Carmichael method for calculating the Fe2+/Fe3+ ratios of peralkaline silicic liquids at low fO2
(Gaillard et al., 2001).
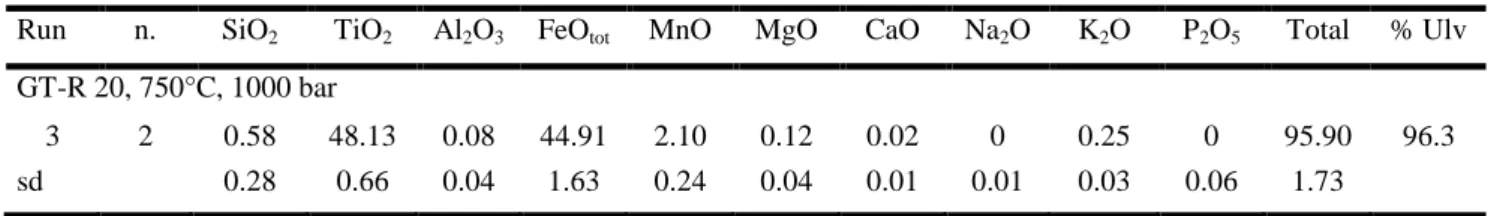
4.4.3 Fe-Ti oxides
Due to the small size, Fe-Ti oxides were analysed only in FTP experiments, in particular in the run GT-R20-3 (Table 5), in other experiments the analyses were strongly contaminated by the glass. Ilmenite in charge GT-R20-3 has an average FeOtot = 44.9 1.6 wt% and TiO2 = 48.1 0.7
broadly similar to the ilmenite composition of natural pantellerites.
4.4.4 Aenigmatite
Experimental aenigmatite (Table 6) has a fairly constant composition, matching that of corresponding phenocrysts in the natural samples. TiO2 contents range between 7.3 wt% and 9.1
wt% while Na2O contents vary between 6.8 wt% and 7.1 wt%, the latter showing no correlation
with P.I. However, as observed by Mahood and Stimac (1990) for Pantelleria pantellerites, Ca and Al contents in aenigmatite decrease as P.I. increases. XTi=[Ti/(Fe+Ti)] ranges between 0.14 and 0.17 showing a positive correlation with temperature (Figure 6) and a negative correlation with fO2.
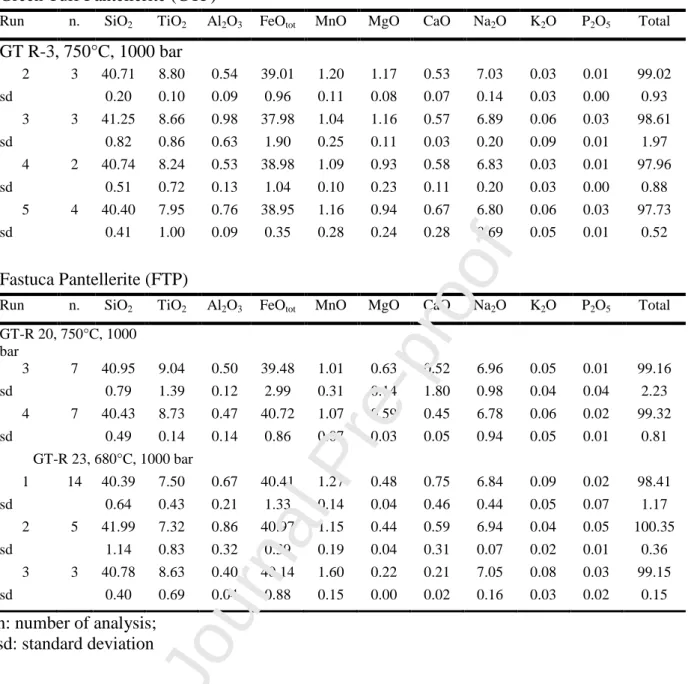
4.4.5 Amphibole
Following the classification of Leake et al. (1997), experimental amphibole (Table 7) is richterite – ferri-winchite, with a few charges also classifying as arfvedsonite. The amphibole crystallising at 800°C in the GTP is winchite whereas at 750°C it ranges between ferri-winchite and ferrorichterite. At fixed temperature a decrease of H2Omelt increases the XFe and Na2O
content (Figure 7a-b) while CaO shows the opposite behaviour (Figure 7c). In contrast, no correlation exists between Al and K and experimental variables (i.e., temperature and H2Omelt). It is
worth noting that the composition of the amphibole found in the Cuddia Mida products by White et al., (2009) closely matches the composition of the experimental amphibole at 750°C (Figure 7c). In FTP charges, amphibole crystallises only at 680°C (cf. Di Carlo et al., 2010) and its composition corresponds to ferrorichterite-arfvedsonite. Compared with the composition of amphibole crystallising at higher temperature, it represents the most enriched end-member in terms of Fe and Na, matching also the amphibole composition of Fastuca pumices (Rotolo et al., 2007; Di Carlo et al., 2010). Amphiboles crystallizing from GTP display higher F contents than those in FTP, Cl contents being barely detectable in both cases.
4.4.6 Alkali feldspar
Analyses of experimental alkali feldspars are listed in Table 8 and range between Or28.7-41.7
-Ab52.8-70.6-An0.0-0.4. The orthoclase content of alkali feldspar shows a broad positive correlation with
H2Omelt and a negative correlation with temperature, in contrast to Ab and An, which broadly show
the inverse trend (note that the large errors associated with An content are due to the very low CaO concentration). The variation in Or content with temperature is appreciable only at ≤ 750°C whereas
at higher temperatures a nearly horizontal trend in the range Or28.7-41.7-Ab52.8-70.6-An0.0-0.4 is obtained
(Figure 8). Overall, the lack of a clear correlation reflects the difficulties to analyse alkali feldspar in charges with low H2Omelt, i.e. the charges with the highest crystal content. The composition of
natural alkali feldspar in pantellerite is well reproduced at 750°C and H2Omelt in the range 2.5-4
wt%.
4.4.7 Experimental glasses
The compositions of experimental glasses recalculated water-free are listed in Table 9. Following the classification of Macdonald (1974) all glasses are pantelleritic in composition, with 1.5 < P.I. < 2.5. The SiO2 content ranges between 71 wt% and 75 wt%, whereas TiO2, MnO, and
CaO have concentrations always lower than 1 wt%, MgO concentration being lower than 0.1 wt%. FeO and Al2O3 contents range between 4.9 wt% - 9.3 wt% and 6.4 wt% - 9.9 wt%, respectively
while Na2O and K2O vary between 6.1 wt% - 7.8 wt%, and 2.7 wt% - 4.9 wt%, respectively. The
variation in glass composition with crystallization is shown in Figure 9. Glass composition in above-liquidus charges is similar to the composition of starting materials, whereas, as crystallization proceeds, FeO and Al2O3 vary notably, being inversely correlated to each other, SiO2
remaining roughly constant. In detail, in the GTP charges SiO2 and FeO show first a slight decrease
then both increase again when the crystal content is > 10 wt%, while Al2O3 content shows the
opposite behaviour (Figure 9a-c). As a result, the P.I. first becomes slightly lower than that of the starting material and then increases up to 2.1, being positively correlated with crystal content. Di Carlo et al. (2010) explained this behaviour (initial decline of P.I.) as due to the crystallization of mafic phases only, such as clinopyroxene (i.e., charges at T ≥ 800°C and high H2Omelt). In FTP, the
SiO2 content remains quite constant even though at 680°C SiO2 is slightly higher than that at 750°C
(Figure 9a). The FeO content increases with crystal content, reaching higher values at 750°C (6.3 wt% - 9.2 wt%) than at 680°C (5.4 wt% - 8 wt%, Figure 9b). With regards the Al2O3 content, it
shows the opposite behaviour; consequently, the melt peralkalinity increases, the P.I. reaching a
Journal Pre-proof
value as high as 2.5 in the most crystallised charge analysed (#GT-R23-3). These melt evolutions are shown in Figure 9d, using a ternary diagram FeO-Al2O3-(Na2O+K2O) (moles), which depicts
the liquid lines of descent for fayalite-bearing charges (750°C) and for those bearing amphibole+aenigmatite (680°C). In both cases, the liquids trend away from the peraluminous-peralkaline divide line as a result of extensive alkali feldspar fractionation (see also Scaillet and Macdonald, 2003).
5. Discussion
5.1 Comparison with previous experimental works
Previous experimental studies on peralkaline rhyolite include those of Scaillet and Macdonald (2001, 2003, 2006) on Kenyan comendites (Olkaria) and pantellerites (Eburru), and those of Di Carlo et al. (2010) on Pantellerian pantellerites, which used one of the same starting pantelleritic materials (FTP) used in this study. The main differences between the Kenyan comendites and the pantellerites, as described by Di Carlo et al. (2010) and confirmed in this study concern: (i) the crystallization sequence and (ii) the stability of the mineral phases. Kenyan pantellerites and comendites are more SiO2-rich than pantellerites of Pantelleria and first crystallise
quartz and alkali feldspar, whereas clinopyroxene is the liquidus phase in Pantellerian pantellerites, in part because the starting material is richer in CaO. Macdonald et al. (2011) suggested a possible role for Cl and F as well, based on the effect of F on the Quartz-Orthoclase-Albite system (e.g., Manning et al., 1981) which expands the stability field of quartz over that of albite. Thus, Kenyan peralkaline rhyolites, characterized by a high F/Cl ratio, reach quartz-feldspar cotectic earlier than other peralkaline rhyolite systems (e.g., Pantelleria, Mayor Island, Azores), where Cl exceeds F and quartz appears rarely, only as microphenocryst. Clinopyroxene crystallises over the whole range of peralkaline silicic magma compositions and shows a wide compositional range, from Na-hedenbergite to aegerine-augite and aegerine, although the latter is never found as phenocrysts but only as microlites in groundmass (Macdonald et al., 2011). Scaillet and Macdonald (2006) and Di
Carlo et al. (2010) both synthetized aegirine at temperatures lower than 700°C while in our experiments aegirine never formed. Scaillet and Macdonald (2001) described the replacement of amphibole by aegirine at high fO2; we infer therefore, that redox conditions in our experiments at
680°C are probably too reducing to allow aegirine to crystallise at this temperature, aegirine likely being only stable below 680°C. The slightly lower redox conditions (as compared to Di Carlo et al., 2010) explored in our study allowed the reproduction of Ca-rich clinopyroxene with XFe values perfectly matching those of the Fastuca sample when temperature is 750°C and H2Omelt in the range
3 wt% - 4.5 wt%. The compositional differences observed in clinopyroxenes of the Green Tuff and Fastuca pantellerites (Table 2, Figure 4) can thus be reproduced at the same temperature (750°C) but at slightly different redox conditions.
Although aenigmatite occurs as phenocrysts in Eburru pantellerites it was not found in the experiments of Scaillet and Macdonald (2006); however, in the experiments of Di Carlo et al. (2010) as in our experiments, aenigmatite is found to be stable at ≤ 750°C for H2Omelt
poor-conditions and at 680°C under water-saturation poor-conditions. The difference between the experimental results and Eburru pantellerites remains still unclear since the melt peralkalinity index, temperature and redox conditions are comparable. One possibility is a difference in pressure, which may have been slightly too low for the Kenyan experiments (1.5 kb): the results of Di Carlo et al. (2010) shows indeed that aenigmatite stability field shrinks at low pressure, this mineral being almost absent at 0.5 kb. In detail, note also that our FTP starting material is slightly Na2O-richer
than the one used by Di Carlo et al. (2010), by about 1 wt%, which could explain the larger stability field of aegnimatite in our FTP experiments, as anticipated from theoretical considerations on equilibria governing aenigmatite stability in peralkaline rhyolites (see section 5.3.2 below).
Fayalite (Fa92-94) was synthesized at temperatures between 693-729 °C and fO2 between NNO-1.8 and NNO-3.2 in Kenyan comendite (Scaillet and Macdonald 2003) while in Pantelleria trachyte the stability range of Fe-rich olivine (Fa60 to Fa88), was established in the temperature
interval 750°C - 950°C over a similar redox range (NNO-1.6 to NNO-2.7; Romano et al., 2018). We note that this is the first time that the stability field of fayalite (Fa90-93) has been experimentally
established for pantellerite magmas. Our experimental results on Fastuca Pantellerite suggest that the crystallization of fayalite in peralkaline silicic magmas depends on a subtle combination of temperature, fO2 and melt peralkalinity: for FTP it is restricted to temperatures between
690°C-750°C, provided that the peralkalinity of melt and fO2 allows it. The lack of olivine in GTP
experiments is interpreted to reflect that fO2 was more oxidizing as compared to the natural system.
Such a restricted or highly sensitive stability field for fayalitic olivine is in contrast to what is observed in peralkaline phonolites, where it occurs over a wider range of temperatures (Giehl et al., 2013), and metaluminous rhyolites (Almeev et al., 2012). From a broader perspective, the intermediate position of fayalitic olivine in the crystallisation interval (i.e. at intermediate temperatures) of FTP is coherent with the observation that iron-rich olivine is present midway in assemblages crystallising along the general liquid line of descent between trachytes and peralkaline rhyolites, as further detailed below in section 5.2.
Factors controlling the stability of amphibole in pantellerites appears more difficult to determine because of the scarce occurrence and wide compositional range of this mineral. Nicholls and Carmichael (1969) and Conrad (1984) evidenced the role played by high fF2 in favouring
amphibole stability (F-ferrorichterites to arfvedsonite). The experimental works of Scaillet and Macdonald (2001, 2006) and Di Carlo et al. (2010) reported sodian amphibole being stable at T≤ 750°C and pointed out that high fF2 enhances its stability even in H2O-poor magmas. Amphibole in
GTP displays F contents around 2 wt%, while in FTP amphibole has F contents lower than 1 wt% (Table 7), which supports such an effect. Another factor that could explain the higher thermal stability of amphibole in GTP is its higher Na2O content relative to that of FTP and Kenyan
pantellerites. As for aenigmatite, our slightly richer Na FTP composition displays a slightly larger (toward H2O-rich conditions) stability field of amphibole as compared to that defined by Di Carlo et
al. (2010), which does suggest that Na stabilises amphibole in peralkaline rhyolites. Elevated Na2O
contents have been shown also to promote amphibole stability in calc-alkaline magmas (Sisson and Grove, 1993). Similarly, recent phase equilibria in metaluminous granites have shown that elevated Na2O/K2O ratios favour calcic amphibole crystallisation (Huang et al., 2019) and we suggest that
this effect may apply to Na amphibole in peralkaline rhyolites as well.
Overall, our experimental results on GTP and those on FTP of Di Carlo et al. (2010) were both performed under a similar range of temperature and redox conditions, but the results of each have significant differences (as already noted for amphibole), in particular for minor phases. For instance, in the GTP experiments, clinopyroxene crystallises at 800°C and H2Omelt close to the
saturation conditions (H2Omelt 4.5 wt%) while in the experiments of Di Carlo et al. (2010),
clinopyroxene appears stable at the same temperature and pressure conditions but at H2Omelt <4
wt %. This comparison shows that although the bulk-rock composition appears similar, the phase stabilities of minor phases are not, being extremely composition – specific and sensitive to even small variation in major elements or intensive parameters as already shown for phonolites or dacites (Scaillet et al., 2008, 2016; Andujar and Scaillet, 2012; Cadoux et al., 2014).
5.2 Comparison with results from natural samples and experiments
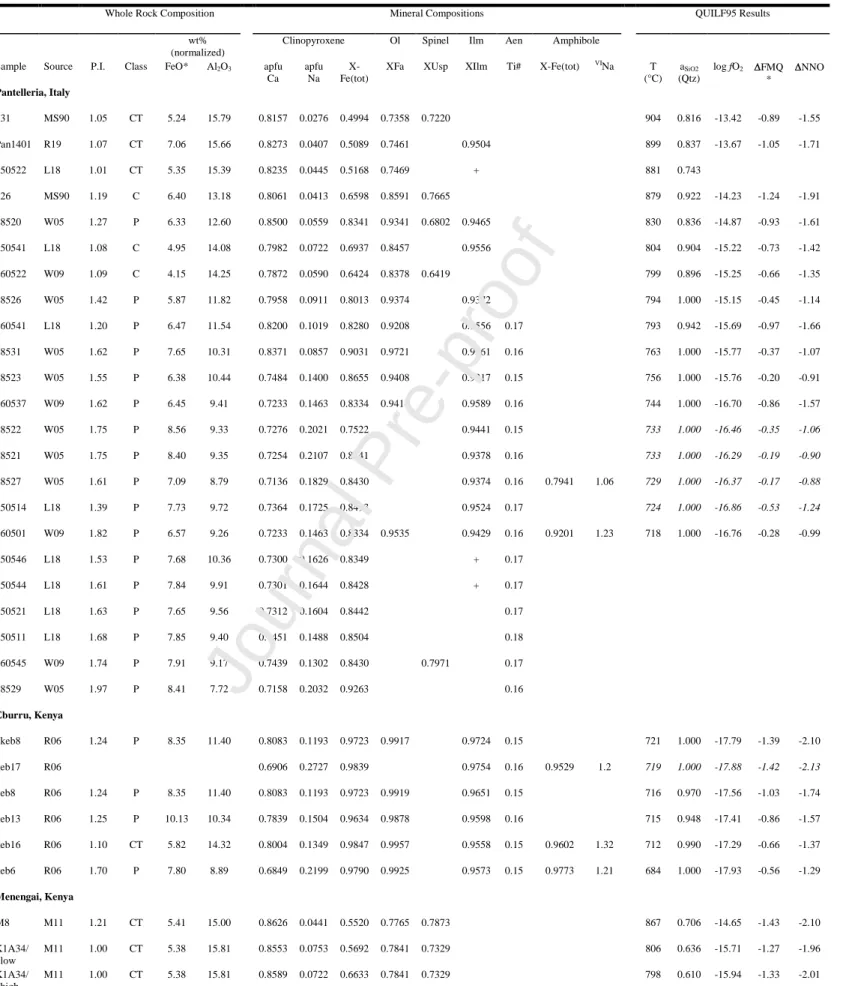
In addition to experimental studies, there have been several studies of the thermodynamic constraints on phase assemblages in natural pantellerites. These previous studies on natural pantellerites have established the efficacy of the Ca-QUIlF (quartz-ulvöspinel-ilmenite-fayalite; Frost et al., 1988; Andersen et al., 1993) system to provide information on temperature, oxygen fugacity, and silica activity from equilibrium assemblages of clinopyroxene-olivine-oxide that compares favourably with both other thermobarometric methods (e.g., two oxides, clinopyroxene-glass; White et al., 2005; Liszewska et al., 2018) and experimental results (Scaillet and Macdonald, 2003, 2006; Di Carlo et al., 2010; Romano et al., 2018). Geothermobarometric results presented by previous studies have been recalculated for P = 1000 bars for consistency and comparison with
experimental work, and to add silica activity where none was reported previously. These results are summarized in Table 10 and the full results of the QUILF95 program are presented in Supplementary Table 1. Amongst both recent and earlier studies (e.g., Carmichael, 1962, 1966; Nicholls and Carmichael, 1969) particular attention has been paid to the stability of aenigmatite and amphibole, their apparent antipathetic relationship with fayalite, and the nature of the so-called “no oxide field” in strongly peralkaline rocks. In general, these recent studies have established a “reaction series” for the liquid line of descent from trachyte (P.I. ≈ 1.0) to pantellerite (P.I. ≈ 2.0): (i) augite (apfu [atoms per formula unit] Ca+Na < 0.90) + olivine + ilmenite + magnetite; (ii) sodian augite (apfu Ca+Na < 0.90, apfu Na > 0.10) + fayalitic olivine + one oxide; (iii) sodian hedenbergite (apfu Ca+Na > 0.90, apfu Na > 0.10, XFetot [Fetot/(Fetot+Mg)] > 0.50) + fayalite + one
oxide + aenigmatite; (iv) sodian hedenbergite + one oxide (typically ilmenite) + aenigmatite + quartz ± amphibole; and (v) aegirine-augite (apfu Na > 0.20, XFetot > 0.50) + aenigmatite + quartz
± amphibole, with the final assemblage representing crystallization in the “no-oxide” field. Alkali feldspar is common to each assemblage described above. Reactions describing these relationships are presented in Table 11. Additionally, with decreasing temperature the natural assemblages also record gradually increasing silica activity and more oxidizing conditions relative to the NNO buffer (from NNO-2 to NNO-0.9), which may be related to increasing water concentrations in the more evolved pantellerites at Pantelleria (cf., Liszewska et al., 2018; Romano et al., 2019). In contrast, mineral assemblages in the Kenyan pantellerites record silica activities and oxygen fugacities that remain nearly constant (aSiO2[Qz] ≈ 0.7 and NNO-2 at Menengai and aSiO2[Qz] ≈ 0.9-1.0 and NNO-2.0 to -1.5 at Eburru; Ren et al., 2006; Macdonald et al., 2011). The experimental results on FTP at 1 kbar and fO2 < FMQ (Fig. 3b) result in a very similar crystallization sequence. Starting
from a liquidus temperature of 800°C, a decrease in temperature to ~750°C results in the crystallisation of clinopyroxene, alkali feldspar, olivine, magnetite, and ilmenite. As temperatures continue to decrease, magnetite ceases to crystallise, which is followed by the appearance of aenigmatite, and then a loss of olivine and ilmenite. Quartz crystallizes early under lower-water
(<3.5 wt%) conditions and not at all at higher-water conditions, whereas amphibole crystallizes at ~700°C over a wide range of water concentrations. For a narrow range of temperature, redox conditions (NNO-1.92), H2Omelt and aSiO2 the experiments reproduced mineral phases and
assemblages very similar to the mineral assemblages (i), (ii) (iii) described above. Fayalite and ilmenite at more reducing conditions disappear (NNO < - 1.92), realistically, as the result of the antipathetic relations with aenigmatite and projecting the peralkaline magma toward the crystallization in the “no-oxide field”. The transition in the mineral assemblage described is driven by a progressive increase of the melt peralkalinity and aSiO2. This latter is confirmed by the quartz
as stable phase. Mineral assemblages (iv) and (v) present quartz amphibole, following the phase diagram in Fig. 3b this one can be realized when peralkaline magma at crystallization temperature lower than 680°C. Crystallization at T≤680° would also explain the presence of aegerine, never synthetized in our experiments but stable in the experiment of Scaillet and Macdonald (2006) and Di Carlo et al. (2010) at temperature lower than 680°C. Scaillet and Macdonald (2001) evidenced a replacement of Na-amphibole by aegirine at increasing fO2 evidenced while Marks et al. (2003)
proposed an antipathetic reaction between aegirine and arfvedsonite, these consideration may explain the more oxidising conditions determined for mineral assemblage (v). In the following paragraphs will be reported the theoretical calculation obtained on pantellerite magmas.
5.2.1. Clinopyroxene and olivine
Along with alkali feldspar, clinopyroxene is a nearly ubiquitous phase in phyric pantelleritic rocks, changing in composition with increasing peralkalinity from augite to sodian augite/hedenbergite to aegirine-augite in samples from Pantelleria (White et al., 2005, 2009). In contrast, the clinopyroxenes reported from Eburru are nearly all sodian (apfu Na ≥ 0.12) hedenbergite to aegirine-augite and those reported from Menengai are low Na (<0.08 apfu) augite and hedenbergite. Di Carlo et al. (2010) described a strong negative correlation between XFetot in
clinopyroxene, temperature, and oxygen fugacity from their experimental results; a similar regression can be derived from the natural data from Pantelleria, Menengai and Eburru:
XFetot = 1.972-0.00135∙T(°C)-0.0403∙log fO2 (n = 27, R2 = 0.77, SE = 0.08) (Eqtn 1)
The composition of olivine ranges from ~72 mol% Fa in trachytes (P.I. ≈ 0.95) to ~99 mol% in pantellerites, although its presence is not as nearly common as clinopyroxene. At Pantelleria, it is present in all samples with P.I. < 1.62 and T ≥ 736°C with a single reported occurrence in a sample from Cuddia Mida (95 mol% Fa) with P.I. = 1.82 and T = 718°C. Olivine is present in all but one of the samples reported from Eburru and Menengai. At Eburru, it is nearly pure fayalite (98.8-99.6 mol% Fa) and occurs with ilmenite and aenigmatite at low (684-721°C) temperatures; at Menengai it ranges from 77.7-83.2 (with a single outlier at 96.8) mol% Fa where it forms an aenigmatite-free assemblage with spinel at higher (793-867°C) temperatures. Both the experiments and the natural samples are in good agreement on the limited temperature range for the stability of fayalite in pantellerites.
The composition of olivine has small negative associations with both temperature and oxygen fugacity (R2 ≈ 0.65), but a strong positive correlation with the iron content of equilibrium clinopyroxene (XFetot):
Fa (mol%) = 47.21 + 54.68∙XFetot (n = 22, R2 = 0.96, SE = 1.9), (Eqtn 2)
which we propose may be used as a test for equilibrium between clinopyroxene and olivine pairs in pantelleritic rocks.
Furthermore, Romano et al. (2018) proposed an equation to parameterize the influence of T, H2Omelt and fO2 on olivine composition in trachytic magma compositions. Here, considering the
continuous compositional trend with Fe-rich olivine in trachyte, we present a modified equation that takes into account the new experimental data:
Fa (mol%)= -0.1720*T(°C)-6.6176*NNO-0.3715*H2Om+212.1635 (R=0.93) (Eqtn 3)
Equation (3) back-calculates the Fa content of experimental olivine to within 1.7 mol % and is valid for trachytic to pantelleritic magma compositions. For instance, if we take into account the average water content in fayalite melt inclusions (Gioncada and Landi, 2010) and redox conditions reported by White et al. (2005) for composition Fa85-97 the equation back-calculates temperatures in the
range 715-783 °C.
5.2.2. Iron-Titanium Oxides
The paucity of oxide pairs and the preponderance of ilmenite over magnetite in mineral assemblages in pantelleritic rocks has been long recognized (Carmichael, 1962). Although magnetite is less common in samples from Pantellerite and Eburru, it is the dominant oxide at Menengai. In general, magnetite occurs as the sole oxide phase in pantellerites that equilibrated with olivine (>70 mol% Fa) and low-Na clinopyroxene (<0.08 apfu Na, XFetot = 0.45-0.84) over a
wide range of silica activities relative to quartz saturation (aSiO2[Qtz] = 0.6 – 0.9) at relatively high
temperatures (904-793°C), with ulvöspinel (Usp) compositions ranging from 64 to 79 mol%. By contrast, with the exception of a single outlier (sample 150551) ilmenite is the sole oxide phase in equilibrium with more fayalitic olivine (>85 mol% Fa) and more sodian clinopyroxene (0.07-0.22 apfu Na, XFetot = 0.69-0.99) over a much narrower range of aSiO2[Qtz] (>0.9) and wider range of
temperature (899-684°C), with only minor variation in composition (93-97 mol% Ilm). Both oxides occur over a similar range of oxidation state, although magnetite appears limited to oxygen fugacities below NNO-1.3. The experiments of Di Carlo et al., (2010) synthetized magnetite in an oxygen fugacity range of NNO-0.53 and NNO-1.06. In this study ilmenite (ilm mol% = 95.4) is stable at 750°C for redox conditions NNO-1.52 and NNO-1.92. The compositions of each have negative associations with NNO (Figure 10) and can be approximated by:
Ilm (mol%) = 91.35 – 2.703∙NNO (n = 20, R2 = 0.85, SE = 0.57), (Eqn 4) and
Journal Pre-proof
Usp (mol%) = 48.06 – 13.73∙NNO (n = 11, R2 = 0.75, SE = 2.5). (Eqn 5)
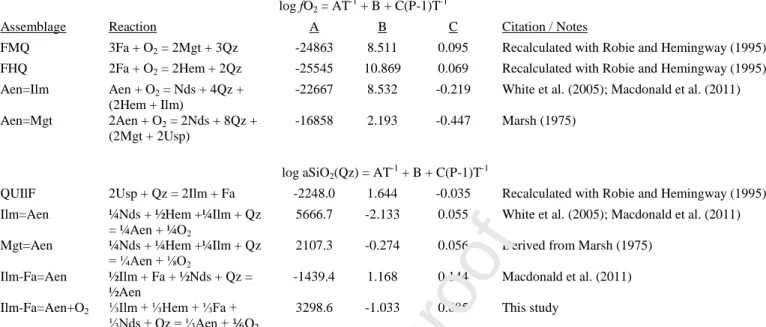
Due to their occurrence over a similar range of temperature and oxygen fugacity, we propose that silica activity exerts the greatest control on whether ilmenite or magnetite will crystallise, as described by QUIlF (Frost et al., 1988):
2Fe2TiO4 + SiO2 = 2FeTiO3 + Fe2SiO4
2Usp + Q = 2Ilm + Fa.
This reaction and the results from Table 11 are plotted in Figure 11. Figure 11a shows the position of the QUIlF curve calculated using the activites of ilmenite, ulvospinel, and fayalite from the sole two-oxide pantellerite (sample 98520, White et al., 2005, 2009). As noted by Markl et al. (2010), this reaction shows that magnetite will be favoured at lower silica activities and higher temperatures. For lower activities of fayalite in olivine, the curve will be displaced to even higher temperatures, whereas more oxidizing conditions (and corresponding lower Usp and Ilm activities) will displace this curve to lower temperatures, expanding the stability of spinel in pantellerites. Therefore, it may be under these lower-temperature and more oxidizing (approaching NNO) conditions that the rare aenigmatite+magnetite assemblage variety of assemblage (iv) occurs.
In contrast with the natural samples, experimental results tend to produce magnetite instead of both ilmenite and fayalite. This is because experimentally applied fO2 is in general higher than
the one prevailing in nature. Additionally, experimental results tend to produce clinopyroxene with much higher aegirine contents than found in the natural samples.
5.2.3. Aenigmatite
Aenigmatite occurs in assemblages with ilmenite and olivine (>92 mol% Fa) over a wide range of temperature (<800°C) and oxygen fugacities (NNO-2.1 to NNO-0.9), but only at high silica activities where it frequently occurs in assemblages with quartz. The control of silica activity
on aenigmatite crystallization has also been noted by Macdonald et al. (2011, 2019), who described the antipathetic relationship between fayalite and aenigmatite as:
½FeTiO3 + Fe2SiO4 + ½Na2Si2O5 + SiO2 = ½Na2TiFe5Si6O20
½Ilm + Fa + ½Nds + Q = ½Aen.
This reaction is plotted in Figure 11b. The position of the curve as plotted is based on the activities of ilmenite, and fayalite from the highest-temperature sample with the fayalite-ilmenite-aenigmatite assemblage (the tuhualite-bearing 160541; Bagiński et al., 2018). All curves are calculated with
aNds (melt) = 1.0, which may be assumed for strongly peralkaline rocks (Carmichael et al., 1974;
White et al., 2005). Lower activities of either ilmenite (suggesting oxygen fugacities closer to NNO) or fayalite displaces this curve to lower temperatures. We present an alternate expression of this reaction that includes an explicit role for oxygen fugacity (Figure 11c),
⅓FeTiO3 + ⅓Fe2O3 + ⅓Fe2SiO4 + ⅓Na2Si2O5 + SiO2 = ⅓Na2TiFe5Si6O20 + ⅙O2
⅓Ilm + ⅓Hem + ⅓Fa + ⅓Nds + Q = ⅓Aen + ⅙O2.
The equation for this calculation is presented in Table 11 and was derived from the data used by Macdonald et al. (2011) reproducing also the result of the previous reaction well and demonstrates dual roles of high silica activity and low oxygen fugacity on aenigmatite stability. The ilmenite-out reaction (viz., “no-oxide field”) was described by White et al. (2005) as a function of temperature and oxygen fugacity and recast as a function of these plus silica activity by Macdonald et al. (2011):
¼ FeTiO3 + ½ Fe2O3 + ¼ Na2Si2O5 + SiO2 = ¼ Na2TiFe5Si6O20 + ¼ O2.
¼Ilm + ½Hem + ¼Nds + Q = ¼Aen + ¼ O2.
This reaction is plotted in Figure 11d with curves representing oxygen fugacities from NNO-2 to
NNO-0.9 (with ilmenite compositions calculated with equation 4 above), representing the range of conditions from Table 10.
5.2.4. Amphibole
Amphibole is an uncommon phase at Pantelleria, having been reported only occasionally from pre-Green Tuff ignimbrites (Jordan et al., 2018) and from the younger lavas and tuffs related to Cuddia Mida and Fastuca on the northern slopes of Montagna Grande (Rotolo et al., 2007; White et al., 2009). In contrast, amphibole is a common phase in Eburru pantellerites, In both cases, it occurs in assemblages with aenigmatite, ilmenite, and clinopyroxene at temperatures <730°C and oxygen fugacities between NNO-0.9 and NNO-2.1. The experimental results of Charles (1977) suggest that the stability of amphiboles in the richterite-ferrorichterite solid solution series expands to higher temperatures as a function of higher Mg content and lower oxygen fugacity. For example, at oxygen fugacities defined by the FMQ buffer (NNO-0.75), the end-member ferrorichterite (XFetot = 1.0) is stable at temperatures below 535°C, which increases with increasing Mg to 730°C (XFetot = 0.8), 910°C (XFetot = 0.6), and up to 1025°C (XFetot = 0.0). With decreasing oxygen
fugacity, the stability of end-member ferrorichterite increases from 535°C (NNO-0.75) to 760° (NNO-4). Sample 98527 (Scirafi, Pantelleria, White et al., 2009) has amphibole with XFetot ≈ 0.8,
which is stable at 730°C at NNO-0.75; this is consistent with the calculated temperature (729°C) and oxygen fugacity (NNO-0.88). The other reported natural amphiboles have 0.92 < XFetot < 0.98, with calculated temperatures <720°C and oxygen fugacities between NNO-1.0 and NNO-2.1 (Figure 12).
5.3 Implications for the Pantelleria magmatic system
Further constraints on pre-eruptive redox conditions and temperatures of pantellerite magmas of Pantelleria can be gained from our results. As already pointed out by Di Carlo et al.
(2010), the P-T stability of aenigmatite represents the main phase equilibrium argument to constrain the pre-eruptive temperature of pantellerites at about 730±10°C and redox conditions between NNO-0.5 and NNO-2.0. Our findings, which show that olivine displays a thermally restricted stability field at 750±20°C (for H2Omelt in the range 3-4.5 wt%), is in full agreement with such an
estimate. Alkali feldspar, clinopyroxene and olivine compositions are also successfully reproduced at around 750°C. At lower temperature (i.e., 680°C) mineral phases are more evolved (i.e., Fe-rich Ol/Cpx or Or-rich Afs) than their natural counterparts. It may be noted that at 750°C and H2Omelt
ranging between 3 wt% and 4.5 wt% the crystal content of experimental products is similar to that observed in natural pantellerites while at 680°C it increases from 30 wt% to 63 wt%. We stress here that crystal contents of erupted material could be altered by transport processes associated to magma segregation and up rise. But if equilibrium experiments do reproduce them, then the implications are that equilibrium prevailed in the reservoir and that the dynamic associated to melt extraction and eruption maintained crystal proportions up to the surface.
Melt inclusion studies (Gioncada and Landi 2010; Neave et al., 2012; Lanzo et al., 2013) have reported a slightly lower average water content (H2Omelt =2.6 1.2 wt% for 80 MI analysed),
yet H2Omelt ranges between 1.3 wt% and 4.9 wt%. The low end of this range of H2Omelt possibly
reflects diffusional loss of water from the inclusion during magma uprise and eruption. In support of this is the fact that most of melt inclusions are hosted by alkali feldspar which has a quite homogeneous composition (Ab65-Or35), which in our experiments is produced at 750°C, 1 kbar and
H2Omelt = 3-4 wt% (Figure 8). In Figure 13 whole rocks and melt inclusions (MI) are compared with
experimental glasses. Most of MIs fall close to, or on, the cotectic line defined by multiply saturated experimental charges at 750°C (i.e alkali feldspar, clinopyroxene, fayalite and aenigmatite-bearing charges), which gives further support to the above conclusion of a pre-eruptive magma temperature around 750°C.
Regarding amphibole and its rare occurrence in Pantelleria rhyolites, Di Carlo et al. (2010) suggested that it crystallises from a wetter and possibly deeper storage region. In this way, amphibole would coexist with alkali feldspar for crystal contents comparable with those observed in natural pantellerite. On the basis of our experimental results, an alternative explanation would be that amphibole and alkali feldspar coexist at T> 680°C in pantelleritic magmas with high fF2.
Regardless the strong correlations existing between the CaO/Na2O contents of amphibole and
H2Omelt (Figure 7a,b) indicate that melt water content during amphibole crystallisation was in the
range 3-4 wt%, if the magma was at 750°C, in agreement with the inferences made above.
6. Conclusions
This study was aimed at exploring the role of composition and fO2 on pantellerite phase
relationships by comparing experiments and thermodynamic modelling, along with recent results gathered on peralkaline rhyolites worldwide. Phase relationships and phase compositions show evident differences in relation both to small differences in whole-rock composition and to the imposed experimental parameters, in particular redox conditions. Our main findings can be summarized as follows:
1. The experimental results and thermodynamic modelling confirm that peralkaline rhyolite evolves at temperature ≤ 750°C prior to eruption.
2. For first time, the experiments successfully reproduced all mineral phases observed in pantellerites. In particular, the stability of fayalite has been experimentally constrained, at 1.0 kbar, 750°C, H2Omelt and redox conditions in the range NNO-1.3 to NNO-1.9. Experiments also confirm
that amphibole is stable in peralkaline rhyolites at temperature ≤ 800°C, being promoted by high fF2.
3. As anticipated, redox conditions have an influential role on the stability fields of some mineral phases and liquidus temperature of pantellerites. A “reaction series” along the liquid line of descent of felsic peralkaline oversaturated magmas has been established by combining experimental
and thermodynamical constraints, variations in aSiO2 and fO2 exerting a prime control, in addition
to temperature, melt water content and melt peralkalinity.
4. The data presented here can be considered in order to implement thermodynamic modeling software for phase equilibria in magmatic systems (e.g. Rhyolite Melts, Gualda et al., 2012) also for alkaline and peralkaline evolved magmas. Previous work has demonstrated (White et al., 2009; Romano et al., 2019) that such a model does not faithfully reproduce the transition between evolved pantelleritic and parental trachyte magmas.
Acknowledgements
PR is deeply grateful for all the support received from the „Magma Team‟ of ISTO during the experimental work. BS, JA and IDC acknowledge support from both LabEx VOLTAIRE (ANR-10-LABX-100-01) and EquipEx PLANEX (ANR-11-EQPX-0036) projects.
References
Albarède, F., 1995. Introduction to Geochemical Modelling. Cambridge: Cambridge University Press, 543p.
Almeev, R.R., Bolte, T., Nash, B.P., Holtz, F., Erdmann, M., Cathey, H.E., 2012. High-temperature, low-H2O Silicic Magmas of the Yellowstone Hotspot: an Experimental Study of Rhyolite from the Bruneau–Jarbidge Eruptive Center, Central Snake River Plain, USA. Journal of Petrology 53, 1837–1866. https://doi.org/10.1093/petrology/egs035
Andersen J., L.D., H., D.D., M., P., 1993. QUILF: a Pascal program to assess equilibria among Fe-Mg-Mn-Ti oxides, pyroxenes, olivine, and quartz. Computers & Geosciences 19, 1333–1350. https://doi.org/10.1016/0098-3004(93)90033-2
Andújar, J., Scaillet, B., 2012 Experimental Constraints on Parameters Controlling the Difference in the Eruptive Dynamics of Phonolitic Magmas: the Case of Tenerife (Canary Islands). Journal of Petrology 53, 1777–1806, https://doi.org/10.1093/petrology/egs033
Andújar, J., Scaillet, B., Pichavant, M., Druitt, T.H., 2015. Differentiation Conditions of a Basaltic Magma from Santorini, and its Bearing on the Production of Andesite in Arc Settings. Journal of Petrology 56, 765–794. https://doi.org/10.1093/petrology/egv016
Avanzinelli, R., 2004. Crystallisation and genesis of peralkaline magmas from Pantelleria Volcano, Italy: an integrated petrological and crystal-chemical study. Lithos 73, 41–69. https://doi.org/10.1016/j.lithos.2003.10.007
Bagiński, B., Macdonald, R., White, J., Jeżak, L., 2018. Tuhualite in a peralkaline rhyolitic ignimbrite from Pantelleria, Italy. European Journal of Mineralogy 30, 367–373.
https://doi.org/10.1127/ejm/2018/0030-2711
Bailey, D.K., Schairer, J.F., 1966. The System Na2O−Al2O3−Fe2O3−SiO2 at 1 Atmosphere, and the Petrogenesis of Alkaline Rocks. Journal of Petrology 7, 114–170.
Bohrson, W.A., Reid, M.R., 1997. Genesis of Silicic Peralkaline Volcanic Rocks in an Ocean Island Setting by Crustal Melting and Open-system Processes: Socorro Island, Mexico. Journal of Petrology 38, 1137–1166. https://doi.org/10.1093/petroj/38.9.1137
Burnham, C.W., Holloway, J.R., Davis, N.F., 1969. Thermodynamic Properties of Water to 1,000° C and 10,000 Bars, in: Burnham, C.W., Holloway, J.R., Davis, N.F. (Eds.), Thermodynamic Properties of Water to 1,000° C and 10,000 Bars. Geological Society of America.
Cadoux, A., Scaillet, B., Druitt, T.H., Deloule, E., 2014. Magma Storage Conditions of Large Plinian Eruptions of Santorini Volcano (Greece). Journal of Petrology 55, 1129–1171. https://doi.org/10.1093/petrology/egu021
Carmichael, I.S.E., 1962. Pantelleritic liquids and their phenocrysts. Mineralogical Magazine and Journal of the Mineralogical Society, Volume 33, 86–113. https://doi.org/10.1180/minmag.1962.033.257.03.
Carmichael, I. S. E., 1966. The iron-titanium oxides of salic volcanic rocks and their associated ferromagnesian silicates. Contributions to mineralogy and petrology, 14(1), 36-64.
Carmichael, I,S,E., Turnerm F.J., Verhoogen, J., 1974. Igneous petrology. McGraw Hill, New York, N.Y.
Carmichael, I.S.E., MacKenzie W. S., 1963. Feldspar-liquid equilibria in pantellerites; an experimental study. American Journal of Science, 261(4), 382-396.
Charles, R. W., 1977. The phase equilibria of the intermediate composition on the pseudobinary Na2CaMg5Si8O22(OH)2 - Na2CaFe5Si8O22(OH)2. American Mineralogist 277, 594-625.
Chase, M.W., Jr., Davies, C.A., Downey, J.R., Jr., Frurip, D.J., McDonald, R.A., Syverud, A.N., 1985. JANAF Thermochemical Tables, 3rd Edition. Journal of Physical Chemistry Reference Data 14, supp. no. 1
Civetta, L., Cornette, Y., Gillot, P.Y., Orsi, G., 1988. The eruptive history of Pantelleria (Sicily channel) in the last 50 ka. Bulletin of Volcanology. 50, 47–57. https://doi.org/10.1007/BF01047508.
Civetta, L., D‟Antonio, M., Orsi, G., Tilton, G., R., 1998. The Geochemistry of Volcanic Rocks from Pantelleria Island, Sicily Channel: Petrogenesis and Characteristics of the Mantle Source Region. Journal of Petrology 39, 1453–1491. https://doi.org/10.1093/petroj/39.8.1453.
Conrad, W.K., 1984. The mineralogy and petrology of compositionally zoned ash flow tuffs, and related silicic volcanic rocks, from the McDermitt Caldera Complex, Nevada-Oregon. Journal of Geophysical Research. 89, 8639. https://doi.org/10.1029/JB089iB10p08639.
Dall'Agnoll, R., Scaillet, B., Pichavant, M., 1999. An Experimental Study of a Lower Proterozoic A-type Granite from theEastern Amazonian Craton, Brazil, Journal of Petrology 40, Pages 1673–1698, https://doi.org/10.1093/petroj/40.11.1673.
Devine, J.D., Gardner, J.E., Brack, H.P., Layne, G.D., Rutherford, M.J., 1995. Comparison of microanalytical methods for estimating H2O contents of silicic volcanic glasses. American