Distribution Network Use-of-System Charges Under High
Penetration of Distributed Energy Resources
by
Ashwini Bharatkumar
B.B.A., Operations Research & Information Systems University of Wisconsin-Madison, 2012 Submitted to the Engineering Systems Division
and
Department of Electrical Engineering and Computer Science in Partial Fulfillment of the Requirements for the Degrees
of
Master of Science in Technology and Policy and
Master of Science in Electrical Engineering at the
MASSACHUSETTS INSTITUTE OF TECHNOLOGY February 2015
c
2015 Massachusetts Institute of Technology. All rights reserved.
Signature of Author
Engineering Systems Division Department of Electrical Engineering and Computer Science January 30, 2015 Certified by
Jose Ignacio P´erez-Arriaga Visiting Professor, Engineering Systems Division Thesis Supervisor Certified by
James L. Kirtley, Jr. Professor of Electrical Engineering Thesis Reader Accepted by
Dava Newman Professor of Aeronautics and Astronautics and Engineering Systems Director, Technology and Policy Program Accepted by
Leslie A. Kolodziejski Professor of Electrical Engineering and Computer Science Chair, Department Committee on Graduate Students
Distribution Network Use-of-System Charges Under High Penetration of Distributed Energy Resources
by
Ashwini Bharatkumar
Submitted to the Engineering Systems Division and
Department of Electrical Engineering and Computer Science
on January 30, 2015 in Partial Fulfillment of the Requirements for the Degrees of Master of Science in Technology and Policy
and
Master of Science in Electrical Engineering Abstract
Growing integration of distributed energy resources (DER) presents the electric power sector with the potential for significant changes to technical operations, business models, and industry struc-ture. New physical components, control and information architecture, markets, and policies are required as the power system transitions from one of centralized generation and passive load to a network of increasingly decentralized generation and diverse system users. Price signals will play a crucial role in shaping the interactions between the physical components and users of the electric power system. Distribution network use-of-system (DNUoS) charges signal to network users how their utilization of the distribution system impacts system costs and each user’s share of those costs. Distribution utilities cover network operation and maintenance costs and recover infrastructure in-vestments through DNUoS charges applied to network users. This thesis develops a framework for the design of DNUoS charges that addresses the challenge of distribution network cost allocation under growing penetration of DER. The proposed framework is comprised of 1) the use of a refer-ence network model (RNM) to identify the key drivers of distribution system costs and their relative shares of total costs, and 2) the allocation of those costs according to network utilization profiles that capture each network user’s contribution to and share of total system costs. The resulting DNUoS charges are highly differentiated for network users according to the impact that network use behaviors have on system costs. This is a substantial departure from existing methods of distri-bution network cost allocation and thus presents implementation challenges and implications that may be addressed in a range of ways to achieve varying regulatory objectives.
Thesis Supervisor: Jose Ignacio P´erez-Arriaga
Title: Visiting Professor, Engineering Systems Division Thesis Reader: James L. Kirtley, Jr.
Acknowledgements
There are multiple people to whom I offer my sincerest gratitude for your intellectual generosity, encouragement, and support in the development of this thesis. MIT is a truly remarkable place of so many enrichment opportunities. I want to thank the people that have contributed to creating a mentally stimulating environment that has continually pushed me outside my comfort zone and unquestionably reshaped the way I think.
First and foremost, thank you so much to Ignacio, one of the most patient individuals I know, for your guidance, expertise, and ceaseless encouragement. It has been inspiring to work with you, and I hope that I will one day do justice to the knowledge and wisdom you have so generously imparted.
Thank you Professor Kirtley for your expertise and feedback, for pointing me towards helpful resources, for answering my questions along the way, and for fruitful conversations about my broader intellectual development.
Thanks to Claudio Vergara for your boundless generosity in sharing your expertise, help, and guidance. I am exceedingly grateful for the knowledge and time you have so readily offered. Thanks to Carlos Mateo for so speedily answering my countless emails and for all of your advice and guidance on utilizing the reference network model.
Thanks to Jesse Jenkins for your highly valuable insight, suggestions, advice, and critical thinking, and for asking the right questions to guide my own thinking.
Many thanks also to Richard Tabors, Tom´as Gomez, and Carlos Batlle for contributing to the intellectual foundations upon which I have only just started – and will continue – to build my understanding of the power sector.
Thanks to TPP for launching me into the continuing quest of grad school. Thank you Barb, Frank, and Ed for all of your help and support. Thanks to my friends and classmates for being the most wonderful sources of enriching conversation and constant exposure to new wonders of life.
And finally, thank you especially to my parents for your support and patience through the journey of grad school that is only just beginning. Thank you for being such incredible role models and friends, thank you for all of your honesty and encouragement. I would not be at this juncture in life without you.
Contents
List of Figures 4
List of Tables 5
1 Introduction 6
2 Background 11
2.1 Technical Considerations of DNUoS Charge Design . . . 16
2.2 Regulatory Economics of DNUoS Charge Design . . . 21
3 An updated framework for network use-of-system charge design 25 3.1 Identifying the cost drivers . . . 29
3.2 Allocating costs to drivers . . . 32
3.3 Allocating costs to network users . . . 34
3.4 Choosing the DNUoS charge format . . . 39
4 Using a Reference Network Model for DNUoS Charge Design 41 4.1 Building a distribution network incrementally . . . 41
4.2 Defining the network characteristics . . . 43
5 Simulation Results: Computing a LV DNUoS Charge 49 6 Implementation & policy considerations 60 6.1 Energy prices and network charges . . . 60
6.2 The “Utility Death Spiral” and DNUoS charge dynamics . . . 60
6.3 Practical Limitations . . . 64
7 Conclusions, Summary, & Future work 65
8 References 66
Appendices 70
A 48-hour load and PV generation profiles 70
B Network C (LV and MV load) 73
C MV/LV substations 74
List of Figures
1 The distribution network charge here accounts for approximately 35% of the final rate charged to a typical residential end user per kWh of electricity consumption. Image
source: [48] . . . 8
2 The cost components to be collected through DNUoS charges . . . 9
3 CAISO load and solar output on January 5, 2015 (top) and July 5, 2014 (bottom) . 13 4 Layout of a typical electricity distribution system. Image source: [23] . . . 17
5 The voltage profile typical of a radial feeder with residential distribution customers. Image source: [23] . . . 18
6 The voltage profile typical of a radial feeder with residential distribution customers. Image source: [62], adapted from [40] . . . 19
7 How the cost components to be collected through DNUoS charges can evolve over time 23 8 All that the distribution utility sees of a network user’s behind-the-meter activity is a user profile . . . 25
9 Cost allocation involves first splitting the total network cost at each voltage level into the costs associated with each driver, then splitting the cost associated with each driver across network zones, and finally allocating the costs of each driver within each zone to network users based on their profiles . . . 28
10 The DSO’s total recoverable costs at each voltage level are multiplied by the driver shares computed with RNM output to determine how much of the total DSO recov-erable costs should be assigned to each driver. . . 35
11 The full Network A . . . 47
12 The full Network B . . . 48
13 The process demonstrated here for allocating the initial, Year 0 asset base should be repeated for each asset vintage. The sum of the annual DSO costs associated with each vintage yield the total DSO cost to be recovered each year. . . 52
14 Allocating connection costs to distinct clusters of network users in Network A. . . 53
15 The LV feeders and end users served by MV/LV substation CCTT10 . . . 55
16 The LV feeders and end users served by the injecting MV/LV substation CCTT5 . . 57
17 The cost components to be collected through DNUoS charges (only the LV network cost is used as an example here; the same components make up the total MV and HV network costs) . . . 62
18 How the cost components to be collected through DNUoS charges and the resultant price signals sent to network users may evolve over time . . . 63
19 Sample residential profiles . . . 70
20 Sample commercial profiles . . . 71
21 Sample industrial profiles . . . 72
22 The full Network C (LV and MV load) . . . 73
23 A magnified section of Network B Run01 (connection network) with load and PV generation points . . . 76
24 A magnified section of Network B Run00 (full network) with load and PV generation points . . . 77
List of Tables
1 Nominal distribution voltages in the U.S. and Europe . . . 16
2 The cost components derived from RNM output . . . 34
3 Sample reliability targets for an urban network and a concentrated rural network such as the network built in the case study . . . 43
4 The key parameters that are changed in each run to introduce cost driver constraints sequentially . . . 44
5 Characteristics of the simulated concentrated rural network . . . 45
6 Network A and B load and generation parameters . . . 46
7 The NPV of the total and incremental costs associated with each RNM run for Net-work A and NetNet-work B, and the resulting cost driver shares . . . 49
8 RNM cost outputs for Network A . . . 50
9 RNM cost outputs for Network B . . . 50
10 Total DSO costs and allocation of DSO costs to drivers for Network A (only LV load) and Network B (LV load and PV generation) . . . 52
11 Total DSO costs and allocation of DSO costs to drivers for Network C (LV and MV load) . . . 54
12 The simultaneity factors used in the greenfield and brownfield RNM . . . 54
13 The contribution of network users served by MV/LV substation CCTT10 to the peak load at HV/MV substation . . . 56
14 The contribution of network users served by injecting MV/LV substation CCTT5 to the peak load at HV/MV substation . . . 58
15 DNUoS charge for sample LV network user in Network A . . . 59
16 DNUoS charge for sample LV network user in Network B . . . 59
17 The MV/LV substations in Network A . . . 74
1
Introduction
The power system is being reshaped by a host of changes rippling throughout the electric power sector and the utility industry. While all levels of the power system are facing new challenges driven by the potential for a range of new technologies and policies, the growing integration of distributed energy resources (DER) such as distributed generation and storage, electric vehicles, and demand response may significantly alter the planning and operation of the distribution system and the rest of the power system. A variety of reports — by organizations including Eurelectric [16], the International Energy Agency [29], the Edison Electric Institute [34], the Electric Power Research Institute [15], and many more — have described the power system-wide challenges and opportunities that DER may present or are already presenting in Europe and the United States. Corporations such as General Electric [45], ABB [1], and Siemens [57] have articulated visions and plans for a future power system and utility sector with increased integration of decentralized resources.
Distribution systems around the world are seeing growing integration of DER. As of October 2014, the installed capacity of solar photovoltaics (PV) in Germany was 38 GW. Approximately 60% of PV installations have a rated capacity of 100 kW or less and are connected to the distribution network. In areas such as Bavaria, the installed capacity of distributed generation (about 78% of which is solar PV) represents a large proportion of the region’s peak load. In Galicia, Spain, the installed capacity of DG (which is primarily combined heat and power and medium voltage wind) is 1.2 times the distribution service area’s peak demand. Of Italy’s 17 GW of solar PV installed capacity, over 10 GW are connected to distribution networks [16]. Total solar PV installed capacity in the United States is approximately 17.5 GW, with California accounting for over 8 GW and Arizona accounting for nearly 2 GW [55]. Much of this installation is taking place at the level of the distribution system, with residential solar PV accounting for approximately 16% of total PV installed capacity [53].
The growth of DER has been shaped by a combination of forces, including decarbonization policy goals, infrastructure investment deferral opportunities, greater emphasis on reliability, resilience, and self-sufficient electricity supply, falling costs of distributed technologies such as solar PV, and opportunities for enhanced power quality and more customer-tailored electricity service offerings [38]. Managing the integration of DER in existing power systems presents the need for simultane-ous updating of distribution network infrastructure, information and communication technologies (ICT), and technical standards; business models and industry structure; and regulatory and policy frameworks. The regulations that govern the planning and operation of the power system should ensure that a level playing field exists for the combination of technologies and business models that most efficiently meet the goals and objectives defined for the electricity sector. Creating such a level playing field requires designing regulations and markets that reflect the costs and benefits of the integration of a range of technologies and their operation in the power system.
Traditionally, system operators have far less visibility over and coordination of the distribution system relative to centralized generation and transmission. A “fit-and-forget” approach has been taken in the design and management of electricity distribution because the distribution network has largely consisted of predictable, passive loads [60]. Distribution utilities and system operators have typically built, operated, and maintained the lines, substations, and transformers necessary to serve end users, with limited control over and feedback from those users. However, the proliferation of new technologies — including distributed generation (DG), distributed storage (DS), and automated load control and demand response (DR) — requires greater interaction between distribution network
operators and network users. Grid users are no longer “simple consumers” [46]. More prevalent DG and sale of electricity back to the grid, and increasing utilization of DR is obscuring the distinction between traditional producers and consumers. The integration of DER heralds the growth of distributed decision-making about the installation and operation of generation resources and other system components. These decisions that were once wholly under the purview of the distribution system operator or distribution utility impact the utility’s operational and capital expenditures. For example, at the heart of the ongoing controversy over net metering and volumetric electricity rates is the idea that owners of DG are not paying for their use of the distribution network and are instead subsidized by network users who do not own DG. Yet, the integration of DG presents benefits for network investment and operation that must be remunerated. Ensuring optimal system operation requires enhancing coordination between distributed decision-makers and system operators. In order to coordinate agents on a level playing field that reflects system conditions and the impacts of agents’ actions on those conditions, price signals will serve as crucial mechanisms by which to guide distributed decision making to achieve outcomes as close as possible to central optima. This key goal of electricity prices or rates was first summarized in the definition of “reasonable” public utility rates stated by James Bonbright in 1960: “Reasonable public utility rates, like reasonable prices in general, are rates designed to perform with reasonable effectiveness multiple functions as instruments of social control” [5]. While the regulation and operation of the power sector, and broader societal goals have certainly evolved since 1960, the fundamental purpose of price signals and rate setting to guide system users towards achieving those goals remain unchanged. As distribution system planning and operation transitions from a passive model to a model of active management of and interaction with network users selling services to the distribution network operator, the communication of accurate price signals derived from network planning and operational needs and the response of end users to those signals will be critical [19]. This thesis presents a framework for the design of one such price signal in a broader system of price signals: the distribution network use-of-system (DNUoS) charge.
DNUoS charges signal to network users how their utilization of the distribution system impacts system costs and each user’s share of those costs. Distribution utilities cover network operation and maintenance costs and recover infrastructure investments through DNUoS charges applied to network users. Well-designed DNUoS charges can enable more efficient use of the distribution system by, for example, incentivizing efficient location or siting of DER and optimal operation of DER in response to distribution system conditions. Figure 1 below is an example residential rate schedule for Pacific Gas & Electric [48]. It illustrates that a typical end user’s electricity bill is comprised of charges for a variety of services, and it highlights the component of the final bill – the distribution network charge – upon which this thesis focuses. The rate schedule displayed here includes a distribution charge that is approximately 35% of the total residential rate. Generally, transmission and distribution use-of-system charges can range from approximately 15%-40% of customer electricity bills, depending upon the size and type of the customer (residential, commercial, or industrial) [14].
The terms “distribution utilities” and “distribution” are used here to refer to the provision of net-work connectivity and delivery of electricity between transmission substations and end users in the distribution network. Distribution services are provided by Distribution System Operators (DSOs) or distribution companies, which typically own, operate, and maintain the distribution network. Under varying regulatory conditions, DSOs may also perform retailing or other commercial activi-ties, but those activities are ignored here. The distribution network costs that are considered are the capital expenditures (CAPEX) — namely, the annual depreciation expenses of capital costs depreciated over the lifetime of network assets and the regulated return on the DSO’s rate base, as
Figure 1: The distribution network charge here accounts for approximately 35% of the final rate charged to a typical residential end user per kWh of electricity consumption. Image source: [48]
well as annual operation and maintenance expenditures (OPEX) of the network, which are roughly proportional to the physical volume of assets. Before allocating distribution costs amongst network users, the utility commissioner determines the total revenue requirement that a distribution utility should collect from end user rates based upon CAPEX and OPEX deemed prudent[2]. The “costs” to be allocated to network users in DNUoS charges are thus more accurately identified as the DSO’s total recoverable costs, or revenue requirement. The components of the DSO’s recoverable costs are illustrated in Figure 2.
The topic of determining the distribution utility’s revenue requirement is not addressed in this thesis. It is assumed that a suitable revenue requirement has been determined for a specified test period through the use of either cost-of-service or performance-based remuneration that will fully cover the distribution utility’s costs (including a rate of return on capital investments) [5].1 This
Figure 2: The cost components to be collected through DNUoS charges
thesis develops a framework for the step that follows the determination of the revenue requirement, that is, the allocation of the total collectable revenue for a specified year amongst distribution network users. The focus is not on the question of how much revenue is collected, but rather, on the question of who pays and how much does each distribution network user contribute to total DSO costs and revenue?
Growing integration of DER calls for the redesign of existing approaches to distribution network cost allocation because of the greater diversity of network utilization patterns that DER introduce. A new approach to DNUoS charge design should more accurately relate the network charge paid by users to their impacts on network costs. Such a granular approach to distribution network cost allocation is a departure from the current practice of charging network users average rates that are computed for customer classes, each class assumed to consist of customers with similar network utilization behaviors. As network use patterns diversify, so too do the impacts of network use on distribution system operations and investments. For example, it may no longer be the case that large swaths of residential electricity customers have similar profiles of network use behavior with similar impacts on the distribution network. Instead, through decisions to utilize distributed generation, electric vehicles, or other distributed resources, network users can have highly differentiated impacts on the distribution system.
upon users’ network profiles. The concept of developing network use profiles for distribution network cost allocation was first proposed in [46]. The approach relies upon: 1) the use of a reference network model (RNM) to identify the key drivers of distribution system costs, and 2) the allocation of those costs according to network utilization profiles that capture each network user’s contribution to and share of total system costs. This thesis further develops the proposed approach. Essential to the implementation of this cost allocation procedure is the availability of an RNM, or distribution network-planning tool, that accurately determines the impact of the connection and behavior of the network users on total distribution system costs. Such a tool allows a utility regulator to identify the key drivers of network costs and the portion of the total network cost corresponding to each cost driver. Additionally, the procedure relies upon the availability of complete information about the network utilization profile of each network user. Well–designed network tariffs compute the amount users pay for their utilization of the network through the use of data and measurements of parameters such as each user’s location within a distribution system, contributions to peak power flows or contracted capacity, and profiles of power injection and withdrawal at the point of connection of that user, not upon an assumption that disparate network users follow generalized, identical profiles of consumption or generation. Each network user’s profile reveals the contribution of that user to each network cost driver, to the cost associated with each cost driver, and as a result, to the total network cost. This thesis first approaches the design of DNUoS charges under the assumption of complete information about network use profiles through advanced metering or through the practice of contracting network capacity. When this information is not fully available, simplifications must be made to the proposed framework. Too many simplifications in the case of a significant lack of information on network utilization profiles can prevent meaningful redesign of network charges for increasing penetration of DERs; however, at the brisk pace of DER integration, of advanced metering technology improvements, and of regulatory and policy directives for advanced meter infrastructure rollout, it is not unreasonable to assume the availability of the metering and information collection capabilities required for adoption of the updated network charge design principles described here. In the absence of either or both of the above elements, simplifications must be made to the network cost allocation process. Those simplifications are briefly discussed in the final sections of this work.
The structure of this thesis is as follows: Section 2 describes the technical, economic, and regu-latory principles of distribution network planning and operations that underpin the allocation of distribution network costs. Section 3 describes the proposed approach to calculating network costs and designing DNUoS charges. Section 4 describes how an RNM is utilized in the computation of DNUoS charges; Section 5 explains the simulation modeling process and results obtained. Section 6 discusses the policy and regulatory implications of implementing redesigned DNUoS charges. Section 7 concludes and summarizes future work.
2
Background
In most power systems, the costs of the distribution network are allocated to residential customers primarily on the basis of their volumetric energy consumption — that is, on the basis of the total kilowatt-hours consumed by each customer. Where utility services are unbundled and each ser-vice is charged a separate retail rate, an average volumetric rate (i.e. $/kWh) for the distribution component of residential customers’ retail electricity bills is computed as part of the rate-setting process. Typically, the distribution rate is calculated by classifying the DSO’s total costs accord-ing to cost-definaccord-ing service characteristics — namely energy, demand, and customer costs.2 (For residential users, most costs are classified as energy and customer costs.) The total costs associ-ated with each service characteristic are allocassoci-ated amongst customer classes — usually residential, commercial, and industrial customer classes — according to the magnitudes of the measurable ser-vice characteristics of each customer class. For example, the DSO’s total energy-related costs are allocated to the residential rate class according to the share of total kWh consumed by residential customers. The residential energy charge for distribution is then simply the energy-related costs allocated to the residential rate class divided by the total kWh of electricity consumed by residential users over the course of the billing period [2].
This per–kWh distribution network rate is sometimes bundled together with the rates for energy consumption (or generation), transmission, and other regulated charges (such as programs for energy efficiency, promotion of renewables, industry restructuring, etc.) that are included in the electricity bill as shown in Figure 1 to compute a total $/kWh rate for residential customers. In some cases, the rates paid by residential network users also include a fixed, per-customer component and perhaps a per-kW rate for the consumption capacity contracted for a billing period, though these are usually a small fraction of a residential end-user’s electricity rate.
In this existing approach to distribution network cost allocation, costs are assigned to rate classes or groups of customers that are a priori identified as having similar service characteristics. The role of profiles, as developed in this thesis, is to obviate the need to group customers into classes. Rather, by applying the same cost allocation method to the profiles of all network users, differences in users’ profiles will reveal differences in service characteristics, the commensurate differences in cost of service, and thereby result in different charges for users with different service characteristics. Allocating distribution network costs to each network user based on profiles is one step closer to allocating costs according to the cost causality of each user. The concept of rate classes will prove obsolete with growing integration of DER because of the difficulty of isolating the costs and benefits attributable to load and DG and grouping increasingly diverse network users into classes.
To determine the cost of serving customer classes, utilities conduct detailed cost of service studies. However, such cost of service studies are time and resource intensive, and may not be the most efficient manner in which to identify the drivers of distribution network costs and update the assignment of costs to cost drivers as network use and network design change. Using an RNM can enable the regulator and DSO to apportion system costs amongst drivers and allocate those costs amongst customers in an automated manner, allowing more frequent updating of cost allocation. Indeed, this requires accurate parametrization of the RNM used for rate design, but assuming that an upfront effort is undertaken to populate the RNM with an accurate catalog of available equipment and equipment costs, and the relationship between equipment characteristics and customer demand, then the RNM can be relied upon to accurately reflect changes in network design and costs, costs
related to each driver, and costs allocated to each network user.
Allocating network costs primarily on the basis of volumetric energy consumption presents ineffi-ciencies in distribution systems evolving to incorporate a growing number of DER and a growing list of new stakeholders. These inefficiencies include: incomplete price signals to incentivize opti-mal network utilization; cross–subsidization among network users; and business model arbitrage of rate structures. For example, under existing policies of volumetric tariffs and net metering with conventional electricity meters, it is possible that network users without onsite generation subsidize utilization of the distribution network by users with DG. If a network user with DG produces enough energy to entirely offset his or her energy consumption requirements, then a net zero kilowatt–hours of energy are distributed to that network user. However, as is often the case with non–dispatchable DG, such as rooftop solar PV, periods of generation may not coincide with periods of peak consumption. For example, as data collected on a daily basis by the California Independent System Operator (CAISO) shows, peak solar PV output typically occurs between 11:00am and 3:00pm, while peak load at the wholesale level occurs between 6:00pm and 10:00pm. Figure 3 shows CAISO load and solar output on a winter day, January 5, 2015 (top), and on a summer day, July 5, 2014 (bottom) [6]. Since peak load and peak generation are unlikely to occur at the same instant of time in this example, the kilowatts of power distributed to meet network user demand during peak load hours are not significantly reduced by solar PV generation. In any given hour, the power output of PV, at the wholesale level, does not exceed or even approach total system demand. But, in particular distribution circuits, power output during peak generation hours may well exceed load.
Over the course of one day, the net energy for a network user may be zero, but in each hourly or quarter–hourly time frame, the magnitude of the user’s contribution to the kilowatts of power distributed through the network is nonzero. The particular characteristics of load and generation coincidence vary according to the load profile and generation resources in a distribution system. For example, in systems with summer consumption peaks resulting from midday air conditioning loads, solar PV generation coincides closely with load. The resulting reduction in distribution system capacity utilization can lead to a reduction of capacity–related distribution costs and future network reinforcement investments.3 But in general, volumetric network rates charged entirely per
kWh to the net energy distributed by the DSO to end users over the course of a billing period (such as a month) fail to fully take into consideration the drivers of distribution network costs, resulting in inefficient allocation of costs and cost–savings to network users.
3
The value of coincidence between midday air conditioning load (which primarily occurs at workplaces, or commer-cial and industrial (C&I) network user sites) and distributed solar output still relies upon utilization of distribution system components to meet non-residential load in the MV or HV networks with residential generation in the LV network. This is one example of how, even during periods of coincidence between load and injection from DG, the network is utilized for balancing and transporting power from DG to load.
The issue of cross subsidization is one challenge that lies at the core of the debate over net me-tering of DG and volumetric tariffs (and more broadly, over the integration of DER that reduce volumetric energy sales). What has been termed the “utility death spiral” is the positive feedback cycle characterized by reduced energy distribution — or lower volumetric sales — alongside higher costs and higher rates. With volumetric tariffs, lower energy sales result in lower revenue for the distribution utility. This reduces utility revenue, and the ability to recover costs unless distribution network costs fall or rates on the remaining volumetric energy sales rise. Fixed distribution costs such as the size of the asset base and thus the allowed return on the rate base, as well as the depreciation of existing assets remain unchanged with changes in volumetric energy distribution. Additionally, the use of distribution network capacity by individuals with DG may not be signifi-cantly diminished, since the grid is used for balancing production and consumption, as described above, and for maintaining power quality to all system users. Depending upon the characteristics of a particular distribution system — including DG location and the extent of network upgrades necessary to integrate DG — network costs may rise over the long run with greater penetration of DG [11], [41], [58], [61]. The allocation on a per–kWh basis of costs that are not driven exclusively by volumetric energy consumption results in users without captive generation subsidizing use of the distribution network by those with captive generation.
While DG serves as the primary example in this discussion, it is worth noting that the drawbacks of purely volumetric network charges are apparent not only with distributed generation, but with demand response and energy efficiency as well.4 In any of these cases, if volumetric energy
con-sumption falls but network capacity utilization or peak power concon-sumption are unchanged, then volumetric charges fail to consider the full impacts of user behavior on network costs, resulting in poor cost-reflectivity. More broadly, pricing mechanisms that result in lower network charges as a result of lower volumetric energy consumption give rise to the potential for cross subsidization. For example, measures to incentivize energy efficiency aim to reduce total energy consumption, but without temporal variation, they may not effectively reduce peak consumption [20]. This under-scores the importance of designing price signals that reflect the drivers of system costs (including network charges, time–and–location varying energy prices, and prices for other electricity services), and that are consistent with one another.
The changes in distribution network utilization introduced by DER are not entirely new. Rather, they suggest that the nature of residential distribution network use is increasingly mirroring the patterns of use exhibited by commercial and industrial (C&I) customers. Large C&I customers are typically connected directly to the high voltage (HV) or medium voltage (MV) distribution network and often have captive generation. Thus, the distribution sector is facing problems that have, to some extent, been addressed with C&I rate structures and revenue models, and the idea of developing a new method of distribution network cost allocation may benefit from the approaches currently employed for C&I grid use, such as metering energy and demand for all network users. An important limitation of existing approaches to network cost allocation for C&I customers is that they have been developed within the context of the prevailing consumer–only mentality, and as a result, ad hoc, approximate methods have been used to account for local generation in rate design. This is primarily because no sound method to determine cost causality at the distribution level has yet been available to regulators. The difficulty of determining cost causality arises from the discrete nature of network investments and the sharing of joint and common costs amongst multiple network users. This limitation can be addressed with the development and use of the
4Again, note that energy prices may be time-varying to reflect how generation costs change according to the time
aforementioned reference network models, as explained in greater detail in Section 4.
A distinguishing feature of C&I customers is the availability of detailed profiles of electricity con-sumption and production. Demand meters are installed to collect information in quarter–hourly intervals about peak demand within a billing period. Retail rates are typically structured to ac-count for energy consumption, demand,5 and grid connection and utilization, and vary by time of use. This rate structure enables better allocation of network costs according to network use, and therefore, according to cost causality. A new paradigm for distribution network charges for all network users — including both C&I and residential users — can compute network charges based on profiles of distribution network utilization and users’ contributions to network costs.
5
Again, here demand refers specifically to power consumption. For distribution networks with greater penetra-tion of DER, network charge design requires an approach that more generally accounts for both consumppenetra-tion and production in the distribution network.
2.1 Technical Considerations of DNUoS Charge Design
End-user needs and expectations of the services that can be provided by the power system are changing significantly, from bidirectional power flows and increased risk of overvoltage, to changes in the inertia and frequency response requirements of power systems with a high penetration of solar PV or wind. As the demands on the power system change – as technologies evolve, as policy goals change, as the nature of users’ needs change – the price signals sent to users of the system must capture those changes and communicate the impacts of those changes. DNUoS charges that allocate distribution costs according to network users’ impacts on cost drivers are price signals that accurately reflect the physical impacts of network utilization behaviors on system planning and operations. This section provides an overview of the relevant technical features of distribution network design and cost drivers, and the impact of increasing penetration of DER on the planning and operation of distribution systems.
While the distribution activity refers universally to the final distribution of electricity from the transmission network to end users, the voltage levels that are considered distribution voltages vary around the world. Table 1 lists the common ranges of distribution voltages in the U.S. and Europe [18], [23].6
Table 1: Nominal distribution voltages in the U.S. and Europe
Each voltage level of the distribution network may be designed and operated in a meshed, loop, or radial fashion. HV distribution networks are designed and operated in a meshed manner (except in very sparse, rural areas). MV networks are designed in a meshed configuration in urban, high-load-density areas and a radial configuration in low-load-high-load-density areas. In both cases, they are operated in a radial manner. The LV network is nearly always designed and operated radially, though there may be flexibility for network reconfiguration [16], [21]. Particularly high-load-density areas such as downtown areas in cities may have meshed underground LV networks for enhanced reliability. Figure 4 depicts the typical layout of a distribution network, from the primary transmission-to-distribution substation, along a three phase primary feeder main (which typically ranges in length from 1-30 miles) to the LV, single phase laterals and secondary feeders branching off the primary feeder [23].
6
Extra-high voltage (EHV) is sometimes used to refer to voltages in the 220 kV-380 kV range, but in this voltage range, the delineation between distribution and transmission – and the vocabulary used – is blurred. For example, according to IEC definitions, the EHV network in Germany performs the function of connecting bulk power generation to distribution networks. This is labeled as transmission in the U.S., with U.S. transmission voltages ranging from
Figure 4: Layout of a typical electricity distribution system. Image source: [23]
The critical new feature that DER integration introduces to distribution networks is the possibility of bidirectional real and reactive power flows. These bidirectional power flows introduce a variety of challenges for the planning and operation of existing distribution networks. One of the key challenges of integrating DG is the impact of reverse real power flow on steady state voltage in distribution feeders. Adding DG to a distribution feeder introduces the possibility of overvoltage, or voltage rise at the site of embedded generation on the feeder beyond ANSI7 limits, when local generation exceeds load [4], [40].
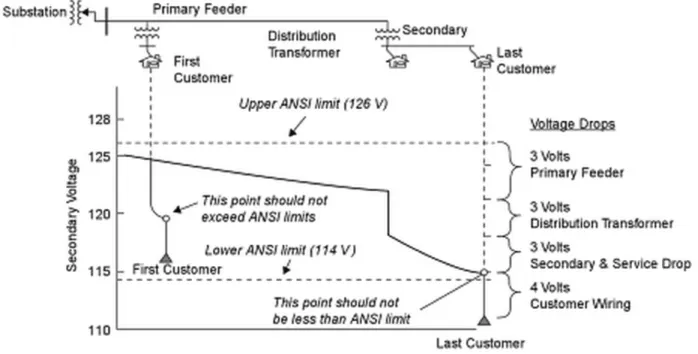
Under normal circumstances, the voltage for all end users along a distribution feeder should be maintained within +/−5% of the ANSI limits. The voltage drop along the line increases with increased distance and increased load, so ensuring compliance with voltage drop limits means ensuring that the voltage drop at the point of common coupling (downstream of the MV/LV transformer) of the end user farthest from the substation should be within the +/−5% threshold. During peak load, the last user’s voltage should be above the lower ANSI limit, and during peak generation or minimum load, the last user’s voltage should be below the upper ANSI limit. An example of the voltage profile of a radial feeder is shown in Figure 5 [23].
When the output of embedded generation on a feeder is less than or equal to the load farther from the substation along the feeder, then any injection by the DG serves ‘downstream’ load. When 230 kV-765 kV [9].
Figure 5: The voltage profile typical of a radial feeder with residential distribution customers. Image source: [23]
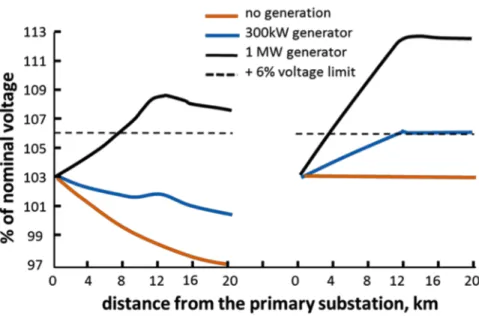
the DG output exceeds the load farther from the substation along the feeder, then the voltage at the DG connection point rises higher than the substation (and thus higher than elsewhere on the feeder). Some injected power serves downstream load, and some power flows towards the MV/LV substation serving the feeder. If there is no downstream load, then all injected power flows towards the substation, and the voltage rise at the DG connection point may be significant. Figure 6 illustrates the magnitudes of overvoltage along a feeder with DG installed mid-feeder under varying conditions of load and generation [40].
In order to maintain the voltage at each user’s connection point and point of common coupling (PCC) to the network, a variety of voltage regulation approaches are used. In light of standards that prohibit DER from actively regulating system voltage, voltage regulation is done by adjusting step voltage regulator (SVR) settings and on-load tap changers at distribution substation transformers, and by using switched and fixed capacitor banks [54]. Alternative overvoltage mitigation approaches include installing larger conductors or curtailing generation during periods of low demand [40]. Bilateral agreements between the DSO and DER operators may also permit the adjustment of inverter operating modes so that inverters can adjust their import and export of reactive power to regulate voltage at the PCC [61], [7]. Investments made by the DSO to reinforce the distribution network to address overvoltage problems are examples of costs that must be allocated amongst the DER that drive the costs [11]. Additional technical considerations of the integration of DER include impacts on feeder losses, power quality, and fault protection.8
Traditionally, distribution system planning has primarily needed to consider one worst case scenario of demands on the network – namely, power flows resulting from peak load. The integration of
8For example, additional voltage concerns arise under abnormal operating conditions, such as ground fault
Figure 6: The voltage profile typical of a radial feeder with residential distribution customers. Image source: [62], adapted from [40]
DER, particularly distributed generation, creates the opportunity for two worst case scenarios: one is still the occurrence of maximum load, but the other results from net injection, or the occurrence of reverse power flows when generation exceeds consumption [36]. Thus, distribution capacity costs include costs associated with accommodating peak load and costs associated with accommodating injections when local generation exceeds load. Allocation of capacity costs to network users consid-ers usconsid-ers’ contributions to load and injection. Usconsid-ers’ profiles indicate whether they are contributing to load or injection during any hour. When users inject power, their contribution to load is negative and their contribution to injection is positive. When users consume power, their contribution to load is positive and their contribution to injection is negative. The value of each of those activities to the network will vary according to the time of day and time of year: the net value that each agent presents to the network is determined by the sum of their contribution to consumption-related capacity costs and their contribution to injection-related capacity costs.
An estimation tool that will be used to determine the contribution of each network user to peak power flows in the absence of full information about users’ hourly profiles is the simultaneity factor (SF ). The SF of each network element indicates what portion of the peak power flow in those elements should be considered to determine the peak of the upstream element. For example, the SF of LV customers indicates what percent of the peak demand of each LV network user should be aggregated to determine the peak load on the MV/LV transformer immediately upstream of those LV users. Thus, the peak load on the MV/LV transformer is:
P
i
SF ∗ P eak LoadN etwork U ser i= SF ∗P i
P eak LoadN etwork U ser i
As described in greater detail in Section 5, SF s are utilized in the numerical analysis only to address the statistical limitations of the modeling technique applied. With real data for every
network user’s profile – as opposed to an artificial set of profiles generated from a sample of real profiles – SF s would not be required.
Reliability in distribution networks refers to continuity of supply, or the ability of the DSO to meet demand on a continuous basis. Continuity of supply is measured with reliability indices that quan-tify the frequency and duration of network service outages as an aggregate or per-customer average value. In much of the world, SAIDI (system average interruption duration index) indicates the average duration of interruptions per customer, and SAIFI (system average interruption frequency index) indicates the annual average number of interruptions per customer. In Spain, continuity of supply is measured with TIEPI (installed capacity equivalent interruption time) and NIEPI (in-stalled capacity equivalent number of interruptions) [21]. In the numerical example, TIEPI and NIEPI targets are the mechanism used to evaluate the role of reliability in driving distribution costs.
2.2 Regulatory Economics of DNUoS Charge Design
There are multiple objectives for well-designed distribution network charges, as described in [5] for utility rates in general and in [46] for DNUoS charges in particular. They must provide sufficient revenue for network companies to recover efficiently–incurred network capital and operating costs; they should send economic signals to network users about how their behaviors impact network costs and allocate costs according to cost causality — or allocate costs to those who cause them to be incurred; they should be nondiscriminatory or equitable by applying the same method to determine charges for all network users;9 they should be transparent in that the method used to compute the tariffs should be made publicly known; they should be stable in that they minimize regulatory uncertainty; and they should, to the extent possible, be simple and understood by network users and network service providers. Tariff design and practical implementation often requires tradeoffs between the aforementioned regulatory objectives [2].
In determining the allocation of distribution network costs amongst network users, key features of electricity distribution economics play a critical role. Distribution companies exhibit the defining characteristics of natural monopolies. They experience economies of scale, or a falling average cost of service over the relevant range of service provision10. As such, they experience diminishing marginal costs until the point at which marginal costs are equivalent to average costs. Because marginal costs (or the incremental cost per additional unit of output) are consistently less than average costs, marginal cost pricing does not ensure the full recovery of total distribution costs. Additionally, as with transmission networks, the reality of distribution investments is that investments cannot be made in a continuous manner; rather, there are discrete levels of feasible investment based on standard equipment capacities [51]. The approach to network charge design proposed here relies upon allocating the incremental costs associated with network cost drivers to network users based on a weighted average computed through users’ contributions to cost drivers. This approach is a blend of an incremental and average cost approach to ensure cost recovery, rather than a short-run marginal cost approach.
While the cost-of-service standard, or the principle of cost causality, underlies the principles of sound rate structure, there have conventionally been limitations on the extent to which electricity rates are reflective of the cost of providing services to end users. These limitations arise from practical and theoretical considerations. The complexity of the relationship between total and component distribution system costs and the behaviors of system users has precluded the design of truly cost-reflective rates in the distribution sector. Capturing differences in which network users utilize which components of the distribution system, and capturing the costs of serving customers of different types at different locations and times would yield an impracticably large number of customer classes, subclasses, and rate schedules [5]. While the large number of users and components in the distribution system does indeed give rise to high-dimensionality and complexity that prevents
9Equity does not by itself imply that all users pay the same rate for network utilization, as it has traditionally
meant in the computation of rates for utility customer classes deemed to have similar service characteristics. Rather, it means that the same method is used to compute the rate charged for network utilization behaviors and therefore for the network charge associated with a particular agent’s network utilization.
10
The “relevant range of service provision” refers – somewhat circularly – to the spatial and demand-density range over which economies of scale exist. That is, within a given distribution service area, economies of scale exist in that it is lower cost for one DSO to serve end users than multiple DSOs. However, across a larger geographic scope, the cost of distribution increases roughly linearly with area and load. The boundaries of the geographic area over which economies of scale exist establish the sensible boundaries of the distribution territories within which to grant natural monopoly status to a DSO.
the exact translation of network cost allocation techniques utilized in the transmission system, for example, it does not prevent in improvement in the granularity with which network costs are attributed to network users. The utilization of profiles to characterize every user in the distribution system relies upon the profile itself revealing the cost causation of each customer. This obviates the need to group customers into classes, determine the cost causality of different classes and subclasses, and design separate rate schedules for each customer class. The complexity of network use profiles is bounded by their restriction to the primary cost drivers. It is assumed that the full cost of the distribution network can be accounted for through the costs of each of the primary cost drivers. Less significant cost drivers may indeed be overlooked, but the primary drivers reflect the largest, most stable cost relations.
The volatility of high cost-reflectivity is another key consideration in the design of sound electricity rates. In order for DNUoS charges to serve as effective price signals to network users, users must have some ability to predict how their network utilization will impact their DNUoS charges so that they may reshape their profiles to achieve some alteration in their charges [5]. While volatility is a characteristic of energy charges, which in some power systems are computed as often as every 5 minutes, the economic signals that inform consumers how changes in their profiles may change future network costs are far more stable, and do not raise concerns of DNUoS charges that are too volatile for customer acceptance or reaction.
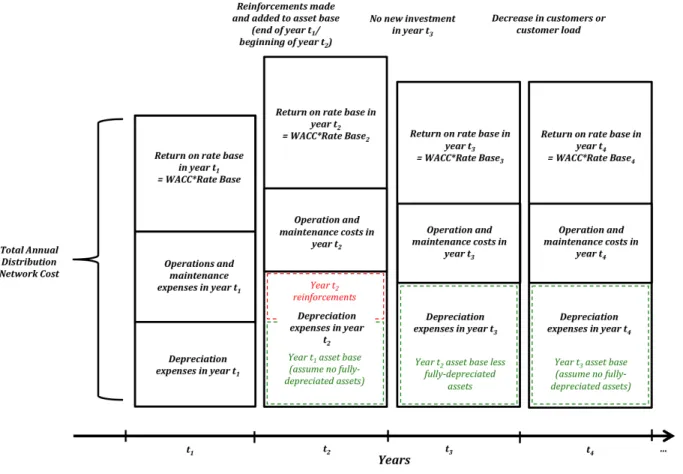
All components of DSO costs – that is, O&M expenses, depreciation expense, and return on the rate base – change in response to changes in the rate base. If reinforcements are made to existing assets, or new assets are added to the rate base, all three components of the DSO costs and recoverable revenue will grow. If no new investments are made, the rate base may stay the same size or shrink as existing assets reach the end of their lives and are depreciated fully. Figure 7 shows how the total distribution cost to be allocated amongst network users may change with changes in the network asset base.
Figure 7 reveals a critical feature of distribution network costs. Regardless of how network use changes from some year ti to the next year ti+1, since the existing asset base does not change unless
assets are fully-depreciated, the costs that the distribution utility must recover are virtually fixed in the short run, or the time frame within which some inputs – such as capital investments – are taken as fixed. In contrast, in the long run, all costs can be varied [35].
Over the long run, as network use changes, the investment needed for network upgrades, repairs, or reinforcements also change. As such, the fixed sum to be allocated across network users in the long run will change. For example, if users lower their capacity requirements by reducing their contributions to system peak power flows, the network capacity does not dynamically shrink in the short run. What does change is the amount of reinforcements and network expansion that may be necessary in the long run. The overall size and costs of the network decline in the long run, which means that the DSO’s rate base will shrink, and each network user will pay a lower network charge. Tension — in the form of “utility death spiral” adverse selection — may arise if the pace at which network users change their utilization profiles does not match the rate at which existing network assets are depreciated. The distribution utility may face the challenge of allocating the costs of stranded assets if network utilization declines faster than current network assets are fully depreciated.
The challenge of DNUoS charge design is determining how to allocate and recover costs that are static in the short-run (and dynamic in the long-run) in the face of dynamic network profiles, while simultaneously allocating costs as closely as possible according to cost causality. The aim of
Figure 7: How the cost components to be collected through DNUoS charges can evolve over time
well-designed DNUoS charges is to send price signals to network users that a) encourage efficient utilization of the existing network, and b) reflect how changes in network utilization impact network costs so as to enable evolution towards a distribution system well-adapted to network user demands. For example, ideally, DNUoS charges can provide price signals to guide the optimal installation and operation of DER by appropriately rewarding and penalizing network users for the costs and benefits offered to the distribution network. However, the primary price signals upon which network users will make decisions to install DER or not will likely be the energy charges — i.e. generation-related charges — that they can avoid through the use of DER such as solar PV and/or storage. The rate at which network utilization patterns may lead to complete disconnection from the grid is unlikely to significantly impact the recovery of costs of existing network assets, but will certainly need to be considered in the long-term planning of distribution networks. Thus, the primary goal of the method described here is allocating and recovering the costs of the existing distribution network assets, with a keen awareness of the potential growth and impacts of DER integration in long-term distribution planning. The DNUoS charge can serve as a price signal to shape decisions about the operation of installed DER by reapportioning network users’ shares of distribution costs according to changes in user profiles to indicate to customers how their impact on network cost drivers impacts their share of effectively-fixed total network costs.
Because of the discrete nature, or lumpiness, of network investments and the nonlinear relationship between network utilization and network costs, it is difficult to associate the marginal cost of future network reinforcements with individual network user behaviors. For example, the marginal cost
of serving an additional unit of utilization of the distribution network along a particular feeder may be very small or even zero when the relevant distribution feeder and source substation and transformers have excess capacity. However, when the thermal capacity of the line is reached, for example, then the marginal cost of serving an additional unit of utilization amounts to the cost of reconductoring existing lines or installing an additional line.
In [27], the authors design a long run marginal cost (LRMC) approach to allocate the costs of network reinforcements and long run network developments by evaluating the impact of nodal injections on: circuit power flow, the length of time until a reinforcement is needed, and the present value of future reinforcements. This LRMC approach provides an accurate assessment of the impact that small changes in network injection can have on network costs, although it may result in revenue for the network company that differs significantly from the total network cost. Rather than taking a marginal cost approach, the framework proposed here relies upon identifying users’ contributions to the cost drivers underlying distribution network development and thus their share of total distribution costs. The allocation of network costs to network zones and to users according to their profiles avoids the drawbacks of flat, average cost allocation and recognizes the varying impacts that additional units of a particular network cost driver can have on network costs. The use of zonal instead of nodal price differentiation aims to achieve cost causality while recognizing that differing incremental costs associated with network utilization may arise from planning decisions not made by individual network users. Additional measures of distribution network charge socialization may be employed by the regulator, as explained in subsequent sections. The central goal of the approach to network charge design proposed here is ensuring total network cost recovery in a manner that allocates costs according to cost causality. This approach relies upon allocating the incremental costs associated with network cost drivers to network users based on a weighted average computed through users’ contributions to drivers. As mentioned previously, this approach is a blend of incremental and average cost approaches.
3
An updated framework for network use-of-system charge
de-sign
In P´erez-Arriaga et al. [46], the authors outline a new framework for DNUoS charge design. The framework proposes allocation of distribution network costs according to network users’ profiles. A user, defined at a point of connection or point of common coupling to the LV, MV, or HV distribution network, has a profile, or a collection of values, of cost driver variables, the key factors that drive the total cost of the distribution network [50]. (See below for examples of cost drivers). A profile encapsulates all the information necessary to determine each grid user’s contribution to network costs. The values of the variables defining each user’s profile establish the amount that each user pays in network charges. For example, a single network user’s profile may be comprised of that user’s location in the distribution network; power injection and withdrawal during periods of peak power flow in the local network and upstream and downstream networks, or instead, if applicable, contracted capacity to consume or produce during peak periods; energy use pattern throughout the considered time period; and possibly other characteristics that may more completely define distribution network utilization and each user’s contribution to, or cause of, network costs.
As grid users introduce DG, DR, load control and energy management systems, storage, and new loads such as electric vehicles (EVs), it is no longer possible or meaningful to continue using existing customer classifications. Moreover, network users’ activities behind the electricity meter often are — and ought to remain as far as possible — a black box to distribution utilities (see Figure 8 below). In order to ensure that tariffs are non-discriminatory, the method employed to compute DNUoS charges should be agnostic to the particular activities for which the network is used. Building user profiles based on cost drivers, and assigning charges for users according to those profiles avoids the challenges associated with having to identify network users’ specific uses of electricity. Rather, profiles permit a distribution utility to quantify grid users’ contributions to network costs without requiring detailed knowledge of which network users in a distribution utility’s service area own and charge EVs, operate battery storage units, or utilize solar panels, micro-cogeneration units, or backup diesel generators.
Figure 8: All that the distribution utility sees of a network user’s behind-the-meter activity is a user profile
As indicated before, the fundamental principle underlying the framework for DNUoS charge design is the cost causality principle. In order to apply this principle to the computation of network charges
in distribution networks with a high penetration of DER, there must be a clear understanding of the drivers of network costs, and the impacts on network costs of the presence and activity of network users — including traditional consumers and DER. Computing network users’ DNUoS charges consists of the following four steps:
1. Identify the cost drivers, or primary variables that drive the total cost of the distribution system. Once the drivers have been identified and understood, network users’ profiles can be defined.
The cost drivers are a set of magnitudes of physical quantities D = {d1, d2, d3, . . . , dN} such
as capacity requirements, energy loss–reduction requirements at each voltage level, and quality of service requirements at the aggregated network level, as well as the locations of network user connection points [52].
Identification of the cost drivers is facilitated by the use of a network-planning tool — a reference network model as mentioned above. Such a tool enables trials of changes in the composition and/or behavior of networks users — such as adding rooftop solar PV generation — and observing any resultant changes in network costs.
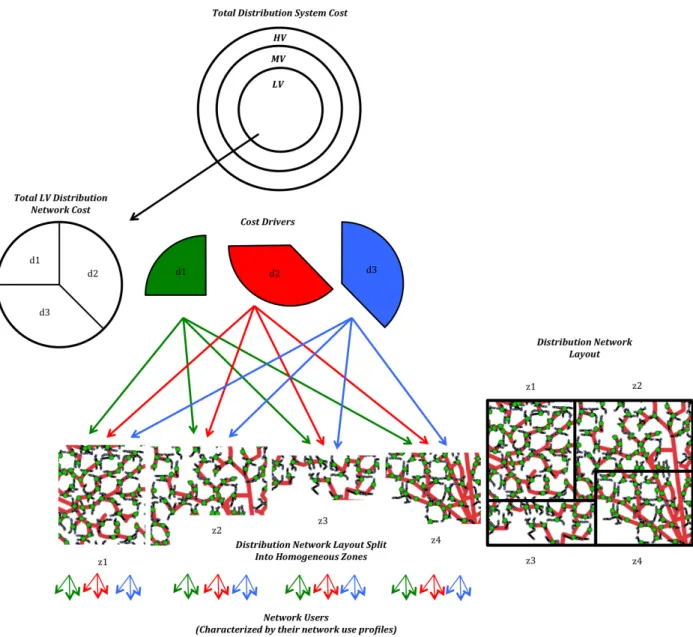
2. Determine the contribution of each cost driver to the total distribution network cost. The analysis to allocate network costs to the cost drivers is conducted independently at each network voltage level. Thus, the sum of the costs at each voltage level allocated to a given cost driver should yield the total distribution system cost due to that driver. Costs that are joint and common to multiple voltage levels are considered in the next step, in which costs are allocated to network users.
If appropriate, the total cost associated with each cost driver at each voltage level is allo-cated amongst homogeneous network zones (hereafter referred to simply as zones). A zone is defined as a section of the distribution system such that every additional unit of each cost driver has the same impact on total network costs. A secondary distribution feeder may be the natural functional unit that qualifies as a zone, and is used as the definition of a zone throughout the remainder of this thesis, since different feeders experience different peaks (magnitude and timing) which are often measured and recorded by DSOs, they exhibit dif-ferences in the magnitude of losses, they differ by length and therefore outage frequency, but the location of users along a given feeder is often arbitrary. In current practice, distribution utilities separately estimate primary and secondary distribution costs [47], and they assess the hosting capacity of distributed generation at the secondary feeder level on the basis of what percent of total secondary distribution network load the distributed generation makes up [49]. Feeder circuits are often designed so that the load or utilization of each section of the feeder sums to a specified utilization of the total feeder capacity; as such, for very long feeders that extend multiple miles, it may make sense to further subdivide the feeder into sections and carry out cost allocation to those sections [63].11 The motivation for defining network zones and allocating costs to zones — rather than computing individual shares of total network costs according to minute differences between all users’ profiles — lies in the
11
A zone may be defined as any unit of the distribution system other than a feeder, as there are multiple con-siderations in the characterization of a homogenous network zone. These may be technical, political, or economic characteristics. Zones may be defined more narrowly in order to communicate locational signals for the operation of DG along sections of a feeder. As previously indicated, network charges may have to be applied to new distributed generation located in non-favorable sites in the network. For example, generation along a branch of a feeder may require network reinforcements even without yielding a detectable injection peak in the feeder.
recognition that there are certain components of the total distribution network cost that are better allocated by grouping customers and then distributing the component cost amongst members of that group. Again, the key network user groupings are: allocating costs to drivers separately in the LV, MV, and HV networks, and allocating the costs at each voltage level to network zones such as feeders.
The total distribution network cost is the sum of the costs contributed by all cost drivers at all voltage levels. At the LV, MV, and HV levels, this step is comprised of two parts: a) dividing each voltage level’s total network cost between the cost drivers, and b) dividing the total cost associated with each cost driver at each voltage level amongst network zones. A network–planning tool is central to identifying network zones and the share of network costs allocated to each zone.
3. Compute each network user’s DNUoS charge. Determine each user’s share of the total cost associated with each driver in the user’s network zone. The user’s share of the total cost associated with each driver is determined by the user’s profile. The final DNUoS charge is the sum of the charges assigned for each driver.
Each network user i will have a profile consisting of individual values of the N cost driver variables Di= {d1i, d2i, d3i, . . . , dN i} = {dni}. Each network user’s share of czn, the total cost
associated with driver dn in network zone z, is sizn. The value of sizn is determined by the
user’s network utilization profile.
User i distribution network charge = P
Cost Drivers dn∈D
czn∗ sizn
where sizn = 0 for those cost drivers to which network user i has no contribution.
4. Choose an adequate format for presenting the final distribution network charge on network users’ electricity bills.
Traditional formats such as $/kW or $/kWh rates would no longer provide efficient signals for network users since each user’s charge is first based upon cost allocation to network zones and then to individual users. Presenting a large range of time- and zone-specific rates could lead to confusion amongst network users. Presentation of DNUoS charges as lump monthly charges, perhaps listed by cost driver, provides a transparent and understandable billing format. Figure 9 graphically outlines the cost allocation process. Each step is explained in greater detail in the remainder of this section.
Figure 9: Cost allocation involves first splitting the total network cost at each voltage level into the costs associated with each driver, then splitting the cost associated with each driver across network zones, and finally allocating the costs of each driver within each zone to network users based on their profiles

![Figure 4: Layout of a typical electricity distribution system. Image source: [23]](https://thumb-eu.123doks.com/thumbv2/123doknet/14751935.580600/18.918.126.803.98.587/figure-layout-typical-electricity-distribution-image-source.webp)