HAL Id: hal-00304664
https://hal.archives-ouvertes.fr/hal-00304664
Submitted on 1 Jan 2002HAL is a multi-disciplinary open access archive for the deposit and dissemination of sci-entific research documents, whether they are pub-lished or not. The documents may come from teaching and research institutions in France or abroad, or from public or private research centers.
L’archive ouverte pluridisciplinaire HAL, est destinée au dépôt et à la diffusion de documents scientifiques de niveau recherche, publiés ou non, émanant des établissements d’enseignement et de recherche français ou étrangers, des laboratoires publics ou privés.
of the INCA model
R. Skeffington
To cite this version:
R. Skeffington. European nitrogen policies, nitrate in rivers and the use of the INCA model. Hydrology and Earth System Sciences Discussions, European Geosciences Union, 2002, 6 (3), pp.315-324. �hal-00304664�
European nitrogen policies, nitrate in rivers and the use of the INCA model Hydrology and Earth System Sciences, 6(3), 315–324 (2002) © EGS
European nitrogen policies, nitrate in rivers and the use of the
INCA model
Richard Skeffington
Aquatic Environments Research Group, Dept of Geography, University of Reading, PO Box 227, Reading RG6 6AB, UK Email: Richard.skeffington@virgin.net
Abstract
This paper is concerned with nitrogen inputs to European catchments, how they are likely to change in future, and the implications for the INCA model. National N budgets show that the fifteen countries currently in the European Union (the EU-15 countries) probably have positive N balances – that is, N inputs exceed outputs. The major sources are atmospheric deposition, fertilisers and animal feed, the relative importance of which varies between countries. The magnitude of the fluxes which determine the transport and retention of N in catchments is also very variable in both space and time. The most important of these fluxes are parameterised directly or indirectly in the INCA Model, though it is doubtful whether the present version of the model is flexible enough to encompass short-term (daily) variations in inputs or longer-term (decadal) changes in soil parameters. As an aid to predicting future changes in deposition, international legislation relating to atmospheric N inputs and nitrate in rivers is reviewed briefly. Atmospheric N deposition and fertiliser use are likely to decrease over the next 10 years, but probably not sufficiently to balance national N budgets.
Keywords: nitrogen deposition, nitrogen fertilisers, nitrogen budgets, nitrogen balance, nitrate leaching, INCA Model, environmental
legislation, EU directives, air pollution, water pollution
Introduction
The INCA Model is concerned with the prediction of inorganic nitrogen concentrations and fluxes in rivers. These predictions are performed by calculating contributions from various environmental fluxes and processes. The input fluxes which the model takes into account (see Wade et al., 2002) are: atmospheric deposition of ammonium and nitrate (wet and dry); ammonium and nitrate fertiliser applications; mineralisation of organic matter (to form NH4+) and
nitrification (to form NO3–); and nitrogen fixation. From
these are subtracted various output fluxes (plant uptake; immobilisation and denitrification) before the amount available for stream output is calculated. These inputs and outputs are differentiated by landscape type and varied according to environmental conditions (soil moisture, temperature etc.). The latest version of the model (1.6.1) accounts for stocks of nitrate and ammonium in the soil water and groundwater pools, and in stream reaches (Wade et al., 2002). It does not, however, account for the stocks of total N in soil or vegetation, or changes in the reactivity of those stocks.
In this paper, potential N inputs to European catchments are discussed and the implications for INCA as a predictive model are considered. As a contribution to deciding how inputs may change in future, some European legislation which will affect future N inputs is outlined, and some of the pressures which may lead to change are reviewed.
Sources of nitrogen input
The sources and magnitudes of N inputs will vary with the nature of individual catchments. Atmospheric deposition may be the only significant input to a forested catchment but a relatively unimportant contributor to an agricultural catchment. National nitrogen budget calculations may be some guide to the importance of various N sources. In 1997, atmospheric N deposition on the EU-15 countries was about 3.56 M tonne N (EMEP, 2001) and only about 0.39 M tonne of this nitrogen originated outside the EU. In contrast, the EU exported 2.3 M tonne N via the atmosphere. Inorganic N fertiliser consumption was considerably higher than atmospheric deposition at 9.66 M tonne (FAO, 2000). A
substantial amount of N was also imported in animal feedstuffs — about 2 M tonne N according to Slak et al. (1998), who also estimated the total N imported into the EU for agricultural purposes (excluding fertiliser) as at least 3.45 M tonne N. To this should be added the N in food imported for human consumption, for which Europe-wide estimates are not available, and sundry other fluxes, such as biological N fixation and N inputs from sea fish. Some of the N in atmospheric deposition may of course be derived from the other inputs.
This aggregated picture hides many differences between countries. For instance, Finland imported only 9 tonne of vegetable products for animal feed in 1997, whereas the Netherlands imported 366,000 tonne (FAO, 2000). Slak et al. (1998) estimated that, even without considering inputs from fertilisers or atmospheric deposition, most Member States have a positive N balance — i.e. there is N accumulation somewhere in the system. More complete N balances are available only for individual countries, notably the Netherlands (van Eerdt and Fong, 1998). Figure 1 shows a modified “soil surface” balance for agricultural land in the Netherlands. Some interesting points relevant to INCA emerge:
z The major input fluxes of N for agricultural systems in
the Netherlands are animal feed, fertilisers and atmospheric deposition, in that order.
z The balance is incomplete in that it does not show losses
to ground- and surface water, denitrification etc., but, nevertheless, an N surplus is probably accumulating in the soil.
z Not shown in the figure are food consumption by
humans (48 kg N ha–1 yr–1) and waste from food
processing (12 kg N ha–1 yr–1), expressed as in the figure
with respect to the area of agricultural land. These fluxes presumably arrive directly in the sewage/waste treatment systems.
To what extent does INCA capture the major relevant parameters in this intensive livestock agricultural system? Of the inputs, fertiliser addition, atmospheric deposition and nitrogen fixation are explicit input parameters in the model. The largest input, animal feed, is not represented directly, but could be simulated by manipulating the mineralisation and nitrification parameters, or possibly by treating it as part of the inorganic fertiliser input. The remaining input flux “other” comprises seeds, crop residues, sewage sludge, compost from urban areas and pesticides — organic N fertilisers in effect. Inputs of N to surface waters via human consumption of food can be parameterised via the “urban” land use group (as “fertiliser”). INCA thus appears to parameterise the major nitrogen fluxes relevant to nitrate in surface waters in this system. Two further problems are apparent in Fig. 1. The first is how to treat inputs of manure.
Fig. 1. Mean nitrogen fluxes for agricultural land in The Netherlands, 1995, from Table 2 in van Eerdt and Fong
(1998). Units are kg N ha-1 yr-1. Emissions on the figure are of ammonia only – there will also be NO
x emissions and deposition to non-agricultural land (represented by the conifers).
199 Deposition 31 Excretion 326 Emissions 54 15 39 Nitrogen fixation 6.5 “Soil” N Gain 285 162 Feed 449 ? Units: kgN ha-1yr-1
van Eerdt & Fong (1998)
Other 12 23 + NOx 16 74 Fertiliser 25 Crops Meat Export Non-agricultural land
European nitrogen policies, nitrate in rivers and the use of the INCA model
Manure could be treated as though it was part of the soil organic N, though in reality manure will decompose more readily. The daily timestep of the model makes this a relevant consideration, because manure inputs are likely to be seasonal for two reasons: legal restrictions on manure spreading, which in many countries can only be done at certain times of year; and the fact that livestock themselves are kept indoors in winter in colder climates. Alternatively, manure inputs could be treated as part of the inorganic fertiliser input, which would allow time of deposition to be incorporated but would effectively assume instantaneous decomposition. The second problem is that the positive N balance for EU countries implies N accumulation somewhere in the system, probably the soil. This means that mineralisation rates from soil organic matter will probably increase over time, but there is no scope for altering this in INCA except by altering the mineralisation rates manually. Thus INCA will need further development if it is to be used for long-term predictions.
Nitrogen emissions and deposition
REDUCED NITROGEN
Combined nitrogen is emitted to the atmosphere in both oxidised and reduced forms. Reduced N is emitted mostly as ammonia (NH3) – other forms of reduced N are sometimes mentioned but never quantified. The source is overwhelmingly agriculture, which accounted for 93% in 1997 in the EU-15 countries (Fig. 2). The only other significant contributors are production processes (2.5%), waste treatment and disposal (1.9%) and road transport (1.5%). The latter is due to small amounts of NH3 produced
by catalytic converters fitted to exhausts and is rising as catalytic converters penetrate the car fleet (it was 0.3% in 1990). Ammonia emissions are essentially calculated from numbers of livestock with some allowance made for agricultural practice. The figures are highly uncertain and tend to be revised annually. Figure 3 shows official estimates of emissions of ammonia over time for most European countries — i.e. the EU-15 countries plus Norway, Iceland, Switzerland, Bulgaria, Croatia, the Czech Republic, Estonia, Hungary, Latvia, Lithuania, Poland, Romania, the Slovak Republic and Slovenia. Ammonia emissions declined in the early 1990s both in the EU and Europe as a whole. In the EU the decline is partly due to technical measures to reduce emissions, such as the changes in manure spreading practices which are implemented in certain countries, notably the Netherlands. In Europe as a whole the decline is due largely to reducing livestock numbers in Eastern Europe after the fall of Communism. Fewer livestock probably do mean less ammonia emission, but quantification of the effects of technical emission reduction measures is debatable.
Nitrogen in reduced form deposits readily, both as NH3 and in the form of particulate sulphates and nitrates. Hence, reduced N deposition to catchments is affected strongly by the proximity of local sources. Reduced N budgets for individual countries tend to be closer to balance than for
Fig. 2. Major sources of ammonia in the European Union, 1997.
Data from the European Environment Agency, http://www.eea.eu.int/ . 0 1000 2000 3000 4000 5000 6000 1980 1985 1990 1995 2000 2005 2010 Year NO x Emission (ktonne N) Gothenburg Protocol EU-15 Total ECD -original
Fig. 3. Annual ammonia emissions from the EU-15 countries and EU
aspirant countries as defined in the text. The figures for 2010 are agreed national emissions in the Gothenburg Protocol, and for the original Emission Ceilings Directive, H1 Scenario (see Table 1). National emissions from the agreed Emission Ceilings Directive are not sufficiently different from those of the Gothenburg Protocol to show on the figure. Data from the European Environment Agency, http://www.eea.eu.int/. Other 1% Waste treatment 2% Production processes 3% Road transport 2% Agriculture 92%
oxidised N. Figure 4 shows oxidised and reduced N emissions and deposition for 1997, as calculated by the EMEP (European Monitoring and Evaluation Programme) Eulerian model (EMEP, 2001). The proportion of reduced nitrogen exported from the EU is clearly less than that of oxidised N, though there is still a net export. Only countries on the Eastern side of the EU (Austria, Finland, Sweden) receive more reduced N than they emit. Detailed studies of the N budget of the UK (e.g. Fowler et al., 1998) conflict somewhat with these model predictions and indicate a much closer balance between emissions and deposition (88% of UK emissions deposited on the UK, compared to 51% as calculated by EMEP). In 1997, the EMEP Eulerian model was being used to calculate official transboundary fluxes for the first time, and these of course vary somewhat between years: nevertheless this discrepancy probably is an indication of the uncertainties in the calculations even of well-established models.
OXIDISED NITROGEN
Oxidised nitrogen is emitted in the form of nitric oxide (NO), nitrogen dioxide (NO2) and nitrous oxide (N2O). Anthropogenic emissions of N2O in Europe are about 10% of those of the other two oxides (Olivier et al., 1998) but it deposits to surfaces very slowly and hence is not a significant contributor to input budgets. Most emissions are in the form of NO, but this largely oxidises in the atmosphere to NO2, so the two are normally considered together as NOx.
Emissions of NOx come from a more diverse set of sectors than NH3 (Fig. 5) and are dominated by road transport (48%) and other mobile sources and machinery (16%). Emissions from combustion sources for power generation contribute around 17% of the total (down from 26% in 1980 due to combustion modification in the form of low-NOx burners and to end-of-pipe controls in some countries). The absolute amount of NOx emitted peaked in 1989 and has declined somewhat since (Fig. 6) due to increasing penetration of
Fig. 4. Emissions and deposition of NOx and NH3 in 1997 according to the EMEP Eulerian Model (EMEP, 2000)
Fig. 5. Major sources of NOx in the European Union, 1997. Data from the European Environment Agency, http://www.eea.eu.int/
Energy industries 17% Combustion: non-industrial 6% Combustion: industrial 11% Production processes 2% Road transport 47% Other mobile sources 16% Other 1% 0 500 1000 1500 2000 2500 3000 ktonne N yr -1 UK Sweden Spain Portugal Netherl. Luxembg Italy Ireland Greece Germany France Finland Denmark Belgium Austria Emissions NH3 NOx Emissions Deposition Deposition
European nitrogen policies, nitrate in rivers and the use of the INCA model
catalytic converters into the car fleet and stricter emission limits on heavy vehicles more than offsetting the growth of road transport, as well as controls on large combustion plant. Emission calculations are based on models, and hence are subject to some uncertainty, but the oxidised N budget is thought to be known more accurately than that of reduced N (Fowler et al., 1998).
Oxidised N in general does not deposit as readily as reduced N, and hence a lower proportion of EU emissions is deposited within the EU (Fig. 4). Only Sweden and Austria are net importers of oxidised N. The different species of oxidised N deposit at widely varying rates: NO fairly slowly; NO2 more readily, especially to internal plant surfaces when the stomata are open; other N species such as nitric acid vapour deposit very efficiently to all surfaces. Oxidised N deposition is thus a complex function of atmospheric chemistry and environmental conditions.
PARAMETERISATION OF DEPOSITION IN INCA
INCA inputs wet deposited nitrate and ammonium to the soil water on a daily basis. Dry deposited oxidised and reduced N is accumulated until it rains and then is added to the soil water as nitrate or ammonium. Chemical considerations (e.g. Lindsay, 1979) suggest these assumptions are reasonable. The N particulates consist of common nitrate and ammonium salts which are all highly soluble; NOx dissolves to form a mixture of nitrates and nitrites, but the latter oxidise rapidly under environmental
conditions. The only exception is the deposition of NH3 in more alkaline environments, where formation of NH4+ will
be inhibited progressively if the ambient pH is greater than about 8.2. At these pH values, some re-volatilisation of ammonia may occur: such a flux is not currently parameterised in INCA.
Future trends: environmental
legislation
Concerns about various environmental problems, especially acidification and eutrophication, have led to legislation to curb nitrogen emissions to the atmosphere. Legislation is also in place to protect water quality in rivers, and to restrict pollutant transport via rivers into the seas around Europe. A study of environmental legislation is valuable in predicting future trends in the nitrogen status of catchments for three reasons. Firstly, the legislation is designed to limit and reduce reactive N concentrations and fluxes, normally with a target date at some time in the future, so there is a quantitative prediction of future N depositions or concentrations. Secondly, a study of how the standards embodied in the legislation were negotiated can reveal pressures which will be brought to bear again when the legislation is revised. Thirdly, the question of whether the legislation will be sufficient to alleviate the perceived environmental effects can be considered. In the next two sections, the legislation which will affect the N status of European ecosystems is described briefly and evaluated.
In the EU, legislation takes the form of Council Directives, which are addressed to, and are binding on, Member States only. Their implementation and enforcement is up to the individual Member State, and this varies a lot within the EU. Although most countries now transpose EU Directives into national legislation by the due date (the slowest being Greece with 92%), the European Commission (EC) also monitors their practical implementation, and is engaged in constant dialogue and disputes with Member States about this.
In the next section, the most relevant EU Directives are outlined, first for emission to air and then to water. This is believed correct as of September 2001, but EU legislation is complex and intertwined, and other relevant legislation may have a significant impact. National legislation may also mandate lower total emissions than the relevant EU Directive, although in some cases this is not allowable.
EU Directives
The National Emission Ceilings Directive sets limits on national emissions of NOx and NH3 (also SO2 and VOCs)
0 1000 2000 3000 4000 5000 6000 1980 1985 1990 1995 2000 2005 2010 Year NO x Emission (ktonne N) Gothenburg Protocol EU-15 Total ECD -original
Fig. 6. Annual NOx emissions from the EU-15 countries and EU aspirant countries as defined in the text. The figures for 2010 are agreed national emissions in the Gothenburg Protocol, and for the original Emission Ceilings Directive, H1 Scenario (see Table 1). National emissions from the agreed Emission Ceilings Directive are not sufficiently different from those of the Gothenburg Protocol to show on the figure. Data from the European Environment Agency, http://www.eea.eu.int/.
for the year 2010. It was proposed formally by the European Commission on 29 February 2000 (see references). After some negotiation, a “Common Position” was reached on 22 June 2000, with somewhat modified emission limits. The Common Position indicated broad agreement on the legislation by the governments of Member States. However, after some effective lobbying by environmental pressure groups, the European Parliament decided in March 2001 that it wanted stricter emission control. Nine amendments were proposed: among other outcomes these would have re-instated the emissions based on the “H1 Scenario”, originally developed to meet a set of objectives related to critical load exceedance by the year 2010. The “Common Position” and “H1” Scenarios are shown in Table 1. In reply, the Commission accepted one amendment and partially accepted another two (mostly dealing with emissions from shipping) but rejected the others. It refused to tighten the
emission limits on the grounds that they would be reviewed in 2004 and 2008 in any case, and that uncertainties prevented some Member States from agreeing to the original limits. This is a clear signal that the Commission will try to re-instate the original limits at these reviews. The text of the Directive was finally agreed on 20 September 2001.
The Large Combustion Plant Directive also sets national emission limits, this time for combustion plant of 50MW thermal or above. It also sets a concentration limit for stack emissions. This Directive will repeal the existing Large Combustion Plant Directive 88/609/EEC. The detailed provisions are complex and depend on the size of the plant, when it was licensed and what fuels it uses. As with the National Emission Ceilings Directive, the European Parliament decided in March 2001 that the Directive was not stringent enough, particularly with regard to existing plant, and proposed 18 amendments. In this case, the Table 1. Nitrogen Emissions According to Various Pieces of Legislation in the EU and UNECE Countries
NOx (k tonne N) Ammonia (k tonne N)
1990 GOTH ECD (H1) ECD 1990 GOTH ECD (H1) ECD
Austria 58 33 28 31 63 54 55 54 Belgium 107 55 39 54 80 61 47 61 Denmark 83 39 39 39 63 57 58 57 Finland 84 52 46 52 33 26 26 26 France 568 262 207 247 663 642 591 642 Germany 810 329 320 320 623 453 340 453 Greece 105 105 80 105 66 60 61 60 Ireland 34 20 18 20 105 96 101 96 Italy 620 304 264 301 380 345 354 345 Luxembourg 7 3 2 3 6 6 6 6 Netherlands 165 81 72 79 192 105 86 105 Portugal 63 79 44 76 58 89 55 74 Spain 354 258 238 258 290 291 291 291 Sweden 103 45 46 45 50 47 40 47 UK 864 359 359 355 271 245 217 245 EU-15 4025 2023 1803 1984 2944 2576 2328 2561 Non-EU 3095 2230 12230 12230 3278 2595 12595 12595 Total 7121 4253 14033 14214 6224 5171 14923 15156
1Calculated by assuming that emissions of the non-EU countries remain at values mandated by the Gothenburg Protocol.
Values were originally expressed as NO2 or NH3: converted and rounded to nearest ktonne N. 1990: Emissions in 1990 (Source: Amman et al., 1999)
GOTH: Emissions agreed in the Gothenburg Protocol of UNECE (Source: UNECE Website http://www.unece.org) ECD (H1): Emission Ceilings Directive Optimised Scenario H1 (Source: Amman et al., 1999).
European nitrogen policies, nitrate in rivers and the use of the INCA model
Commission accepted 10 of the amendments, and agreed to a tightening of NOx emission standards for larger plant. Individual large combustion plants rarely contribute a high percentage of N deposition to individual catchments, owing to the long mean transport distance of NOx; thus the Directives which apply to overall national emissions are somewhat more relevant in predicting the future course of N deposition. The text of the Directive was finally agreed on 20 September 2001.
The Air Quality Framework Directive 96/62/EC provides a framework for setting limits for atmospheric concentrations of various pollutants including NOx (but not NH3). This is achieved through Daughter Directives, the relevant one in the present context being 1999/30/EC which deals with SO2, NO2, NOx, particulate matter and lead. There are separate standards for NOx and NO2 with the former referring to vegetation and the latter to human health. If standards are exceeded then an action plan for reduction has to be produced so that these Directives may affect local areas independently of national emission ceilings. The NOx standards are, however, more likely to be exceeded in urban agglomerations than in rural areas.
Another relevant Directive is the Ozone Directive (2002/ 3/EC), which replaced an older Directive with the same name (92/72/EEC). The new directive will require NOx (as an ozone precursor) to be monitored and perhaps controlled. Where O3 concentrations exceed target values, which they currently do in many places, Member States have to produce a plan for reducing them. This will not be an easy task owing to the complex non-linear chemistry of O3 formation and the extensive long-range transport of both O3 and its precursors. Thus, small reductions in NOx emissions in the UK and other western countries are likely to increase O3 concentrations in central Europe, while NOx reductions in central Europe will decrease them (e.g. Grennfelt et al., 1994). Nevertheless, this requirement is likely to put significant downward pressure on NOx emissions in future years.
Another directive which may have significant effects is the Integrated Pollution Prevention and Control Directive (96/61/EC). This is designed to control pollution from major processes through a permitting system, and to prevent pollution control measures merely shifting pollution to a different environmental medium (e.g. air to water). It covers major industrial processes, but not agriculture except for some large animal rearing units.
The directive of most obvious direct relevance to surface water quality in the present context is the Nitrates Directive (91/676/EEC). This has the aim of reducing water pollution caused by nitrates from agricultural sources. In order to do so Member States had to identify waters affected by nitrate
pollution or which may be affected in the near future if action is not taken. The criteria for identification were either a concentration of nitrate above 50 mg l–1 in surface- or
ground-water, or eutrophication, or a water which may become one of these in the near future. The agricultural areas which drained into these waters had to be designated as nitrate vulnerable zones (NVZs). There are currently 600 000 ha of NVZs in England and Wales (Goulding, 2000). In contrast, Austria, Germany, Denmark and Luxembourg designated their whole territory as a NVZ. Agricultural practice in NVZs is restricted by a range of mandatory and voluntary restrictions, mostly relating to fertiliser application and manure spreading. Many Member States proved reluctant to implement the Directive fully, and by 1997 the EC was involved in various legal proceedings against 10 of the 15 states (EC, 1997).
The nitrate standard (50 mg l–1 as nitrate) is derived from
the Drinking Water Directive (80/778/EEC amended by 98/ 83/EC), and the value of the standard itself from earlier United Nations work. Also of relevance is the Urban Waste Water Treatment Directive (91/271/EEC), which restricts inputs to “sensitive” waters, which were defined as being eutrophic or unable to meet the nitrate standard for drinking waters if they were to be used as such. This Directive had to be amended by Directive 98/15/EEC to make it more specific, and in particular to set limits to the total N (and P) concentrations permissible in the effluents from sewage treatment works (15 mg N l–1 for works serving 10,000 to
100,000 people; 10 mg N l–1 for those serving more than
100,000 people).
The most recent event of significance is the adoption of the Water Framework Directive (2000/60/EC), which is intended to have a similar role in relation to water as the Air Framework Directive has to air. Thus, it does not contain specific standards, but refers to the directives where those standards are set. The unit of regulation is the river basin district, and special arrangements are made where these cross the boundaries between Member States. At 72 pages it is unusually long for an environmental directive, reflecting the complexity of water regulation. It also lists those other directives which affect water quality and cannot be covered in this brief survey, such as the Habitats Directive, Bathing Water Directive and legislative instruments relating to the Oslo and Paris Conventions for the protection of the marine environment (OSPARCOM) which restrict N inputs to the seas around Europe.
Other international legislation
Outside the EU, the main piece of legislation affecting deposition of air pollutants is the United Nations Economic
Commission for Europe Convention on Transboundary Air Pollution of 1979. This is implemented by means of “protocols”, the latest of which is the Gothenburg Protocol of 1999. The Protocol sets out national emission ceilings in a similar fashion to the National Emission Ceilings Directive, but covers virtually all countries west of the Ural Mountains, plus the USA and Canada, which, curiously, are regarded as part of Europe for this purpose. The requirements of the Gothenburg Protocol are shown in Table 1 and in Figs. 3 and 6. For the EU countries, the Protocol set the baseline for further negotiation of emission limits. To be effective, it has to be both signed and ratified by a certain number of parties to the Convention: up to 20 August 2001, enough parties had signed but only Luxembourg had ratified. Ratification normally takes 2-5 years, but the slow pace may reflect the difficulties of getting agreement between the ministries which control industry, transport and agriculture. The Protocol has to be reviewed before 2010, and past experience suggests that limits will be tightened further. There is another important difference from EU Directives: these have the force of law, whereas the UNECE convention is a “gentleman’s agreement”, as there is no means to enforce it. There is also a water convention with a similar structure: “The Convention of the Protection and Use of Transboundary Watercourses and International Lakes”. This is intended to strengthen national measures for the protection and ecologically sound management of transboundary surface waters and groundwaters.
Future trends
Some estimate of the future trends in legislative requirements can be obtained by considering how far currently proposed legislation will influence the environmental problems it is meant to address, and the degree of political resistance to changes in emission standards. Both the Emissions Ceilings Directive and the Gothenburg Protocol were meant to be effects-based, and the effects were assessed by an elaborate procedure involving critical loads and integrated assessment modelling to produce a supposedly objective “optimum” solution to meet certain environmental targets (Amman et al., 1999). One such is the “H1” scenario shown in Table 1. This applied to the EU countries only, but the emission reductions agreed at Gothenburg fell well short of those implied by optimised scenarios applying to the whole UNECE area, though they were a considerable improvement on 1990 emissions. This indicates that further emission controls could meet with considerable political resistance. This resistance can also be seen in the negotiation of the Emission Ceilings Directive. The emissions finally agreed (Table 1, Figs. 3 and 6) were only slightly more stringent
than the Gothenburg Protocol for NOx, and identical for NH3 (except, for some reason, for Portugal). For NOx, the European Commission’s original proposal would have delivered almost 11% less emission from the EU countries than the Gothenburg Protocol — the final compromise delivered just less than 2%. For ammonia the corresponding figures were 10% and 2%. Both Directive and Protocol have to be reviewed by the middle of the decade, but this seems to indicate it will be a hard task to obtain further significant reductions.
On the aquatic side, most EU Member States were very reluctant to implement the Nitrates Directive in its full form. The extensive UK research programme on nitrates in agriculture (see Davies, 2000) concluded that some nitrate leaching is inevitable and in drier areas particularly it would be very difficult to meet tight quality standards. There is also a view that the possible beneficial effects of nitrates in water have been underestimated (see Wilson et al., 1999) based on the bacteriostatic properties of NO released in the mouth when drinking water which contains nitrates. All this indicates more political resistance to tightening standards. As the EU enlarges to include countries in a weaker economic position, political resistance is likely to increase rather than decrease.
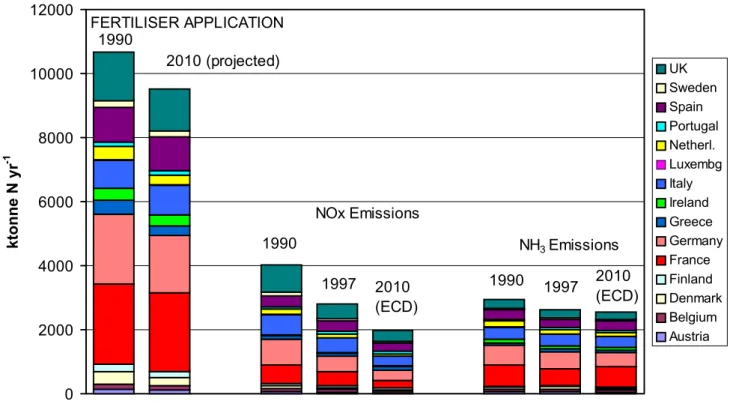
On the other hand, the partial N budgets (see above) seem to indicate a positive N balance for most EU countries. This accumulating N has to go somewhere and, whatever the mechanism or site of accumulation, an increasing amount may leak into surface waters. Declining atmospheric deposition or fertiliser use may not be sufficient to reverse this trend. Figure 7 shows that the projected reductions of fertiliser application and N emissions together amount to about 3.5 Mtonne of N between the years 1990 and 2010, or approximately 20% of the 1990 total. These legislated reductions are probably not large enough to balance the N budget, but further data are needed on this point. Thus nitrate concentrations in some surface and groundwaters may continue to increase. Because of the systematic requirements for monitoring in the Water Framework Directive and elsewhere, any increase is not likely to pass unnoticed. Thus there will be pressure for amended legislation, and tools such as INCA will continue to be needed.
Conclusions
1. Most EU Member States have positive N balances (are accumulating N) and this will probably continue to be the case even when all current legislation has been implemented.
2. Given that a proportion of the accumulated N will appear in surface waters and groundwaters, the
European nitrogen policies, nitrate in rivers and the use of the INCA model
problems of nitrate leaching and eutrophication are likely to continue.
3. These problems are likely to provide pressure to tighten legislation governing water quality and deposition of atmospheric N.
4. For the EU as a whole, atmospheric deposition is a minor contributor to the N budget, the major inputs being feedstuffs for animals, human food and fertilisers. 5. For individual catchments, however, atmospheric
deposition may be the major contributor where the land use is forestry or low-input agriculture.
6. The INCA Model should be well-placed to develop into a diagnostic tool for addressing these developments.
References
Amman, M., Bertok, I., Cofala, J., Gyarfas, F., Heyes, C., Klimont, Z., Makowski, M., Schöpp, W. and Syri, S., 1999. Cost-effective control of acidification and ground-level ozone, Seventh Interim Report to the European Commission, IIASA, Laxenburg, Austria.
Davies, E.D., Ed., 2000. Tackling nitrate from agriculture. Soil Use Manage. 16, 141–174.
EC, 1997. The implementation of Council Directive 91/676/EEC concerning the protection of waters against pollution caused by nitrates from agricultural sources. European Commission Report COM(97) 473, Brussels, Belgium.
EMEP, 2001. Source-receptor matrices and import-export budgets for 1997. http://www.emep.int/fluxes.html
FAO, 2000. Agricultural statistics. http://apps.fao.org/
Fowler, D., Sutton, M.A., Smith, R.I., Pitcairn, C.E.R., Coyle, M., Campbell, G. and Stedman, J., 1998. Regional mass budgets of oxidized and reduced nitrogen and their relative contributions to nitrogen inputs of sensitive ecosystems. Environ. Pollut., 102, SI, 337–342.
Goulding, K., 2000. Nitrate leaching from arable and horticultural land. Soil Use Manage., 16, 145–151.
Grennfelt, P., Hov, O. and Derwent, R.G., 1994. Second generation abatement strategies for NOx, NH3, SO2, and VOCs. Ambio, 23, 425–433.
Lindsay, W.L., 1979. Chemical Equilibria in Soils. Wiley, New York.
Olivier, J.G.J., Bouwman, A.F., Van der Hoek, K.W. and Berdowski, J.J.M., 1998. Global air emission inventories for anthropogenic sources of NOx, NH3 and N2O in 1990. Environ. Pollut., 102, SI, 135–148.
Slak, M.-F., Commagnac, L. and Lucas, S., 1998. Feasibility of national nitrogen balances. Environ. Pollut., 102, S1, 235-240. van Eerdt, M.M. and Fong, P.K.N., 1998. The monitoring of nitrogen surpluses from agriculture. Environ. Pollut., 102, S1, 227–233.
Wade, A.J., Durand, P., Beaujouan, V., Wessels, W., Raat, K., Whitehead, P.G., Butterfield, D. and Rankinen, K., 2002. A nitrogen model for European catchments: INCA, new model structure and equations. Hydrol. Earth Syst. Sci., 6, 559–582. Wilson, W.S., Ball, A.S., and Hinton, R.H. , Eds., 1999. Managing
risks of nitrates to humans and the environment. The Royal Society of Chemistry, Cambridge, UK.347pp.
Fig. 7. Emissions and fertiliser applications for the EU-15 countries in 1990 and 2010. Data from Amman et al., (1999)
and the Official Journal of the European Communities C375 1-11 ,2000). 0 2000 4000 6000 8000 10000 12000 ktonne N yr -1 UK Sweden Spain Portugal Netherl. Luxembg Italy Ireland Greece Germany France Finland Denmark Belgium Austria FERTILISER APPLICATION 1990 2010 (projected) NOx Emissions 1990 2010 (ECD) NH3 Emissions 1990 2010 (ECD) 1997 1997
EU Legislation
National Emission Ceilings Directive (2001/81/EC): Proposal OJ C56 E34-E39, 2000. Final version OJ L309 22-30, 2001. Ozone Directive (2002/3/EC): OJ L67 14-30, 2002. Former
Directive (92/72/EEC) OJ L297 1-7 ,1992, to be repealed September 2003.
Large Combustion Plant Directive (2001/80/EC): Final version OJ L309 1-21, 2001.
Large Combustion Plant Directive: Common Position in OJ C375 12–37, 2000.
Integrated Pollution Prevention and Control (IPPC) Directive (96/ 61/EC): OJ L257 26–40, 1996.
Air Quality Framework Directive (96/62/EC): OJ L296 55–63, 1996.
Daughter Directive covering SO2, NO2, NOx, particulate matter and lead (1999/30/EC): OJ L163 41–60, 1999.
Nitrates Directive (91/617/EEC): OJ L375 1–8, 1991.
Drinking Water Directive: standard set in 75/440/EEC, OJ L194 26–31, 1975. Replaced by 80/778/EEC, OJ L229 11–29, 1980, amended by 98/83/EC, OJ L330 32–54, 1998, but standard unchanged.
Urban Waste Water Treatment Directive (91/271/EEC): OJ L135 40-52 ,1991. Amended to clarify standards for total N and P by Directive 98/15/EEC, OJ L67 29–30, 1998.