HAL Id: hal-01865202
https://hal.archives-ouvertes.fr/hal-01865202
Submitted on 31 Aug 2018
HAL is a multi-disciplinary open access
archive for the deposit and dissemination of
sci-entific research documents, whether they are
pub-lished or not. The documents may come from
teaching and research institutions in France or
abroad, or from public or private research centers.
L’archive ouverte pluridisciplinaire HAL, est
destinée au dépôt et à la diffusion de documents
scientifiques de niveau recherche, publiés ou non,
émanant des établissements d’enseignement et de
recherche français ou étrangers, des laboratoires
publics ou privés.
Investigating the Influence of Flow Rate on Biofilm
Growth in Three Dimensions using Microimaging
Sassan Ostvar, Gabriel Iltis, Yohan Davit, Steffen Schlüter, Linnéa Andersson,
Brian D. Wood, Dorthe Wildenschild
To cite this version:
Sassan Ostvar, Gabriel Iltis, Yohan Davit, Steffen Schlüter, Linnéa Andersson, et al.. Investigating
the Influence of Flow Rate on Biofilm Growth in Three Dimensions using Microimaging. Advances in
Water Resources, Elsevier, 2018, 117, pp.1-13. �10.1016/j.advwatres.2018.03.018�. �hal-01865202�
OATAO is an open access repository that collects the work of Toulouse
researchers and makes it freely available over the web where possible
Any correspondence concerning this service should be sent
to the repository administrator:
[email protected]
This is an author’s version published in: http://oatao.univ-toulouse.fr/20615
To cite this version:
Ostvar, Sassan and Iltis, Gabriel and Davit, Yohan and
Sch¨lter, Steffen and Andersson, Linéa and Wood, Brian D.
and Wildenschild, Dorthe Investigating the Influence of Flow
Rate on Biofilm Growth in Three Dimensions using
Microimaging. (2018) Advances in Water Resources, 13.
pp. 1 - 1
3. ISSN 0309-1708
Official URL:
http://dx.doi.org/
10.1016/j.advwatres.2018.03.018
Investigating
the
influence
of
flow
rate
on
biofilm
growth
in
three
dimensions
using
microimaging
Sassan
Ostvar
a,
Gabriel
Iltis
a,
Yohan
Davit
b,
Steffen
Schlüter
c,
Linnéa
Andersson
a,
Brian
D.
Wood
a,
Dorthe
Wildenschild
a,∗a School of Chemical, Biological and Environmental Engineering, Oregon State University, Corvallis, Oregon, USA b Institut de Mécanique des Fluides de Toulouse (IMFT), Université de Toulouse, CNRS, INPT, UPS, Toulouse, France c Department of Soil Physics, Helmholtz-Centre for Environmental Research - UFZ, Halle, Germany
a
r
t
i
c
l
e
i
n
f
o
Keywords: Biofilms
Granular porous media X-ray computed microtomography Image processing
Statistical learning Fluid phase topology
a
b
s
t
r
a
c
t
WeexplorehowX-raycomputedmicrotomographycanbeusedtogeneratehighly-resolved3Dbiofilmdatasets onlengthscalesthatspanmultipleporebodies.Thedataisintegratedintoastudyoftheeffectsofflowrate onthree-dimensionalgrowthofbiofilminporousmedia.Threeflowrateswereinvestigatedinmodel packed-bedcolumns.Biofilmgrowthwasmonitoredduringan11-daygrowthperiodusingacombinationofdifferential pressureandeffluentdissolvedoxygenmeasurements.Attheendofthegrowthperiod,allcolumnswerescanned usingX-raycomputedmicrotomographyandabariumsulfate-basedcontrastagent.Theresultingimageswere preparedforquantitativeanalysisusinganovelimageprocessingworkflowthatwastailoredtothisspecific system.Thereductioninpermeabilityduetobiofilmgrowthwasstudiedusingbothtransducer-basedpressure dropmeasurementsandimage-basedcalculationsusingtheKozeny–Carmanmodel.Inaddition,asetofstructural measuresrelatedtothespatialdistributionofbiofilmswerecomputedandanalyzedforthedifferentflowrates. Wegenerallyobserved1to2ordersofmagnitudedecreaseinpermeabilityasaresultofbiocloggingforall columns(i.e,acrossflowrates).Thegreatestaveragepermeabilityandporosityreductionwasobservedforthe intermediateflowrate(4.5ml/h).Acombinationofresultsfromdifferentmeasurementsallsuggestthatbiofilm growthwasoxygenlimitedatthelowestflowrate,andaffectedbyshearstressesatthehighestflowrate.We hypothesizethattheinterplaybetweenthesetwofactorsdrivesthespatialdistributionandquantityofbiofilm growthintheclassofporousmediastudiedhere.Ourapproachopensthewaytomoresystematicstudiesof thestructure-functionrelationshipsinvolvedinbiofilmgrowthinporousmediaandtheimpactthatsuchgrowth mayhaveonphysicalpropertiessuchashydraulicconductivity.
1. Introduction
The interaction of hydrodynamics and biofilm growth in media withtortuous geometriesisof great scientificinterestbecauseof its prevalencein manynaturalandengineeredsystems(Drescheretal., 2013).Asexamples,biofilmgrowthinporousmediahasbeenboth di-rectlyobservedandindirectlyhypothesized(withsubstantial support-ingevidence) in a widevariety of natural andengineered systems. These include examples such asanaerobic reactors (e.g. Young and Dahab,1983),microbially-enhancedoilrecovery(e.g.Armstrongand Wildenschild,2012;Sen,2008),micromodelexperiments(e.g.Kimand Fogler,2000;StewartandFogler,2001),laboratoryporousmedia ex-periments(e.g.Vogtetal.,2013),andslowsandfilterbeds(e.g.Lietal., 2013).Althoughthereareongoingdiscussionsregardingtheubiquityof biofilms(BaveyeandDarnault,2017;Coyteetal.,2017),thesestudies
∗Correspondingauthor.
E-mailaddress:[email protected](D.Wildenschild).
offersignificant,andoftendirect,evidencethatbiofilmformationin porousmediaisanimportantcomponentformanyprocessesof rele-vanceandinterest.
Innaturalandsyntheticporousmedia,biofilmgrowthatthepore scaleaffectsvarioustransportprocessesbyalteringthestructureof in-terfaces,connectivityoftheporespace,andbulkgeometricproperties ofthemedium(Baveyeetal.,1998;Cunninghametal.,1991;Drescher etal.,2013;Rittmann,1993).Inturn,cellulargrowthandmesoscale structuralevolutionofbiofilmsarehighlyinterconnectedwithvarious aspectsoftransportincludingshearandmasstransfer.Non-destructive imagingofbiofilmsisessential tounderstandingthephysicsof these processesandtheirbroaderimpactsondesign,control,andprediction. Indisciplinesthatareconcernedwithnaturalporousmedia(e.g. hy-drology,petroleumengineering),theabilitytovisualizebiofilmgrowth underflowonthescaleofmillimeterstometershasbeenofgreatinterest
Nomenclature
𝜑 porosity
𝜌 fluiddensity
vs≡vz (stream-wise)superficial(Darcy)velocity
D poreradius(≡characteristiclengthscale)
𝜇 fluidviscosity Re Reynoldsnumber
Q volumetricflowrate
A cross-sectionalarea
𝜅zz stream-wisecomponentofthepermeabilitytensor
p hydrodynamicpressure
g accelerationduetogravity
K columnhydraulicconductivity Φ Hubbert’spotential(hydraulichead)
L columnlength
ΔP netpressuredifferenceacrosscolumn
𝜏 tortuosity
interfacialareatovolumeratio
𝛽 constantintheKozeny–Carmanmodel I totalnumberofevaluatedimages
N totalnumberofvoxelsevaluatedatcoordinatex Π setofallpairsofneighboringvoxels
𝑐(x) classlabelofvoxelatpointx
𝜇c,𝜆 classmeaninimage𝜆
𝜎2 classvarianceinimage𝜆 𝑔𝑖(x) grayvalueofvoxelxinimagei 𝜒 Eulercharacteristic
numberofisolatedobjectsinamaterialofinterest numberof redundant connectionswithin all material
clusters
numberofcavitiesinamaterialofinterest
d𝛼 averageporediameterinphase𝛼 e𝛼 averagedistancewithinphase𝛼
CI theconnectivityindex
PSI theporesizeindex
SDI thesoliddistanceindex
(e.g. Thullner,2010; Yarwoodet al., 2002).Visualizationis gaining evenmoresignificancewiththeincreasingcomplexityandfidelityof themathematicalandcomputationalapproachestomodeling biofilm growthin porousmedia (e.g.vonderSchulenburgetal.,2009).The challengesassociatedwithnon-intrusivevisualizationof3Dsystems of-tenforcesdirectcomparisonbetweenmodelsandexperimentstorely onbulk(aggregate)laboratoryorfieldmeasurements;i.e.evaluations onscaleswherepore-scale(structural)informationdetrimentalto trans-portislosttotheaveraginginherenttomeasurements(Thullner,2010). MagneticResonanceMicroscopy(MRM)andNuclearMagnetic Res-onanceimaging(NMR)havebeensuccessfullyappliedtoelucidatethe globalstructureofbiofilmsinporousmediaandporefluidvelocitiesin mediaalteredbymicrobialgrowth(Manzetal.,2003;Seymouretal., 2004; 2007),albeit with some resolution limitations. Confocal laser scanningmicroscopy(CLSM),andmorerecentlyopticalcoherence to-mography(OCT),havebeensuccessfullyappliedtothevisualizationof the3Dstructureofbiofilmsonsmallerscaleswithhigherresolutions (Davitetal.,2013;Dreszeretal.,2014;NeuandLawrence,2015; Wag-neretal.,2010;Xietal.,2006).Bothmethodsenabletemporalstudies ofgrowthinflowenvironments,andprovidehighlyresolved reproduc-tionsoftheinternalstructureofthebiofilmmatrix.Apopularapproach todirectvisualizationofbiofilmstructureinporousmediaatthepore scalehasbeentoadoptthesetechniquestostudygrowthinoptically transparent(Leisetal.,2005),2Dandpseudo-3Dmicro-models(e.g.
Beyenaletal.,2004;KimandFogler,2000;RodríguezandBishop,2007; Stoodleyetal.,1999).
Alimitationinextendingthismethodologytostudybiomass forma-tionin3Dporousmediaisthatexperimentalsystemsmustbeoptically transparent,smallenoughtofitontothemicroscopestage,andinthe caseofCLSM,thinenoughtofitwithinthefocalrangeofthedevice. Conversely,3Dporoussystemsareopaqueanddeep.Whetherornot theconclusionsdrawnfor2Dsystemscanbeextendedto3Disan unan-sweredquestion.Topologically,thetwoarenotequivalent(e.g., diffu-sionsin2-and3-dimensionsarefundamentallydifferent),soonewould notexpect2-dimensionalexperimentstocapturetherangeofphysical behaviors.Thus,theliterature’sprevailinganswertothisquestionseems tobenegative(e.g.seethediscussionbyBaveye,2010;Thullner,2010). X-raycomputedmicrotomography(CMT)isemergingasan alterna-tivethatenablesvisualizationofbiofilmsin3Dinopaquemedia(Davit etal., 2011;Iltis etal.,2011; WildenschildandSheppard,2013) on theporescale. Thoughstillin itsinfancy,themethodwasoriginally developedandexploredusingbothpolychromatic(Davitetal.,2011) andmonochromaticsynchrotron-basedsystems(Iltis,2013;Iltisetal., 2011).Userscanexpectvoxelresolutionsontheorderof1–2microns tobeeasilyachieved.Thetechniquereliesontheuseofcontrastagents tofacilitatetheadsorption-baseddetectionofdifferentphaseswithinan opaquesampleusingX-rays.Centraltothemethodiscreatingaphysical mechanismthat,throughtheuseofadvancedimageprocessing tech-niques,allowfordifferentiationbetweenthefluidandbiofilmphases, thenaturalattenuation(photoncross-section)ofwhicharealmost iden-tical.
Useofdifferentcontrastagents,addedtotheaqueousphase,such as silver-coated hollowmicrospheres (Iltis etal., 2011), barium sul-fatesuspensions(Davitetal.,2011;Iltis,2013),and1-chloronaphtalene (Ivankovicetal.,2017;duRoscoatetal.,2014)haveshownpromise. Similarly,addingFeSO4asacontrastagenttothebiofilmphase,and usingthefreespacepropagationofX-raystobringoutadditional re-fractiveeffects,Carrel etal.(2017)werealsoabletoimagebiofilms inopaqueporousmedia.ThelatterstudycomparedtheFeSO4tothe BaSO4methodandfounddifferencesintheamountofbiofilmimaged, withasignificantlylargeramountofbiofilmidentifiedusingtheFeSO4
method.The authorspointed out three possible reasons for the dis-crepancy;(i)partialvolumeeffects(eliminatedfromconsideration);(ii) uncertaintyrelatedtothesegmentation(causedbythesignificant het-erogeneityofthebiofilmphaseandpoorcontrastofsaidphase);and (iii)interactionbetweentheBaSO4andthebiofilm(causingsuspended biomassandlooselyattachedcomponentsofthebiofilmtobewashed outofthecolumns).
Thepotentialfordetachmentofbiofilmduringadditionofadenser andmoreviscous(aqueousphase)contrastagent hasbeendiscussed by Davit et al.(2011) and duRoscoat etal. (2014). In a thorough studyoftheproblem,Ivankovicetal.(2017)foundthatthiseffectcan be eliminatedbyusingsmallerbeads(intheircase,lessthan2mm) andbymakingmeasurementsafterlongerperiodsofbiofilmgrowth (>7days)suchthatamorecompactandtightlyattachedbiofilmwas
formed.Thisallowedforreliablestudiesonbiofilmsthatpresented sim-ilarandreproduciblespatialstructureandallowedforquantitative eval-uationofanumberofdifferentenvironmentalvariables.Intheirstudy, growthperiodsof lessthan3days,andlargerporesizes,resultedin lessresilientbiofilms(exhibitingstreamersandotherweaklyattached components)thatmaybesubjecttodetachmentshearbyamore vis-couscontrastagent(suchasBaSO4or1-chloronaphtalene).Forthe 1-chloronaphtalene(CN)anadditionalchallengewascausedbytheoily natureofthecontrastagent,whichcausedpendularringsofCNtobe leftbehindatbeadcontacts.
Theexactgrowthperiodandporesizethatwillproducerepeatable experimentswillvarysomewhatwithorganism,nutrientsupply,flow rate(allfactorscontributingtotheproductionof moreorlessdense biofilms),andtheviscosityoftheinjectedcontrastagent(ifrelevant). Thepaststudiesusingaqueousphasecontrastagentsserveas promis-ingproofoftheconceptaslongastheriskofviscousinteractionwith thebiofilmisconsideredinthedesignoftheexperiments.Whilethere
S. Ostvar et al.
is lessrisk ofdetachment usinga contrast agentin thebiofilmitself (Carreletal.,2017),theresultingweakcontrastbetweenthevarious phasesmakesreliableandobjectivequantitativeevaluationdifficult.
Inthisstudy,wepresentasystematicstudyonthecorrespondence betweenphysicalquantitiesderivedfromCTdataandphysical measure-mentsofbiofilmgrowth;suchacomparisonhasyettobereportedin theliterature.Ourdataconsistsofduplicatecolumnsgrownfor11days toensureadenseandresilientbiofilm.Theresultingimagehistograms exhibitdistinctseparationoftheintensitypeaks(indicativeofeffective phaseseparation)andweuseadvancedimageprocessingmethodsto allowforobjectivemeasurementsofanumberofbiofilmfeaturesasa functionofReynoldsnumber(Re).
Whenpossible,wecross-validatetheresultsobtainedvia microim-ageanalysiswiththoseobtainedviadirectbulkmeasurements. Numer-ousstudiesconductedonbioclogginginporousmediaundervarious conditionshavereportedsignificantreductionsinhydraulic conductiv-ity,oftenupto2–3ordersofmagnitudeormore(Bielefeldtetal.,2002; Cunninghametal.,1991;SeifertandEngesgaard,2007;Thullner,2010; VandevivereandBaveye,1992).Duemainlytolimitationsin measur-ingorimagingthespatialdistributionofbiomass,however,onlyafew reportshaveattemptedtoassociatechangesinporemorphologywith changesinhydraulicconductivityin 3D,mostlyindirectlyorvia de-structivesampling.Anumberofauthorshaveobservedthatamajority ofthebiomassandassociatedcloggingoccurredwithinthefirst sev-eralcentimetersoftheexperimentalapparatus(e.g.Seifertand Enges-gaard,2007).Othershavearguedthatbiocloggingshouldbeattributed primarilytoblockageofporethroatsbybiomassasopposedtouniform continuousfilmsonsolidsurfaces(e.g.Vandevivereetal.,1995). 2. Methods
BybuildingontheworkofDavitetal.(2011),westudyflowrates thatspanthreeordersofmagnitude(correspondingtoinitialpore-scale
Reof0.1,1.0,and10),coveringcreepingtomildlylaminarflows.We areparticularlyinterestedincharacterizingtheglobalbiofilmstructure grownunderthestipulatedflowconditionsandtracingthesevariations tobulkmeasurements.Theworkintroducesasimpleanalysisofbiofilm growthwithinopaqueporousmediabasedon3Dstructuralmeasures alongwithcorrelationto(i)bulkpressuredropmeasurementsand(ii) dissolvedoxygenconsumptiontoevaluatepotentialnutrientlimitations impartedbytheappliedflowrates.Ouranalysisreliesonanovelimage processingworkflowthataddressessomeofthelimitationsassociated withinhomogeneousdistributionofthecontrastagentintheporespace.
2.1. Modelporousmedium
Packedbeadcolumnreactorsmeasuring6.3mmindiameter,42mm inlength,witha25mmclearwindowwereconstructedof polycarbon-atetubing.Theporousmediumconsistedofsoda-limesilicaglassbeads, withparticlediameterwithintherange1.4–1.7mm,andspecific grav-ityof2.5.Atotalof6growthreactorswereusedinthisstudy,sothat therewereduplicatecolumnsexaminedateachflowrate.Initialcolumn porositiesweremeasuredgravimetricallypriortotheexperimentsand initialflowtestingwasconductedtomeasurethehydraulicconductivity ofthemodelsasdescribedbelow.
2.2. Microbialspecies
The bacterium used in this study is Shewanella oneidensisMR-1; a metal-reducingstrain originally isolatedfrom sediment from Lake Oneida in New York. S. oneidensis MR-1is a gram-negative, highly piliated, polarly flagellated, facultative anaerobe capable of dissim-ilatory metal reductionand biofilm formation (Majors et al., 2005; Venkateswaranet al., 1999).The bacterium is motile; the presence ofpiliarecriticaltoinitialadhesionandtheflagellahavebeen iden-tifiedasbeing criticalfordevelopment of effectivebiofilmstructure
(Thormannet al., 2004).The bacterium hasalso beenshown to be motileinresponsetolowoxygentensions(Thormannetal.,2005).This strainhasbeenusedsuccessfullyinprevious biofilmimagingstudies conductedbyourgroup(Iltisetal.,2011).
2.3. Growthmediaandconditions
Inoculaweregrownfromfrozenstock fortwogrowthcycles. Ini-tially,frozen stock wasthawed and0.5mLstockculture was added to30mLsterile100%(30g/L)TrypticSoyBroth(TSB).Batchcultures weregrownonanincubatedshakertableat250rpmand30°Cfor20h atwhichpointthesecondgrowthcyclewasstartedbyadding1mLof batchculturefromthefirstgrowthcycleto30mLfresh,sterile100% TSBgrowthmedia.Batchcultureswerethenincubatedforanother20h cycle.Attheconclusionofthesecondgrowthcycle,batchcultureswere centrifugedat6000rpmfor10min,thesupernatantwaspouredoff,and thecellpelletswereresuspendedin5mL100%TSB(30g/L)growth me-diaforcolumninoculation.
Allcolumngrowthreactorsandtubingweresterilizedpriorto inoc-ulationbyflushinga90%ethanolsolutionthroughthetestapparatus for30min,atwhichpointagrowthmediaflushcommencedtoensure thatallethanolwasremovedfromthesystempriortoinoculation.The sterile10%TSB-saturatedcolumnsweretheninjectedwith1mLofthe concentratedcellinoculum.A24hnoflowperiodwasallowedto pro-motebiofilmnucleation,afterwhichflowofsterileoxygenatedgrowth mediawasstartedattheprescribedflowrates.
Inoculafortheinitialgrowthperiodwerepreparedin100%(30g/L) trypticsoybroth(TSB)solutions.Themediumwasdiluteddownto10% (3g/L)fortheflowexperiments.Allgrowthmediaweresterilizedprior toinjection,andcontinuouslyaeratedusing0.22µmfilteredambient air.Aconsistentlyoxygen-saturatedinjectionwithanaverageinfluent
O2concentrationof8.05 ± 0.29(mg/L)wasmaintainedintheflow
experiments.
Threeflowratesinthecreepingandmildlylaminarregimeswere targetedforinvestigation.ThecorrespondinginitialRewere0.1,1and 10,wheretheReisevaluatedforapackedbedusing(Gunjaletal.,2005)
𝑅𝑒= 1 (1−𝜑)
𝜌 𝑣𝑠𝐷
𝜇 (1)
Here,𝜌 (g/mL)isthedensityofthefluidphase,D(cm)isacharacteristic
porelengthfortheporousmedium,takentobetheaveragegrainsize;
𝜇 (g/cm/h)isthedynamicviscosityofthefluidphase;and𝜑isthebulk porosity;andvs(cm/h)isthesuperficial(Darcy)velocitydefinedas
𝑣𝑠=
𝑄
𝐴 (2)
whereQ(mL/h)isthefluidflowrateA(cm2)isthecross-sectionalarea
withouttheporousmedium.Notethat𝜑changesduringthecourseof theexperimentssotheabovevaluesrepresentReynoldsnumbersatthe onsetofgrowth.Forthemodelsystemsusedinthisstudy,thesevalues correspondtoflowratesof4.5,45,and450(mL/h).Thesevaluesare referredtoasthelowest,intermediate,andhighestflowratesthroughout thetext.
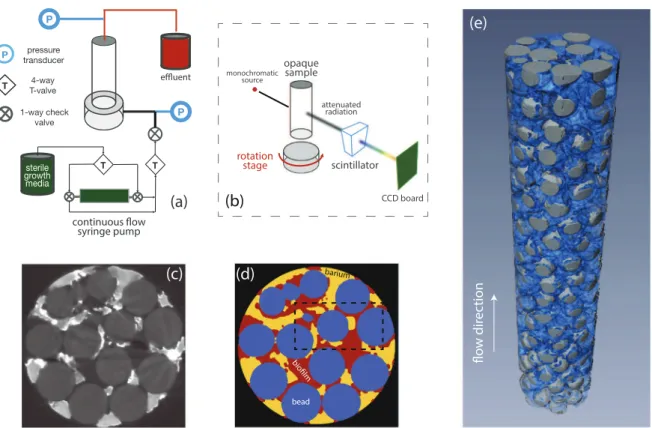
Continuousflowwasprovidedtoeach columngrowthreactor us-ingcontinuous-cyclesyringepumps.Checkvalveswereusedtoensure that flow throughthe reactor columnswas always unidirectional.A schematicoftheexperimentalsetupisprovidedinFig.1(a).Growth mediareservoirswerereplacedatapproximately36hintervals,andall influentlineswerereplacedeverytwodaystominimizebiofilmgrowth upstreamoftheexperimentalcolumns.Biofilmgrowthwasallowedto continueunderconstantflowconditionsfor11days,atwhichpointthe columnsweredisconnectedandpreparedforimaging.
2.4. Differentialpressuremeasurement
Differentialpressuretransducers(HoneywellSensingandControl, 24PCSeries, ColumbusOH,USA) wereaffixedtoeach experimental
Fig.1.Schematicforexperimentalflowapparatus(a).Schematicforsynchrotron-basedX-raymicrotomographicimagingofthe3Dopaquesamples(b).Sample cross-sectionalgrey-scaleimageofacolumnafterbiofilmgrowth(darkcirculargreyareasareglassbeads)(c).Thesamesampleaftersegmentationusingthemodified MarkovRandomFieldalgorithm(blue=glassbeads,red=biofilm,andyellow=fluid)(d).3Dreconstructionofasegmentedporousmediumafterbiofilmgrowth at𝑅𝑒=10(e)(darkgray=beads,blue=biofilm).Thedashedrectangularareain(d)isanalyzedindetailinFig.2.(Forinterpretationofthereferencestocolour inthisfigurelegend,thereaderisreferredtothewebversionofthisarticle.)
columnatthecolumnentranceandexitinordertoallowfor measure-mentofdifferentialpressureacrosseachcolumnlength.Continuous dif-ferentialpressuremeasurementswerecollectedbyanautomateddata acquisitionsystem(PersonalDAQ50,MeasurementComputingCorp., Norton,MA).
2.5. Dissolvedoxygenmeasurement
Periodicmeasurementsof dissolvedoxygen(DO)wereperformed ontheinfluentandeffluentsidesofeachcolumnforthedurationofthe biofilmgrowthphaseoftheexperiment.EffluentDOwasmeasured us-ingflow-throughoxygenmicroprobes(Model16-730,Microelectrodes Inc.,BeadfordNH,USA).InfluentDOmeasurementsweremadeusing aseparateprobe(Symphony,VWRInternational)onsamplesextracted fromthesterilemediareservoirs.Theequipmentformeasuringinfluent andeffluentdissolvedoxygenwerekeptseparateforthedurationofthe experimentinordertopreventcontamination.Dissolvedoxygenprobes werecleanedusingaTergazyme(Alconox.Inc,WhitePlainsNY,USA) proteinremovalsolutionaftereverysetofmeasurements.
2.6. Computedx-raymicrotomographyimaging
X-rayCMTimagingwasconductedattheAdvancedPhotonSource (APS)facilityatArgonneNationalLaboratoryusingbeamline13BMDat GSECARS(GeoSoilEnviroConsortiumforAdvancedRadiationSources). Immediatelypriortoimaging,samplecolumnsweredisconnectedfrom influentandeffluentlines,andinjectedwiththecontrastagentsolution. Thecontrastagentconsistedofamedicalgradebariumsulfate(BaSO4) suspension(Micropaque,Guerbet)mixedwithsterilegrowthmedia.The 1.0g/mLstocksuspensionwasdiluteddowntoausableconcentration of0.33g/mL.Thecontrastagentwasinjectedintothesamplecolumns usingasyringe pumpat arateof1.2mL/hforthe𝑅𝑒=0.1 and1.0
columns,and5mL/hforthe𝑅𝑒=10columns.Atotalof2mLofcontrast agentsolutionwasinjectedintoeachcolumn.
Theaverageporevolume priortocolumninoculationis approxi-mately0.5mL,soapproximately4porevolumesofcontrastagentwas addedtoeachcolumn.Thedilutedsolution(0.33g/mL)wasselected tobalancetheabsorptionofX-raythroughthecolumnswiththe satu-rationlimitoftheX-raydetector(CCDcamera).Interestedreadersare referredtoIltis(2013)forathoroughdiscussionofbariumsulfate con-centrationrangesforsynchrotron-basedX-rayCMTofbiofilms,whereit wasreportedthattheusefulrangeofbariumconcentrationforcolumns 5–7mmindiameteris33%(0.33g/mL)to50%(0.5g/mL)barium sul-fate.
TheK-shellabsorptionedgeforbariumis37.4keVsoeachcolumn sectionwasscannedattwoenergies,oneabove(37.54keV)andone be-low(37.34keV)thisedge.Theentirelengthofeachcolumnwasscanned bymovingthesamplestageverticallyandgeneratingaseriesof over-lappingscansections. Volumetricreconstructionof eachsection was obtainedfromaseriesoftwo-dimensionalscansthatareobtainedviaa 180° rotationofthesamplestageover720incrementsateachheight. Thechoiceof720anglesisbasedonexperiencewiththe instrumenta-tionatthisparticularbeam-line.Thetheoreticalnumberofprojection anglesrequiredisthenumberofpixelstheareaofinterestcovers(as thesamplerotates360°)multipliedby1.5(or540angles).By oversam-plingwith720angles,blurisreducedandtheresultingimagesareofa higherquality;thisallowsmoreaccuratesegmentationandsubsequent quantitativeanalyses.
2.7. Imageprocessingandquantitativeanalysis
Thereconstructeddatasetshavedimensionsof695 × 695 × 470 voxels,avoxelresolutionof10.5µmandarestoredwith16-bit pre-cision. As a first preprocessing step a cylindrical region of interest
S. Ostvar et al.
Fig.2. SmallsubsetofsegmentedCTimageoccupiedbybeads,biofilmand BaSO4solution(a);theconnectivityindexisbasedonthetopologyofthebiofilm network.Porediametersobtainedwiththemaximuminscribedspheremethod (b);theporesizeindex(PSI)isbasedontheaverageporediameteroccupied bythebiofilm(green).Soliddistancesintheporespace(c);thesoliddistance index(SDI)isbasedontheaveragesoliddistancewithinthebiofilm(green). (Forinterpretationofthereferencestocolourinthisfigurelegend,thereader isreferredtothewebversionofthisarticle.)
(ROI)insidethecorewasextracted.Atotalvariationfilterwasapplied fordenoisingandanunsharpmaskfilterusedforedgeenhancement (Schlüteretal.,2014).Imagesegmentationofthegrayscaledatafocused onisolatingthreephases:thebiofilm,theBaSO4suspension (represent-ingtheaqueousphase)andthesolidphase(glassbeads).Forthesedata, propersegmentationrequiredthedevelopmentofanovelsegmentation algorithmthatincorporatedcomplementaryinformationfromvarious imagesources.DirectisolationoftheBaSO4 wasfacilitatedusingthe increasedabsorptionintheabove-Ba-edgevs.below-Ba-edgedatasets, whichisreflectedbyhighintensityinadifferenceimage.However,the BaSO4suspensionhadsmall-scaleheterogeneityduetolocallyvarying bariumconcentrations,likelyasideeffectofusingabarium concentra-tiononthelowendoftheapplicableconcentrationrangeof33–50%. SegmentationoftheBaSO4 suspensioneveninlow concentration re-gionscanthereforebeimprovedfurtherbydirectlyevaluatingthe de-greeofsmall-scaleheterogeneityin agradientimage.Thebeadsand thebiofilmexhibitedhomogeneousandindependentlydistinguishable X-rayabsorptionatboththeaboveandbelowedgescanningenergies. Sinceoneimagesuffices,isolationofthebeadsandbiofilmwas accom-plishedusingthebelow-edgeimagedatasets.
AMarkov random field(MRF) segmentationalgorithm(Kulkarni etal.,2012;Schlüteretal.,2014)wasextendedtoallowformultiple classstatisticsfromvariousimagesources.Atthecoreofthismethod,a combinatorialoptimizationproblemissolvedinordertofindalabeling
̂ 𝐶thatsatisfies ̂ 𝐶=𝑎𝑟𝑔𝑚𝑖𝑛 [ 𝐼 ∑ 𝑖=1 𝑁 ∑ 𝑗=1 𝛼𝑖 ( ln √ 2𝜋𝜎2 𝑐,𝑖+ (𝑔𝑖(𝐱𝑗)−𝜇𝑐,𝑖)2 2𝜎2 𝑐,𝑖 ) ⏟⏞⏞⏞⏞⏞⏞⏞⏞⏞⏞⏞⏞⏞⏞⏞⏞⏞⏞⏞⏞⏞⏞⏞⏞⏞⏞⏞⏞⏞⏞⏞⏟⏞⏞⏞⏞⏞⏞⏞⏞⏞⏞⏞⏞⏞⏞⏞⏞⏞⏞⏞⏞⏞⏞⏞⏞⏞⏞⏞⏞⏞⏞⏞⏟ class statistics + ∑ {𝐱𝑗,𝐲𝑗}∈Π 𝛾(𝑐(𝐱𝑗),𝑐(𝐲𝑗)) ⏟⏞⏞⏞⏞⏞⏞⏞⏞⏞⏞⏞⏞⏞⏞⏟⏞⏞⏞⏞⏞⏞⏞⏞⏞⏞⏞⏞⏞⏞⏟ class boundaries (3) with 𝛾(𝑐(𝐱𝑗),𝑐(𝐲𝑗))= { −1, 𝑐(𝐱𝑗)=𝑐(𝐲𝑗) +1, 𝑐(𝐱𝑗)≠ 𝑐(𝐲𝑗) (4)
Here,Iisthetotalnumberofevaluatedimages(below-edgeimage, gra-dientimageanddifferenceimage),Nisthetotalnumberofvoxels evalu-ated(withcoordinatexj),Πisthepopulationofallpairsofneighboring voxelsatcoordinatesxandy,c(xj)istheclasslabelatxj(beads,biofilm
orBaSO4suspension),𝜇c,i and𝜎2𝑐,𝑖 areclassmeanandvariancein a
specificimagei,gi(xj)isthegrayvalueatthecoordinatexj inimage
iand𝛼i isauser-defined,image-specificweightingfactorthat deter-minesthecontributionofeachlikelihoodtermforagivenclassrelative tothepenaltytermforclassboundaries.Inotherwords,aclasslabelat acertainlocationisverylikely,if(i)thelocalgrayvaluesinallimages isclosetothespecificclassmeanfortheseimagesandif(ii)the ma-jorityofneighborsalreadybelongtothesameclass.Classupdatingwas achievedinadeterministicorderdenotedasiterativeconditionalmodes (ICM),i.e.startingatonecorneroftheimagethelabelforeachvoxel wasreplacedbytheclassthatminimizesthecontributiontoEq.(3). Thealgorithmwasstoppedafterthreeloops.Valuesfor 𝜇c,i and𝜎𝑐,𝑖2
havetobedeterminedpriortosegmentation,whichwasdoneby evalu-atingthejointprobabilities,asexplainedintheAppendix.Classification errorsintheMRFsegmentationresults,duetopartialvolumeeffects, wereremovedviapost-processing,whichisalsoexplainedinthe Ap-pendix.Theentireworkflowfrompreprocessingtoimagesegmentation andpost-processingisbasedontheQuantImimageprocessinglibrary (Schlüteretal.,2014;Vogeletal.,2010).
The vertical series of eight segmented volumes is subsequently mergedintoone columnvialandmarkregistrationinAvizoFire8.3. Thatis,twoconsecutivevolumesoverlappingby25%andpairsof iden-ticalcoordinateswithintheseoverlapregionshavetobeidentifiedby trackingeasilyidentifiablefeatures.Fig.1(e)depictsthemergedcolumn forasamplegrownunderhighflowrateconditions(450mL/h,𝑅𝑒=10) aftersegmentation.
Thecolumnsareanalyzedforeachverticalsectionindividuallyin ordertodetectchangeswithrespecttoinletdistance.Theinvestigated propertiescomprisestandardpropertieslikeporosity,biofilmvolume, biofilmsurfacearea,biofilmthicknessandvolumepercentageattached tosidewalls.Inaddition,thespatialpatternsofgrowthandattachment arecharacterizedwiththreenormalizedindexesthatcoverdifferent as-pectsofbiofilmconfigurations,asdemonstratedforasmallsubsetin
Fig.2.
Theconnectivityindex(CI)characterizeswhetherthebiofilmiswell orpoorlyconnectedbymeansoftheEulercharacteristic𝜒.This
topo-logicalmeasureisdefinedas(Vogeletal.,2010)
𝜒 =−+ (5)
where isthenumberofisolatedobjectsofthematerialofinterest, isthenumberofredundantconnectionswithinallmaterialclusters andisthenumberofcavities(e.g.isolatedbackgroundclusters com-pletelyenclosedbythematerial).TheEulercharacteristicoftheentire porespaceinabeadpack(𝜒ps)isusuallynegative,becauseitiswell con-nectedwithahighnumberofredundantloopsaroundthebeads().A normalizedconnectivityindexforthebiofilmcanbecomputedasfrom theEulercharacteristicofthebiofilm(𝜒bf)(Herringetal.,2015)as
𝐶𝐼= 𝜒𝑏𝑓
𝜒𝑝𝑠
(6)
Here,CI<1indicatesanimpairmentinbiofilmconnectivityduetothe
presenceofflowchannelsofbariumsulfatesolution,whereasCI>1
im-pliesthatthecoexistenceofbiofilmandBaSO4solutionwithinthepore
spaceevenincreasesthenumberofredundantloopswithinthebiofilm network.
Theporesizeindex(PSI)isbasedontheanalysisofporediameters bythemaximuminscribedspheremethod(Fig.2(b)). ThePSIisthe ratiooftheaverageporediameteroccupiedbybiofilm(dbf)dividedby theaverageporediameteroftheentireporespace(dps)
𝑃𝑆𝐼=𝑑𝑏𝑓
𝑑𝑝𝑠
(7)
Forthismetric,PSI<1indicatespreferenceofbiofilmtooccupypore constrictionsandavoidlargerporebodies.
Thesoliddistanceindex(SDI)isbasedontheanalysisofEuclidean distancesfromanylocationintheporespacetotheclosestsolidphase voxel(Fig.2(c)).The SDIis constructed bynormalizingtheaverage distancewithintheregionoccupiedbythebiofilm(ebf)bytheaverage distanceoftheentireporespace(eps)
𝑆𝐷𝐼= 𝑒𝑏𝑓
𝑒𝑝𝑠
(8)
Forthismetric,SDI<1indicatespreferenceofbiofilmtoattachtosolid
surfacesandavoidporecenters.Allquantitativeanalyseswerecarried outwithAvizoFire8.3andQuantIm.
2.8. Hydraulicconductivity
Transducer-based hydraulic conductivities were calculated using Darcy’slawwrittenforunidirectionalaxialflow(Bear,2013)
𝑣𝑧=− 𝜅𝑧𝑧 𝜇 ( 𝜕𝑝 𝜕𝑧−𝜌𝑔 ) (9)
wherevzisthesuperficialvelocity(m/s),𝜅zztheaxialcomponentofthe permeabilitytensor(m2),gthegravitationalconstant(m/s2),and𝜕p/𝜕z
thepressuregradient(Pa/m).Eq.(9)canbewritteninthefollowing simplifiedformfortheexperimentalsystem
𝑄 𝐴=−𝐾
ΔΦ
𝐿 (10)
HereΔΦisthenethydraulicheadchangeacrossthecolumn(m),Lthe totallengthofthecolumn(m),andKthehydraulicconductivity(m/s) thatisrelatedtopermeabilityby𝐾=𝜅𝑧𝑧𝜌𝑔∕𝜇.Notethatthehydraulic
headisdefinedbyHubbert’spotentialΦ(𝑧)=𝑧+𝑝(𝑧)∕(𝜌𝑔),sothatΔΦ simplyrepresentsthechangeinthehydraulicheadbetweentheinlet andtheoutletofthecolumns,ΔΦ =Φ𝑜𝑢𝑡𝑙𝑒𝑡−Φ𝑖𝑛𝑙𝑒𝑡.
Transducer-basedhydraulicconductivitiesforsampleporousmedia areusuallyestimatedbyscanningarangeofflowratesandproducinga linearfittothecorrespondingpressuredrops.Here,inordertoreduce uncertaintiesintroducedbytransducernoiseinthefit,awiderangeof flowrates(0–2500mL/h)wereapplied.Thisintervalextendsslightly beyondwhereEq.(10)isvalidintoatransitionalregimewherepressure dropandflowratearenonlinearlycorrelated(Bear,2013).To accom-modateforthisnon-linearity,theDarcy–Forchheimerequationwitha quadratic-in-velocitycorrectionwasusedinsteadincalculatingthe pre-growthconductivities.
Post-biofilm-growthhydraulicconductivitiesanduncertaintieswere calculatedusingEq.(10).Apotentialcauseofuncertaintyinthe mea-surementwasbiofilmgrowingintheinlettubing(despitesignificant ef-fortstopreventsuchgrowth),thisleadingtoadecreaseofpressuredrop, ΔPtubing,whentheinlettubingwaschanged(Section2.3).Wetherefore calculatedalowerboundofthepermeabilityusingthevaluesof pres-suredropaveragedoverthelast10hofeachexperiment,andanupper boundbysubtractingthecorrespondingΔPtubingfromtheaverage pres-suredrop.
Image-basedhydraulicconductivitieswerecalculatedusingthe fol-lowing Kozeny–Carman relationship (Bear, 2013) to compare it to transducer-basedestimates 𝐾=𝜌𝑔 𝜇 1 𝛽𝜏2 1 2 [ 𝜑3 (1−𝜑)2 ] (11)
Inthisexpression,theparametersaredefinedaspreviously;inaddition, isthespecificsurfacearea(theinterfacialsurfaceareatovolumeratio ofthesolidphase),𝜏 isthetortuosityofthemedium,and𝛽 isaconstant. Forsimplegranularmediatheprefactor1/𝛽𝜏2isusuallyassumedtobe
equalto1/5(Bear,2013).Wecalculatedthepre-growthdirectlyfrom the3Dimagesusingvaluesobtainedfortheglassbeadphaseinthedry scans.Thepost-growthvalueof wascalculatedbyconsideringthe biofilmandglassbeadsasthesolidphase.Thesumoftheinterfacial areasofbiofilmandglass beadsthatwereexposedtotheporespace wasusedforthispurpose.
OnewaytocalculateKusingEq.(11)istocomputetheglobal val-uesfor𝜑andaswidth-weightedaveragesofallthesections.However, averagingtendstoeliminatequitealotofpore-scaleinformation espe-ciallywhenthebiofilmphaseisnon-uniformlydistributedaxially. In-stead,Eq.(11)wasusedtocomputethehydraulicconductivityofeach columnsectionindependentlyand,inanalogywiththermalor electri-calresistance,theequivalent(effective)hydraulicconductivity(Keq)ofa columnwascalculatedastheharmonicmeanoftheconstituentsections (Bear,2013) 𝐿 𝐾𝑒𝑞 = 𝑁 ∑ 𝑖=1 𝐿𝑖 𝐾𝑖 (12)
whereListhetotallengthoftheevaluatedregion(cm),Liisthelength ofsectioni(cm),Nisthetotalnumberof sections,andKi isthe
hy-draulicconductivityof sectioni. Treatingeachimagedsectionasan independentlayer(Li)allowsforamorerealisticwayofaccountingfor non-uniformspatialdistributionofbiofilmsandtheireffectonK. 3. Results
3.1. Porousmediacharacterization
Bulkcharacterizationoftheporousmediapriortoflowexperiments providesasimplefirstcheckontheself-consistencyofimagingandthe post-processingworkflow.Tocomparewithgravimetricresults,global image-basedporositywascalculatedasaweightedaverageofthevalues fordifferentcolumnsections.Thebulkandimage-basedinitialcolumn porositieswere0.4000 ± 0.0075and0.4000 ± 0.0089,respectively. Thisexcellentmatchisrathersurprisingandastrongargumentforthe adequacyandrobustnessofthedevelopedimageprocessingworkflow. Thepre-growthbulkandimage-basedhydraulicconductivities(K)were 0.0181 ±0(cm/s)and0.0207 ± 0.0019(cm/s),respectively, demon-stratingverygoodagreementbetweenthetwomethods.Thesevalues areconsistentwiththegeneralrangeofvaluesreportedforsimple gran-ularmedia(Bear,2013).Theaveragesurface-area-to-volumeratioofthe media,,priortogrowthwascalculatedtobe4.22(1/mm).
3.2. Oxygenutilization
Themeasuredeffluentdissolvedoxygenconcentrationsnormalized bytheinfluentconcentrationarereproducedinFig.3.InfluentDO con-centrationsremainedstablearoundthesaturationlimitforoxygenin thegrowthmediaforthedurationoftheexperiment(theestimated sat-urationlimitwas8.05 ±0.29mg/L,whichwasusedtonormalizethe valuesinFig.3).Oxygendistributionshowedamarkedsensitivityto flowrate.Thecolumnssubjectedtothelowestflowratemaintained al-mostnegligibleeffluentoxygenconcentrations.Theintermediateflow rateproducedasimilarcurvebutshowedlate-timerecoveryforatleast oneof thecolumns. Insharpcontrast,thehighestflowratecolumns producedamoredynamicresponseandmaintainedanaverageeffluent concentrationaroundhalfthemagnitudeoftheinfluentconcentration throughoutthegrowthphase(fluctuationsareboundby∼1.5–6mg/L).
S. Ostvar et al.
Fig.3. Temporalrecordoftheeffluentdissolvedoxygenconcentration (normal-izedbytheinfluentconcentration)forthe6experimentalcolumns.Each col-umninthefigurerepresentsmeasurementsmadeatthecorrespondingReynold’s numberattheonsetoftheexperiment.
3.3. Structuralevolutionoftheporespace
Inordertocharacterizethenatureofbiofilmgrowthatdifferentflow rates,theaxialdistributionsofanumberofstructuralmeasureswere studied.Spatialprofilesforthesemeasuresalongtheflowdirectionare plottedinFig.4.Thechangeinporosityinacolumn(beforeandafter growth)isthemostobviousmetrictoindicatetheamountof bioclog-ging.Fig.4(a)showsthattheintermediateflowrate(𝑅𝑒=1.0)resulted inthelargestreductioninporosity,followedbythehighest(𝑅𝑒=10), andlowestflowrates(𝑅𝑒=0.1),respectively.TheprofilesinFig.4 fur-thershowthattheextentofporosityreductionvariedalongtheaxial direction(z)inallsixtestcases,butlessextensivelysoatthelowest flowrate.
Thethree-dimensionalvisualizationsshown inFig.4arein clear agreementwiththesefindingsasasignificantlylesseramountofbiofilm isobservedinthe𝑅𝑒=0.1columns,andadenserandgreatervolume ofbiofilmisobservedinthe𝑅𝑒=1.0columns.Itisalsoworthnoting thatweareabletodistinguishthedirectionofflow(upwards)fromthe images,andobservelessrigorouslyattachedfeaturessuchasstreamers (Drescheretal.,2013),despitetheconcernmentionedinthe introduc-tionthattheBaSO4 methodmayscour ordetachsuch moreweakly attachedbiofilmcomponentswhenthecontrastagentisaddedtothe columns.Wefurtherexaminedthebiofilm-solid,andbiofilm-fluid in-terfacialareasperunitvolume.Figs.4(b)and(c)showthatthese mea-suresarefairlysimilarforthe𝑅𝑒=1.0and𝑅𝑒=10columns,butslightly largerfor𝑅𝑒=0.1columns.
Inordertoassessbiofilmformationinplanestransversetotheflow direction,wecalculatedthepercentageofthetotalattachmentsurface areawhichisassociatedwiththebiofilmthatisfixedonthesidewalls ofeachcolumnsectionasopposedtobeingattachedtothesurfaceof glassbeadswithinthesamesection.Thismeasureprovidessome indica-tionofthelateraldistributionofbiofilmandthedegreeofpenetration ofbiofilmintotheglassbeadmatrix.Theresultsindicatethata signif-icantlylargerfractionofbiofilmwasattachedtothecolumnsidewalls atthehighestflowrate(>35%inthefirst10mmofthetestsection) comparedwiththeintermediateflowratecolumns(∼27%inthefirst 10mmofcolumnelevation)(Fig.6(a)).Thisdifferencewasobserved fortotalaveragebiofilmvolumesof0.061cm3and0.085cm3forthe
highestandintermediateflowratesrespectivelyinthefirst10mmof thecolumns.Percentsidewallattachmentforthelowestflowratewas relativelyinvariantintheaxialdirection.Incontrast,thevaluesforthe intermediateandhighestflowratesshowaconsistentdecrease(∼10%) towardtheoutlet.
Thethreestructureindiceshighlightdifferentaspectsofchanging biofilmconfigurationswithchanging flowrates.There wasa consis-tenttrendtowardshigherconnectivityindices(CI)withincreasingRe
(Fig.6(b)). At 𝑅𝑒=0.1 biofilm connectivity was lowest (CI≤1) be-causethevolumefractionofbiofilmwasalsolowest,biomassbeing dis-tributedinsmaller,isolatedpatches.Atintermediateflowrates(𝑅𝑒=1) thebiofilm hadamuch higherconnectivity(1<CI<3),becausethe
biofilmoccupiedtheporespacealmostcompletely(lowestporosityin
Fig.4(b)).Therewasagradualreductioninconnectivitywithinlet dis-tance,becausethebiofilmgetsmorecompact.Thatis,sinceflowpaths occupiedbyBaSO4solutiondecreasedwithinletdistance,therewere lessredundant loopsinthebiofilm aroundthese flowpaths.This CI
reductionwithinletdistanceisinlinewithdecreasingporosityand de-creasingreactivesurfacearea(Fig.4(b)and(c)).The𝑅𝑒=10columns exhibitedtheoppositetrendofincreasingconnectivitystartingatsmall isolatedpatchesdirectlyattheinlet(CI≈1)andendingwiththe high-estconnectivityofallcolumnsintheupperpart(CI>3)becausebiofilm
andflowchannelsofBaSO4forcomplexintermingledstructuresalso
ex-hibitedthehighestreactivesurfacearea(Fig.4(c)).
Thedifferences inthesoliddistanceindiceswerelesspronounced (Fig.6(c)).Ingeneral,SDI≤1becausebiofilmgrowthwasalways initi-atedonsolidsurfacessothatbiofilmhadatendencytobelocatedclose tosolidinterfaces.TheSDIwashighestatintermediateflowrates be-causethebiofilmoccupiedthelargestpartoftheporespacesothatthe averagedistanceofthebiofilmebf approachedthatoftheporespace
eps.Boththehighest(𝑅𝑒=10)andlowest(𝑅𝑒=0.1)flowrate exhib-itedagradualincreaseinSDIfromtheinlettowardstheoutlet.Inboth casesbiofilmclustersdirectlyattheinletweresmallanddirectly at-tachedtograinsurfaces.Withincreasinginletdistancethevolume
frac-Fig.4.Spatialdistributionofporositychange(a),biofilm-fluidsurfaceareapervolume(b),andbiofilm-solidsurfaceareapervolume(c).Datapointsrepresentthe averagesoftwoexperimentsatindividualsections.Errorbarsrepresentonestandarddeviation.
tionandsurfaceareaalsoincreasedandsodidthegrowthintopore centers(Fig.4(b)and(c)).Directlyattheoutlettherewasaconsistent increaseinSDIamongallcolumnsthatmightbecausedby accumula-tionofbiomass.Theporesizeindex(PSI)exhibitedverysimilar behav-iorandthereforecarriedredundantinformationatleastforthe investi-gatedglassbeadmedium(Fig.6(d)).Therewasatendencyofthebiofilm tooccupysmallerporeconstrictionsforallflowrates,whichwasless pronouncedatintermediateflowrates(𝑅𝑒=1)becauseatthesehigh volumefractionstheaverageporediametercoveredbythebiofilm(dbf) approachedthatoftheentireporespace(dps).Atthehighestflowrate
(𝑅𝑒=10)therewasagainagradualincreaseinPSIwithinletdistance, becauseintheupperpartofthecolumnbiofilmgrowthoraccumulation extendedmoretowardsbiggerporebodies.
3.4. Bioclogging
Fig.7showsthecomparisonbetweentransducer-basedand image-basedhydraulicconductivitiesbeforeandafterbacterialgrowth.The shaded areas in the figure represent the uncertainty bounds of the transducer-basedmeasurements due topotential growthin the inlet tubing,computedasdescribedinSection2.8.Thetransducer-measured changeinhydraulicconductivityvariedbetween1to2ordersof mag-nitudefor all columns, values that are comparabletothe range re-portedin otherinvestigations (e.g.Cunningham etal., 1991;Seifert andEngesgaard,2007;Thullner,2010).Thelargestmeandecreasein
Kwasobserved forthe𝑅𝑒=1.0 columnswhilethelowest flowrate columns(𝑅𝑒=0.1)producedthesmallestmeandecreaseinhydraulic conductivity.Fig.7(a)showsthattheKozeny–Carmanrelationshipwith 1∕𝛽𝜏2=1∕5(modelA)predictedthetrendofreductioninKatthe
dif-ferentflowrate,buttendedtosystematicallyunderestimatethe magni-tudescomparedwithtransducer-basedmeasurements,despitethe pref-actorbeingrepresentativeattheonsetoftheexperiments.
Apotentialcauseoftheobserveddeviationbetweenthetwo meth-odsisanincreaseinthetortuosityofthemediaafterbacterialgrowth. Wecalculatedthepre-andpost-growthtortuositiesdirectlyfromthe imagesusingtheCentroidPathTortuosity modulein AvizoFire8.3. Thismodulecomputesthetortuosityofapathformedbythecentroids oneachplanealongthez-axisofabinary3Dimage.Thebiofilmand solidphaseswerecombinedintheimageandthentheimagewas bina-rizedbeforethetortuositywascalculatedforeachstackofimages.An averageofthetwocolumnsforeachflowrateispresentedinFig.7(b) (valuesarenormalizedbypre-growthtortuositiescomputedusingthe samemethod).Thecomputedvalueswerethenusedtocorrectthe pref-actorin theKozeny–Carmanrelationship (modelB). Fig.7(c)shows thataccountingforanincreaseintortuositysignificantlyimprovedthe comparisonbetweentransducer-basedandimage-basedcomputations ofpost-growthhydraulicconductivityforallflowrates.Theobserved increaseintortuosityisslightlylargerthantherangeofvaluesobtained viasimulationsof2Drandommediafor𝜑<0.3(Hymanetal.,2012; Matykaetal.,2008).
4. Discussion
A combination of results from different measurements supports thehypothesis thatgrowthunder𝑅𝑒=0.1wassignificantly nutrient-limited. The almost complete depletion of dissolved oxygen at this flowrate(Fig.3)supportsthispicture,althoughbiofilmgrowinginthe inlettubing couldhavecontributed totheconsumptionof inletDO, andtherebyhavecontributedtotherecordedpressuredrops.Limited growthat𝑅𝑒=0.1isalsoreflectedinthemarkedlylowerreductionin porosity(Figs.4(d),and5(a))andhydraulicconductivitywhen com-paredwithhigherflowrates.Theaveragebiofilmvolumeatthisflow rateisrelativelyuniformaxiallywithlowconnectivityamongdispersely distributed biofilm clusters that are preferentially attached tograin boundariesandporeconstrictions.Sensitivityofbiofilmstructuretothe
Fig.5. Visualizationsofbiofilmdistributionincolumnssubjectto𝑅𝑒=0.1(a),
𝑅𝑒=1.0(b),and𝑅𝑒=10(c).Glassbeadsaregray,andbiofilmispurpleinthe onlineversion.(Forinterpretationofthereferencestocolorinthisfigurelegend, thereaderisreferredtothewebversionofthisarticle.)
Fig.6. Spatialdistributionsofthecontributionofsidewallattachmenttothe totalbiofilmattachmentsurfacearea(a),thenormalizedconnectivityindex(b), thesoliddistanceindex(c),andtheporesizeindex(d).
S. Ostvar et al.
Fig.7.(a):Transducer-basedandimage-basedestimatesforreductioninhydraulicconductivityatdifferentflowrates.Image-basedresultsarecalculatedusing
Eq.(11)with1∕𝛽𝜏2=1∕5(modelA),andtortuosityvaluesdirectlycomputedfromimages(modelB).Theshadedareashowsthepotentialuncertaintyin transducer-basedmeasurementsduetogrowthininlettubings.(b):Ratiosofpre-andpost-growthtortuositiesobtainedviadirectanalysisofimages.
availabilityofoxygenhasbeenreportedpreviously(e.g.Changetal., 2015).
Incontrast,biofilmgrowthisimprovedattheintermediateand high-estflowrates(compareFig.5(a)–(c)).Weobservedagradientinaverage biofilmvolumethatincreasedtowardthetopofthecolumnsat𝑅𝑒=1.0 and10,alikelyindicationofshear-inducedsloughingofcellsand sub-sequentaccumulationneartheoutlet(an1/8-inchnarrowopeningthat connectstheporoussectiontoexternaltubing).Interestinglyother gra-dientsinbiofilmconfigurationsshowedoppositetrendsfor𝑅𝑒=0.1and
𝑅𝑒=10.Atintermediateflowratesthebiofilmgrowthwasmoreevenly distributedwithintheporespaceintermsofoccupiedporesizesand graindistances.Thereactivesurfaceareaandconnectivitydecreased slightlytowardstheoutlet.Atthehighestflowrate,inturn,therewasa distinctshifttowardsgrowthinporeconstrictionsandalonggrain sur-facesespeciallyclosetotheinletaswellasadistinctincreaseinbiofilm volume,reactivesurfaceandconnectivitywithinletdistance.Amore subtleformofheterogeneityisevidentintheaveragepercentsidewall attachment,whichdecreasedsignificantlybeyondthefirstfewsections for𝑅𝑒=1.0and10,andisinvariantfor𝑅𝑒=0.1.Thesetrendssuggest that,especiallyunderthehighershearflows,biofilmgrowthundergoes atransitionwhereregions nearthesidewallareincreasinglyless oc-cupiedbybiofilmtoward theoutlet. Thisis becausepores alongthe sidewallsarewiderthanporesbetweenglassbeadsduetosub-optimal packingandtheythereforeimposealowerresistancetoflow.
Theinhomogeneitiesin thespatialdistributionofbiofilmsappear tobelinkedtoregionswheredramaticchangesinflowtakeplace.The threeexamplesobservedhereare(i)increasedtendencyofbiofilmsto forminthesidewallregionsneartheinlet.Thistendencycouldbe a consequenceofthegenerallyhigherconcentrationsofdissolvedoxygen neartheinlet,andtheflowfieldstillbeingaffectedbythe converging-divergingnozzle-likestructureof thecolumninlet; (ii)accumulation ofbiofilmneartheoutletwhereflowisconvergingintoamore con-strictedopeningasdiscussedabove;and(iii)atthehighestflowrate thetendencyofbiofilmtooccupyporeconstrictionsandgrainsurfaces directlyclosetheinlet,aneffectthatdisappearsagainatgreaterinlet distances.Thisindicatesthathighershearflowsinthemainflowpaths neartheinlethindersthebiofilmfromoccupyingthecenterofbigger porebodiesinthevicinityoftheinlet.
Thefactthatcorrectingfortortuositysignificantlyimprovesthe com-parisonbetweentransducer-andimage-basedpost-growth permeabili-tiessupportsthenotionthatbiofilmgrowthcancompletelytransform thestructureofpore-scaleflow(Drescheretal.,2013).Theimage-based measurementsfor𝑅𝑒=0.1and𝑅𝑒=10canpotentiallybefurther im-provedbyusingotherporespaceattributesthantheharmonicmean ofporosities.Onewayforwardwouldbetocomputecriticalpath con-ductivities(Friedman andSeaton,1996),bysearching forthelowest conductivity alongthe pathof lowestflow resistance, which in our studywould likely be situated close tothe outletwere biofilmwas
accumulating.Although thevolume fraction andassociated porosity of this type of localgrowth is small, itcan imposea dominant im-pacton effectivepermeability.Similarresults havebeenreportedby
Bielefeldtetal.(2002)wheredecreasesinhydraulicconductivityofup to3ordersofmagnitudewereobserveddespiteamere3–8percent de-creaseinporosityduetobiofilmgrowth.
Weshouldnotethatthetransducer-derivedpost-growth permeabili-tiescarrysomeuncertaintyaswell,becauseobservedfluctuationsmake itdifficulttoobtainanaccuratevalueforpressuredropimmediately beforetheterminationoftheexperiment.Implementinganaveraging windowadjacenttotheendoftheexperimentcanstabilizethereading, butintroducesinformationfromearliertimesthatmightnot necessar-ilyrepresentthesnapshotstudiedafterimaging.Consideringthisand thesimplicityoftheKozeny–Carmanmodel,image-basedcalculations demonstrateverygoodaccuracy.Onceactualtortuositieswereusedto predictthereductioninhydraulicconductivity,thetrendwithRewas verywell-matched(modelBinFig.7).
Basedontheoverallpatternofreductioninhydraulicconductivity atdifferentflowrates,wehypothesizethatthebiocloggingwas influ-encedbyatrade-off betweentheavailabilityofnutrients(mainly dis-solvedoxygen)andshear-inducedsloughing.Biofilmsgrownunderan initialReof1.0resultedinaslightlylargeraveragereductionin hy-draulicconductivityandporosity.Bothparametersdecreasedasflow rateincreasedinthecurrentroundofexperiments.Ourinterpretation ofthistrendisthat,asflowrateincreased,athresholdwascrossedat whichpointoxygenis nolongeralimitingfactorin biofilmgrowth, andcontinuousgrowthwaspromoteduntilshearstressinducedbythe increasinglyrestrictedflowinitiatessloughing.
5. Limitationsandfuturework
Balancingcompletecoverageoftheporespacebythecontrastagent, whileminimizingsloughingof biomassistheprimarychallenge dur-ingimaging.Theimageprocessingworkflowimplementedhereenabled asignificantimprovementintheaccuracyofphasesegmentationover previouseffortsbyaccountingfortheheterogeneitiesinthespatial dis-tributionof thebariumsulfatecontrast agent. Developmentof more sophisticatedcontrastagentsandtailoredimageprocessingalgorithms couldfurtherimprovetheresolutionofthemethodandreduceits in-trusivity.Becausewe usemicroimaging asamodel-drivenpredictor, thesensitivityofimage-basedmeasurementsdependsonthe complex-ityof themodelsusedtodeducethem. Wewouldexpect thatusing modelsthat carry more informationon themorphology of thepore spacesignificantlyimprovetheaccuracyof themethod,perhaps be-yondwhatispossibleusingtransducermeasurements.Forinstanceone coulddirectlytakeintoaccountlocalvariationsinvelocityand pres-sureandtheireffectonpermeabilityinadirectnumericalsimulation ofthepost-growthflowfield(e.g.Peszynskaetal.,2015).Regardless,
computationsofpermeability/hydraulicconductivityusingtheKozeny– Carmanmodelandthemeasuredsurface-area-to-volumeratios, poros-ity,andtortuosity(allpurelyimage-basedmeasurements)demonstrated verypromisingfidelity.
Anothersteptowardbetterunderstandingthemorphology, distribu-tionandquantityofbiomassgrowingwithinporousstructuresisto sys-tematicallystudyabroaderrangeofflowrateandnutrientconditions, witheach conditionreplicatedseveraltimes.Inthisperspective, the presentresultsshowgreatpromiseforfutureuseofthemethodin under-standingthereportedheterogeneitiesinphysicalpropertiesofporous mediasubject tomicrobial growth(e.g.acousticsignatures,complex conductivity,etc.)andthepost-growth3Dstructureoftheporespace (AbdelAaletal.,2010;AtekwanaandSlater,2009;Davisetal.,2006; 2009;2010).Imagingofrelativelylargesampleswasachievedhere, en-ablingthestudyofbulkgrowthindicatorsinresponsetoaprescribed flowrate,aswellaslocalvariationsingrowthinthemodelsystems. Newstructuralindiceswereintroducedinthisstudythatcoververy dif-ferentaspectsofbiofilmconfigurations;thesenewindicesshouldhelp facilitatesystematicstudiesinthefuture.Thedegreetowhichthese re-sultsaregeneralizableinevitablydependsonthechoicesmadeduring thedesignoftheexperimentalsystem.Regardless,thisworkhashelped toestablisheffectiveprotocolssothatfutureworkcanfocusonmore complex porestructures andexploringabroaderrangeof replicated conditions.
6. Conclusions
3Dvisualizationofbiofilmstructurewasachievedforthreedistinct hydrodynamicconditionsinopaqueporousmedia.Microimagingwas usedtotrackthestructuralchangesoftheporespacesduetobiofilm growth,whichwerecross-referencedwithbulkmeasurementsof pres-suredropandoxygenutilization.Distinctgrowthandlocal morpho-logicalpatternswereobserved forgrowthin columnssubject to dif-ferentflowrates.Excellentagreementwasfoundbetween transducer-derived hydraulic conductivities andimage-based estimates using a simpleporosity-permeabilityrelationshippriortogrowth.Post-growth permeabilitiesprovedmorechallengingtopredictduepossiblytothe development of heterogeneities in poremorphology. Yet, very good agreementwasobservedbetweenthetrendsofhydraulicconductivity reductionatdifferentflowratesusingthetwomethods,andtheresults improvedwhentheincreased(actual)post-growthtortuosityofthepore spacewasaccountedfor.Biocloggingwasfoundtodependnon-trivially onflowrate,likelyafunctionofcompetingmasstransfer(dissolved oxy-gendelivery)andshearstress.Theuseofabariumsulfatesuspensionas acontrastagentwasfurtherfine-tunedbyimplementinganovelimage processingworkflowthataccountsforinhomogeneitiesinthe attenua-tionofthefluidphase.Theresultsdemonstratetheutilityof microimag-ingusingX-rayCTinstudiesoftransformationofporousmediasubject tobiofilmgrowth.
Acknowledgments
ThisworkwassupportedbytheEnvironmentalRemediationScience Program(DE-FG02-09ER64734)undertheDepartmentofEnergy, Of-ficeofBiologicalandEnvironmentalResearch(BER),grant ER64734-1032845-0014978.ThisresearchusedresourcesoftheAdvanced Pho-tonSource,aU.S.DepartmentofEnergy(DOE)OfficeofScienceUser FacilityoperatedfortheDOEOfficeofSciencebyArgonneNational Lab-oratoryunderContractNo.DE-AC02-06CH11357.Weacknowledgethe supportofGeoSoilEnviroCARS(Sector13),whichissupportedbythe
NationalScienceFoundation-EarthSciences(EAR-1128799),andthe DepartmentofEnergy,Geosciences(DE-FG02-94ER14466).Wewould liketothankMarkRiversatGSECARSattheAPSforassistancewith CTimaging.SOandBWweresupportedinpartbytheNationalScience FoundationundergrantEAR1141488.SSisgratefultothe Alexander-von-Humboldt Foundation for granting a Feodor-Lynen scholarship.
Theimageprocessing libraryQuantImisaccessible freeofcharge at
http://www.quantim.ufz.de.
AppendixA
A1. Segmentationofbiofilmdata
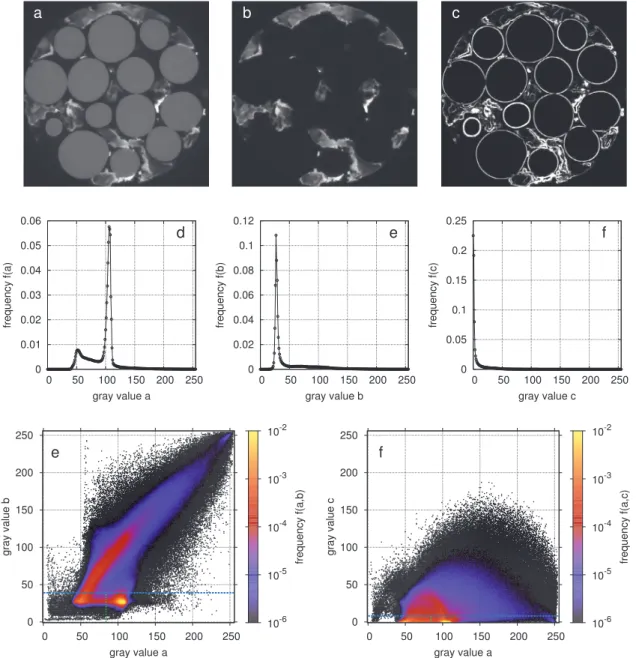
ThechallengeinsegmentingbiofilmimagesisthattheBaSO4 parti-clesarenon-uniformlydistributedintheporespacethatisnotoccupied bythebiofilm(Fig.A.1(a)).Thisresultsinbroadrangeofintensitiesfor theBaSO4phase.Asaconsequence,itcannotbeidentifiedasathird modeinthecorrespondinghistogram(Fig.A.1(d)).Inturn,the differ-encebetweenabove-edgeandbelow-edgeintensity(Fig.A.1(b))islow forbiofilmandbeads,sinceinbothphasestheelectronadsorptiondoes notchangewithasmallchangeinbeamenergy.Yetthedifferenceis highfortheBaSO4phaseandvarieswithbariumconcentration.This
re-sultsinasinglepeakforbeadsandbiofilmandalongtailingforBaSO4 inthecorrespondinghistogram(Fig.A.1(e)).Thejointfrequency dis-tributionofthebelow-edgeandthedifferenceintensities(Fig.A.1(g)) isalreadysufficienttoidentifybeadsasanisolatedclusterinthe fea-turespace,butthereisagradualtransitionfrombiofilmtoBaSO4due tothevariationinbariumconcentration.Thisvariation,however,can beassessedbythelocalimagegradient(Fig.A.1(b)),whichislowin thehomogeneousbeadsandbiofilmandhasabroadrangeof intensi-tiesintheBaSO4filledporespace.Thisleadstoajointpeakatzeroin
thegradienthistogramforbiofilmandbeads(Fig.A.1(e))andalong tailforBaSO4andthetransitionvoxelsatphaseboundaries.Thejoint frequency distributionofthebelow-edgeandthegradientintensities (Fig.A.1(h))exhibitstwoclustersatlowgradientintensities,onefor beadsandoneforbiofilm,whichareconnectedbyanarchofpartial volumevoxelsattheboundariesbetweenthetwophases,andextensive scatteringforBaSO4.
Thetwojoint probabilities(Fig.A.1(g)and(h)) arenowused to estimatetheclassstatisticsinEq.(3)withthefollowingworkflow:
1. Unimodalthresholding(Rosin,2001;Schlüteretal.,2014)isapplied toseparatethepeak(biofilmandbeads)fromthetail(BaSO4and
phaseboundaries)inthegradienthistogram.Notethatthisthreshold correspondstothehorizontallineinFig.A.1(h).AROIofvoxelsthat belongtothepeakclassiscreated.
2. Thehistogramofbelow-edgeintensitieswithinthisROIisevaluated byaminimumsearch(Schlüteretal.,2014;Tsai,1995)todetectthe thresholdbetweenbeadsandbiofilm.Thiscorrespondstoavertical lineinFig.A.1(h).
3. Abeadlabelisassignedtoallvoxelsthatfulfillboththreshold re-quirementsandwhosejointfrequencyexceedsauser-defined thresh-old,e.g.1× 10−3inFig.A.1(h).Biofilmvoxelsarelabeledinthesame
way.
4. Noiseobjectsinthelabelimageareremovedwithasizeexclusion filterandtheremaininglabelsaredilatedwithasphericalstructure elementofradius𝑟=4.Thedilatedareasareconsideredasphase boundariesandtherestisassignedtoBaSO4.
5. Steps1–4arerepeatedwiththedifferenceimageinsteadofthe gra-dientimageasverticalaxisinthefeaturespace(Fig.A.1(g)). 6. Thefinallabelimage(Fig.A.2(d))isobtainedbymergingthe
la-belimagesfromsteps4and5together,i.e.labelsthatcoincidein bothimagesarekeptandvoxelswithdifferentlabelsaresetbackto unassigned.
7. Theclassstatistics(𝜇c,𝜆and𝜎𝑐,𝜆2 )inEq.(3)canthenbeestimated
fromlabel-specifichistogramsineachinputimage.
Notethat theautomatedthreshold detectionmethodsin the pre-sentedworkflowmayfail,whenthevolumefractionofbiofilmorBaSO4
becomestoolow.Inthatcasethatvalueshavetobeadapted manu-ally.Wearecurrentlyimprovingtheworkflowbysubstitutingthe itera-tivethresholddetectionforsinglesourceimageswithmulti-dimensional
S. Ostvar et al.
Fig.A1. Simpleandjointfrequencydistributionsforvariousinputdata:(a)2Dsliceofabelow-edgeimagefromamediumflowrate(𝑅𝑒=1.0);(b)2Dsliceof differencebetweenabove-edgeandbelow-edgeimage;(c)2Dsliceofgradientofbelow-edgeimage;(d)histogramofbelow-edgeimage;(e)histogramofdifference image;(f)histogramofgradientimage;(g)jointfrequencydistributionsofbelow-edgeanddifferenceimageincludingthresholds;(h)jointfrequencydistributions ofbelow-edgeandgradientimageincludingthresholds.
clusteringtechniquesthatallowforirregularthresholdsurfacesinthe featurespace.
DuringMarkovrandomfield(MRF)segmentationeachvoxelis as-signedaclasslabelaccordingtothepenaltytermforphaseboundaries andthesumoflikelihoodtermsofeachclassinEq.(3)(Fig.A.2(a)– (c)).Due toreformulation thesmallestvaluefor thelikelihoodterm isconsideredoptimal.Thelikelihoodtermismultipliedwiththe user-definedweightingfactorforeachimagesource,whichissettoalow valueof 𝛼𝜆=0.1,𝜆 =1,2,3,toincreasethe penaltyon phase
bound-ariesandthusinvokesmoothboundaries.TheMRFsegmentationresults
(Fig.A.2(e))arenotoptimalyetduetopartialvolumeeffects.Thatis, voxelsalongthebeadboundariesarepartiallyfilledwithbiofilm,which leadstoafalseassignmenttoBaSO4.Postprocessinghastobeapplied toremovethisunwantedeffect.Todoso,acubickernelwith73
vox-elsloopsthroughtheimage,detectsboundariesasneighborhoodswith morethanonelabelandsetsthecentralvaluetounassigned. Subse-quentlythelabelsareiterativelydilatedbackintounassignedareasby asimplemajorityrule,i.e.themostrepresentativelabelinacubic73
kernelisassignedtothecentralvoxeluntilnounassignedvoxelisleft. TheresultafterpostprocessingisdepictedinFig.A.2(f).
Fig.A2. Segmentationandpostprocessingresults:likelihoodofeachclassforagivengrayvalueaccordingtotheclassstatisticsin(a)thebelow-edgeimage,(b) thegradientimage,(c)thedifferenceimage;(d)2Dsliceofmergedlabelimagethatservesasatemplatetoestimateclassstatistics;(e)MRFsegmentationresults; (f)finalsegmentationresultsafterpostprocessing.
Supplementarymaterial
Supplementarymaterialassociatedwiththisarticlecanbefound,in theonlineversion,atdoi:10.1016/j.advwatres.2018.03.018.
References
Abdel Aal, G.Z. , Atekwana, E.A. , Atekwana, E.A. , 2010. Effect of bioclogging in porous media on complex conductivity signatures. J. Geophys. Res.: Biogeosci. 115 (G3) . Armstrong, R.T. , Wildenschild, D. , 2012. Investigating the pore-scale mechanisms of mi-
crobial enhanced oil recovery. J. Petrol. Sci.Eng. 94, 155–164 .
Atekwana, E.A. , Slater, L.D. , 2009. Biogeophysics: a new frontier in earth science research. Rev. Geophys. 47 (4) .
Baveye, P. , 2010. Comment on ‘comparison of bioclogging effects in saturated porous media within one-and two-dimensional flow systems’ by martin thullner. Ecol. Eng. 36 (6), 835–836 .
Baveye, P. , Vandevivere, P. , Hoyle, B.L. , DeLeo, P.C. , de Lozada, D.S. , 1998. Environmen- tal impact and mechanisms of the biological clogging of saturated soils and aquifer materials. Crit. Rev. Environ. Sci. Technol. 28 (2), 123–191 .
Baveye, P.C. , Darnault, C. , 2017. Microbial competition and evolution in natural porous environments: not that simple. Proc. Natl. Acad. Sci. 201700992 .
Bear, J. , 2013. Dynamics of Fluids in Porous Media. Courier Corporation .
Beyenal, H. , Donovan, C. , Lewandowski, Z. , Harkin, G. , 2004. Three-dimensional biofilm structure quantification. J. Microbiol. Methods 59 (3), 395–413 .
Bielefeldt, A.R. , McEachern, C. , Illangasekare, T. , 2002. Hydrodynamic changes in sand due to biogrowth on naphthalene and decane. J. Environ. Eng. 128 (1), 51–59 . Carrel, M. , Beltran, M.A. , Morales, V.L. , Derlon, N. , Morgenroth, E. , Kaufmann, R. ,
Holzner, M. , 2017. Biofilm imaging in porous media by laboratory x-ray tomography: combining a non-destructive contrast agent with propagation-based phase-contrast imaging tools. PloS one 12 (7), e0180374 .
Chang, Y.-W. , Fragkopoulos, A.A. , Marquez, S.M. , Kim, H.D. , Angelini, T.E. , Fernán- dez-Nieves, A. , 2015. Biofilm formation in geometries with different surface curvature and oxygen availability. New J. Phys. 17 (3), 033017 .
Coyte, K.Z. , Tabuteau, H. , Gaffney, E.A. , Foster, K.R. , Durham, W.M. , 2017. Reply to bav- eye and darnault: useful models are simple and extendable. Proc. Natl. Acad. Sci. 201702303 .
Cunningham, A.B. , Characklis, W.G. , Abedeen, F. , Crawford, D. , 1991. Influence of biofilm accumulation on porous media hydrodynamics. Environ. Sci. Technol. 25 (7), 1305–1311 .
Davis, C.A. , Atekwana, E. , Atekwana, E. , Slater, L.D. , Rossbach, S. , Mormile, M.R. , 2006. Microbial growth and biofilm formation in geologic media is detected with complex conductivity measurements. Geophys. Res. Lett. 33 (18) .
Davis, C.A. , Pyrak-Nolte, L.J. , Atekwana, E.A. , Werkema, D.D. , Haugen, M.E. , 2009. Mi- crobial-induced heterogeneity in the acoustic properties of porous media. Geophys. Res. Lett. 36 (21) .
Davis, C.A. , Pyrak-Nolte, L.J. , Atekwana, E.A. , Werkema, D.D. , Haugen, M.E. , 2010. Acous- tic and electrical property changes due to microbial growth and biofilm formation in porous media. J. Geophys. Res.: Biogeosci. 115 (G3) .