HAL Id: halshs-01136850
https://halshs.archives-ouvertes.fr/halshs-01136850
Submitted on 31 Jan 2017HAL is a multi-disciplinary open access archive for the deposit and dissemination of sci-entific research documents, whether they are pub-lished or not. The documents may come from teaching and research institutions in France or
L’archive ouverte pluridisciplinaire HAL, est destinée au dépôt et à la diffusion de documents scientifiques de niveau recherche, publiés ou non, émanant des établissements d’enseignement et de recherche français ou étrangers, des laboratoires
Mapping out social change in South India
Christophe Guilmoto, Sébastien Oliveau, Virginie Chasles, Rémy Delage,
Stéphanie Vella
To cite this version:
Christophe Guilmoto, Sébastien Oliveau, Virginie Chasles, Rémy Delage, Stéphanie Vella. Mapping out social change in South India: A GIS and its applications. French Institute of Pondicherry, pp.110, 2004, Pondy Papers in Social Sciences, ISSN: 0972-3188. �halshs-01136850�
MAPPING OUT SOCIAL CHANGE
IN SOUTH INDIA
The Institut français de Pondichéry (IFP, French Institute of Pondicherry) is a multidisciplinary research institute, whose scope embraces Indian civilization, History and Society, Environment and Development in South and South-East Asia, through the Departments of Indology, Ecology and Social Sciences. Created in 1955, the IFP is part of a network of research centres funded and supervised by the Division of Social Sciences, Human Sciences and Archaeology of the French Ministry of Foreign Affairs. Since 1988 the Department of Social Sciences has been carrying out joint Indo-French research programmes in anthropology, history, demography, geography, sociology, by focussing on cultural and social changes. As the result of these programmes, the Pondy Papers in Social Sciences (PPSS) are a series of working papers to which IFP researchers and associated persons contribute (refer to the list at the end of the issue).
French Institute of Pondicherry, 11, St. Louis Street, P.B. 33, Pondicherry
605001-India, Tel: (413) 2334170/334168, Email: [email protected], Website: www.ifpindia.org
In Delhi, the Centre de Sciences Humaines at Delhi (CSH, Centre for Social Sciences and Humanities), is also part of the same network of research centres, coming under the French Ministry of Foreign Affairs. Since 1989, the Centre’s research work is primarily oriented towards the study of issues concerning the contemporary dynamics, relative to development in India and South Asia. The activities of the Centre are focused on four main themes, namely: Economic growth and sustainable development, international and regional relations, Institutional structures and political constructions of identity, and Urban dynamics.
Centre de Sciences Humaines, 2, Aurangzeb Road, New Delhi, 110 011, India.
Tel: (91) 11 2301 62 59/ 41 73, E-mail: [email protected], Website: www.csh-delhi.com
MAPPING OUT SOCIAL CHANGE IN SOUTH INDIA
A geographic information system and its applications
Christophe Z. Guilmoto, Sébastien Oliveau, Virginie Chasles, Rémy Delage and Stéphanie Vella
31
P o n d y P a p e r s i n S o c i a l
S c i e n c e s
ISSN: 0972-3188
© French Institute of Pondicherry, 2004 Department of Social Sciences
11, Street Saint Louis, PO Box 33 Pondicherry, 605 001, India
Ph.: (91) 413 2334170/168, Fax: (91) 413 2339534 Website: www.ifpindia.org
Composition - Cellule d’Édition, IFP Impression - All India Press, Pondicherry Front Cover - Cover photography: Laurent Dufy
CONTENTS
Acknowledgements ... 9
Introduction... 11
1. A geoGraphic information system for South India... 15
Georeferencing South India... 15
Sharing the data: CD-ROM and Internet... 27
From villages to spatial clusters ... 32
2. Applied spatial analysis ... 43
Graphic representations of the Sabarimala pilgrimage (Kerala) ... 45
Popular mappings of the Sabarimala pilgrimage ... 48
Methodological challenges of mapping pilgrimage data ... 53
From survey information to geographic and statistical data ... 55
Between Tamil Nadu and Kerala: the pilgrim’s routes to Sabarimala ... 57
Conclusions and discussion: pilgrimage and circulation in South India ... 62
The geography of irrigation in South India ... 64
Measuring sexual discrimination in rural South India... 67
From population geography to child sex ratio ... 68
Indirect data for a sensitive topic ... 69
Variations in the child sex ratio ... 71
Child sex ratio in South India, 1991 ... 73
Child sex ratio in Tamil Nadu, 1991... 75
Spatial distribution of medical infrastructure-Andhra Pradesh ... 78
Data and scale of analysis ... 78
Medical infrastructure in Andhra Pradesh ... 80
Urban spread and rural continuity. A quantitative approach... 84
A new approach to rural-urban linkages ... 84
Large-scale analysis ... 87
The geostatistical analysis of fertility in South India ... 92
Why geostatistics? ... 93
The comparison of autocorrelation coefficients... 94
An interim conclusion... 100
Conclusion ... 103
Web sites ... 107
References... 108
LIST OF TABLES AND FIGURES
Table 1: Villages in the SIFP database ... 33 Table 2: Characteristics of villages and clusters... 38 Table 3: Coding of localities and geographic coordinates... 55 Table 4: Succession of places visited by a pilgrim on the
way to Sabarimala ... 56 Table 5: District-wise geographical origin of Tamil pilgrims ... 58 Table 6: Sex ratio below 7 in several States, 1991-2001 ... 71 Table 7: Correlation between city size (logarithm) and various
socio-demographic indicators... 86 Table 8: Coefficients of correlation between distance to town and literacy
and household size. Comparison of different findings... 86 Table 9: Characteristics of towns and their hinterland according to
their size class... 89 Figure 1: Technological, theoretical and scientific environment
of the SIFP project... 12 Figure 2: Topographical map of the Vellore region
(Tamil Nadu, India), 1914-15... 19 Figure 3: Census villages in Vellore taluk (Tamil Nadu, India)
from the 1981 Census map... 20 Figure 4: From many sources to the SIFP database... 21 Figure 5: Registration points to join the topographical and
Census maps (Figures 2 and 3)... 23 Figure 6: 1991 Census localities (villages) and urban areas along the
Karnataka-Kerala border ... 25 Figure 7: The SIPIS software and database ... 28 Figure 8: The South India web atlas ... 31 Figure 9: Coefficients of variation of three variables classified by average
population size of villages... 34 Figure 10: Division of South India into 20-km clusters ... 37 Figure 11: Mapping fertility data in North-East Andhra Pradesh: original
villages, cluster aggregation, kriged estimates and final contouring... 40 Figure 12: Topographical cross-section of the forest trek and
Figure 13: The road network leading to Sabarimala from Madurai,
Tamil Nadu (sources: Dinamalar, 29/10/2000) ... 51 Figure 14: The road network leading to Sabarimala from Madurai,
Tamil Nadu (previous map translated in English)... 52 Figure 15: Geographical origin of Sabarimala pilgrims
from Tamil Nadu ... 59 Figure 16: Two graphical representations of pilgrim flows
to Sabarimala... 60 Figure 17: Main routes leading to Sabarimala ... 61 Figure 18: Irrigated land as percentage of cultivated areas
in South India, 1991 ... 66 Figure 19: Child sex ratio (below 7), Tamil Nadu taluks
(rural data), 1991 ... 72 Figure 20: Child sex ratio (below 7) in rural South India, 1991 ... 74 Figure 21: Child sex ratio (below 7) in rural Tamil Nadu, 1991 ... 76 Figure 22: Medical infrastructure and population size
in Andhra Pradesh, 1991 ... 80 Figure 23: Medical infrastructure in Andhra Pradesh mandals, 1991 ... 81 Figure 24: Modernization index and distance to the nearest town... 88 Figure 25: Modernisation index and distance to the nearest town
classified by town class ... 90 Figure 26: Modernisation index and distance to the nearest town
classified by town status... 91 Figure 27: Distribution of distances between localities, 10-km clusters,
South India ... 95 Figure 28: Moran's I for fertility and density, 10-km clusters,
South India, 1991 ... 96 Figure 29: Moran's I for fertility and literacy, 10-km clusters,
South India, 1991 ... 97 Figure 30: Moran's I for fertility and other indicators, 10-km clusters,
ACKNOWLEDGEMENTS
The first half of this paper describes the constitution of the large-scale spatial database of the South India Fertility Project (SIFP), coordinated by C.Z. Guilmoto. The applications presented in the second half are derived from complementary projects accommodated in the “Population and Space in South India” programme of the Department of Social Sciences of the French Institute of Pondicherry.
These projects have benefited from various sources of support, mainly the French Institute of Pondicherry (FIP), the French Research Institute for Development (IRD) and the Wellcome Trust (London), which financed the SIFP and made possible the whole enterprise. Additional support came from the United Nations Population (New Delhi) for the SIPIS and from the CNRS for the EMIS team, as well as from the Franco-Indian exchange programme (French Ministry of Foreign Affairs and the Indian Council for Cultural Relations) and from grants provided by Aires Culturelles (French Ministry of Education) for the sojourn in India of doctoral students in the team.
We particularly thank S. Vingadassamy and R. Amuda for their crucial support in Pondicherry during the constitution of the database. We have also benefited from the assistance of Bertand Buffière, Véronique Joseph, Karine Keraudy, Sangee Patel and Joe Vimal Raj, as well as from the entire team of the Department of Social Sciences. Finally, our thanks are extended to Frédéric Landy for his attentive reading, enabling us to improve a preliminary version of this text.
INTRODUCTION
If we call to mind in the preliminary remarks to this article the fact that the
modus operandi of research has to do both with the imperatives of scientific
inquiry and with the relative fortuity of available information, it is because while investigating material for a new study concerning the decline in the birth rate in India, the first author discovered virtually by chance the existence of a previously unpublished database which, as it contained information that could be employed in research on fertility in India, was to serve as a source for the projects described here. In fact, several years subsequent to the undertaking in 1991, the administration of the Census of India decided to make a large part of the results available to the public in a digital format. Among the results were files containing information relating to villages and towns that were later chosen for publication in the Census
Handbooks by district1. This new form of diffusion of results of the Census
of India itself represents a small revolution in a country where statistical information is undoubtedly as rare as it is difficult to access and, for this reason, is very dear from all points of view2.
Taking this potential statistical windfall into consideration, the constitution of a large regional data bank was foreseen, to be built up by collecting primary data so as to avail of a base including all the villages and towns of the chosen states, namely, Andhra Pradesh, Karnataka, Kerala and Tamil Nadu, to which the districts of the Union Territory of Pondicherry were added. A few days later, an equally fortuitous discussion with a few colleagues intrepidly setting about an Indian geographic information system (GIS) led to a broadening of the approach to the spatial dimension: if it were possible to georeference these census units, one would avail of a formidable tool for examining the results of the last Indian census. In this way, beyond the study of the spread of the fertility decline in South India, the data and the
1 The District Census Handbooks are published on the occasion of each decennial census in
English and Hindi for each district in India (466 in 1991). Their publication occurs very belatedly, often just prior to the following census, and the 1991 census did not depart from this rule, not withstanding the new information contained.
2 An illustration of these remarks is the recent introduction of an Indian web site very rich in
statistics of all types (www.indiastat.com). Users must, however, pay relatively dearly for access to data that are for the most part taken from government statistics and are thus supposed to be in the public domain (such as statistics from the Census of India).
T e c h n o lo g ic a l a d v a n c e s in G IS /M a p p in g A v a ila b ility a n d re le v a n c e o f lo c a l c e n s u s d a ta T h e o re tic a l in te re s t in s p a tia l p a tte rn s In te re s t fo r s p a tia lly u n e v e n d e v e lo p m e n t in In d ia S p a c e a s s p e c ific fie ld fo r re s e a rc h N e w c a p a c ity to a n a ly s e m ic ro -le v e l d a ta S IF P D a ta b a s e
techniques henceforth available would make it possible to conceive of an exhaustive approach to the socio-economic situation in South India, from both a statistical and a spatial point of view.
Figure 1: Technological, theoretical and scientific environment of the SIFP project
This initiative did not take place in an adventitious scientific environment. Rather, it is understandable in terms of a progressive development of ideas, techniques and needs that developed in the course of the 1990s. Figure 1 recapitulates this situation in the form of a chart summing up the environment of this period. Three main phenomena come together: the technological advance of geographic information systems in the last ten years3, the increasingly wide circulation of micro-level data and renewed interest in spatial questions. The first two phenomena have led to the confluence of new processing tools and new data: the data from the Indian census of 1991, henceforth available in computer format, could also be used on the micro-level for cartographic or statistical purposes. This
3 For general presentations of the application of GIS in the spatial analysis of social data, see
represented an innovation in India, where cartographic productions are very limited in number and almost never venture below the level of the district.
The GISs have gradually become more widely available, having become less costly and above all more easily accessible for non-specialists in India. The concurrence of the development of GISs and the renewed interest in spatial phenomena (illustrated, for example, by the new economic geography) has led to the consideration of questions that were in the past more or less theoretical and inaccessible for purely technical reasons. GISs, by making cartography and spatial analysis more easily accessible, have made it possible for long-standing or new questions to find application support. In countries such as India, this provides in particular the opportunity to closely analyze inequalities in economic and agricultural development, and even to disaggregate large-scale datasets, which observers can use in order to discover the exact geographic contours of social change. The rapidity and the vigour of contemporary transformations contribute, in fact, to the continuous redrawing of the map of India.
The SIFP thus represented a logical outcome, around of research themes, the existence of previously unused data and the advances in the technology of spatial processing (computer-assisted cartography, GIS, geostatistics, etc.) that is still only in its inception. The impulse given by the theoretical reflection on questions of fertility, notably the debate between the structural factors in fertility decline and the mechanisms of diffusion that occur together with it (see Casterline, 2001), was certainly central, but the extension to other applications derived from economic or geographic discussions has proved to be just as logical, enriched by individual initiatives that are at times removed from the initial demographic issue, as the following illustrations will show. The French Institute of Pondicherry, with a long tradition in the cartography of vegetation in South India, was the ideal site for such a project and all the participants owe much to its support, whether direct, in the form of financial support to researchers and students, or indirect, by providing to all a place of encounter and development.
This volume retraces the main stages of the SIFP project and its diverse avatars, illustrating our topics with numerous maps and documents. Rather than restricting ourselves to the concrete results of the analyses, we have chosen here, in order to make the material more instructive, to present the successive technical phases in greater detail. They bear witness to the difficulties already forgotten by those who design models in the affluent countries, with a wealth of old, and often systematic, spatialized databases,
but these very difficulties await all projects concerning the developing countries. While it is true that the statistics may often be lacking or seem to remain under-utilized for manifold technical reasons, the geographic resources are even more deficient and only an infinitesimal part of them is today available in digital format, and consequently utilizable by the GISs.
In absolute terms, it would be easy to set ourselves ambitious goals as regards the geographic coverage, but the tedious work of statistical and geographic data acquisition, which is indispensable for the realization of such projects, sometimes tends to make them truly impracticable: a number of GIS projects which should facilitate the publication of an atlas or serve as the base of a web site ultimately never see the light of day and the money swallowed up in these projects results in nothing more than a few maps which could have been drawn by hand and with less cost, without mobilizing the GIS technology. However, in the era of the study of social transformations, which are sometimes more rapid and more dramatic in the developing countries than elsewhere, the geographic approach often stands out as a key to the reading of these mechanisms and it is urgent that the technological effort be channelled in this direction by setting reasonable objectives. We hope in this document to illustrate the cumulative and diversified advantage that this enterprise can provide when it attains its goal, in this case the establishment of a geo-demographic database of the whole of South India based on the disaggregated census data.
1
A GEOGRAPHIC INFORMATION SYSTEM
FOR SOUTH INDIA
Georeferencing South India4
From the census, which provides village-level data every ten years, to the large surveys such as the National Family and Health Surveys (dating from 1992 and 1998) or those of the National Council for Applied Economic Research, the statistical data in India cover almost all demographic, social and economic aspects of the society. Notwithstanding this apparent profusion, precise geographic utilization and cartography on a small scale are still rare, or indeed nonexistent.
Thus, one often finds studies made at the district level, but applications on a lower administrative level are more seldom and more limited in space. Specifically cartographic studies on the village level, apart from monographic approaches, are absent from scientific production.
This absence can be explained by the lack of detailed and accessible cartographic coverage. Cartographic sources can be classified according to two major types. On the one hand, there are the sources that provide general coverage of the territory on different scales. These sources originate from public bodies or private publishers. On the other hand, there is the production of town maps stemming from governmental planning bodies or map merchants. Although this second category of maps does not interest us here, the recent high-quality publications by the Eicher Company of maps based on satellite images for the cities of Delhi, Chennai, Bangalore and Mumbai should be mentioned, as they foreshadow a new era of cartography in India.
The production of maps covering the entire territory of India is the responsibility of the Survey of India. The latter, created by the British, is a
4 Section written by Christophe Z Guilmoto and Sébastien Oliveau. An abridged version was
derivation of the military administration. The map was a strategic object and its public diffusion was prohibited until the beginning of the nineteenth century5. Still today, the production of maps is a matter of the state, and a series of places held to be sensitive continues to be excluded from cartography, among which are hydroelectric projects, dams, steel plants, installations under All India Radio, telecommunication installations and water purification/supply installations, etc. Moreover, for a coastal strip of more than 50 km inland, the obtaining of maps classified as “restricted” is subject to special requests to the administration of the Survey of India6. To
give an example, a map from 1973 on a scale of 1: 50,000 concerning the area surrounding the town of Dindigul (200,000 inhabitants, Tamil Nadu, located 140 km from the Coromandel Coast) is classified as “restricted” because of its proximity to the coast. For certain littoral states, such as Kerala, topographical maps are not officially available and nearly half of the contemporary maps comprising the South Indian peninsula are therefore “restricted”. Voices are today being raised in the Indian milieu of professional cartography to denounce the restrictive policies pertaining to 227 of the 385 “degree Toposheets”. Thus the journal GIS@development published in Delhi is a forum of professional users that regularly evokes the shortcomings of a policy that can appear outdated. Scientists and professionals are also unanimous in demanding profound changes in the policy of access to topographical information. We will mention in this regard a large meeting held in July 1999 at the Indian Academy of Science in Bangalore devoted to “public access to Indian geographical data”. A large number of papers presenting important material for the discussion was then published in the journal Current Science (25 July 1999) and subsequently also taken up in the national press.
In the meantime, the production of the Survey of India remains the only official source in India from which the rest of the maps are derived, for example, the atlases of the NATMO (National Atlas & Thematic Mapping Organisation). The maps presented by the Indian census, such as those of the
5 For a general history of cartography in India, one can refer to Madan (1997). For the setting
up of the Survey of India, the work by Edney (1997) can serve as reference. Regarding the context surrounding the creation of the Survey of India and the first prohibitions of the diffusion of maps, the recent article by Raj (2003) is of interest.
6 The request form of the Survey of India – Form 0.57(a) – for “restricted” maps contains
notably the following clause: “Clearance of the Ministry of Defence is essential for the issue of Restricted maps to private individuals, organizations and commercial firms”. It also specifies that the loss of the map must be notified to the Ministry of Defence, etc.
taluks contained in the District Census Handbooks, are also based on the maps of the Survey of India: their distribution is quite wide because of the hundreds of volumes of the census that are published, but the geographic quality of these maps remains mediocre, for they contain neither absolute location7 nor scale. What is more, much information of a topographic nature is also missing from these maps. On the other hand, they show the individual location of all the towns and villages and, for this reason, are unique in India. In fact, the toposheets, when they are available, are far from containing all the localities included in the census tables and do not always enable the identification of inhabited places, as our work showed us.
The public thus avails on the Indian scale of two official sources: the first is that of the toposheets that present all the necessary details for geography, but suffer from an incomplete coverage and are sometimes not updated or unavailable. The second source is that of the villages represented in the census maps: this covers all the administrative units, but does not make it possible to georeference them so as to be introduced in a GIS. In practice, to exhaustively collect the census maps or the toposheets is often a challenge, the one or the other being very difficult to procure, as a visit to a regional headquarters of the Census of India or of the Survey of India readily shows.
One understands better why the private publishers in their turn have been able to diffuse their products, from specialized web sites to pavement stalls in the large cities, notwithstanding the often very mediocre quality of their maps and the perfunctory character of the information they contain (roads and principal localities)8. It is in this context of semi-penury, in which cartographic information exists but is dispersed and of terribly inconsistent quality, that new suppliers have arrived on the market. A web site such as www.mapsofindia.com is an interesting example, for it offers via Internet
7 Here one opposes the absolute position in terms of longitude and latitude, which is at the
basis of the work with geographic information systems, to that of relative position, which situates the map in a space of vicinity by indicating the boundaries of borderland units.
8 We can quote in this regard several evaluations by the Survey of India concerning the
quality of commercial maps: “Some publishers have no idea of map projection and its significance. […] Spelling of names is incorrect. […] Colour schemes are crude and unsuitable. […] Over-generalization has caused the loss of the character of detail. […] The boundary symbol is drawn so thick that small kinks and bends are lost. […] Symbols differ in different parts of the same map. Printing is poor. Quality of paper is not good. […] Some maps do not indicate the scales to which they are drawn”. (excerpted from http://www.surveyofindia.gov.in)
district-scale maps of an unfortunately rather questionable quality from a geographic point of view. A general coverage of the country by maps that are less precise than those of the census, but of better quality than the maps offered by other private publishers, facilitated a considerable development of their diffusion, and this enterprise today provides its products in the form of CD-ROMs or offers them for sale on the web (after a long period during which they were gratis). In technical terms, the quality of these maps remains, however, quite uneven.
The demand for good quality cartography is becoming increasingly important in India, all the more so as at the same time a significant tourist activity is developing, which is known to make extensive use of maps. Moreover, Lonely Planet, the well-known tourist guide company, decided to update its Road Atlas in 2001 (first edition 1995). The work, which exceeds 100 pages, constitutes the best cartographic source at 1:250,000 currently available on the subcontinent. It combines information on relief and hydrography with the main towns and villages, as well as more general information (cultural sites, beaches, wildlife sanctuaries, airports, etc.).
Coming back to our project, the establishment of a geographic database in 1998 was not exactly an easy matter. As we have mentioned, there were hardly any sources making it possible at the same time to locate all the villages and to georeference them, apart from the fragmented information provided in the toposheets. It was therefore necessary to envisage a strategy adapted to the different available sources. An initial solution thus consisted in resorting to the toposheets, including British maps dating from colonization when they proved to be of easier access than the modern toposheets with a restricted diffusion. It may seem ironic to use old maps for a contemporary cartography, but this paradox illustrates the still outdated character of the production and diffusion of Indian cartography. Hence, a certain number of maps used data from the beginning of the twentieth century: Figure 2, for example, represents a topographic map dating from 1914-15, corresponding to the region of Vellore in the state of Tamil Nadu.
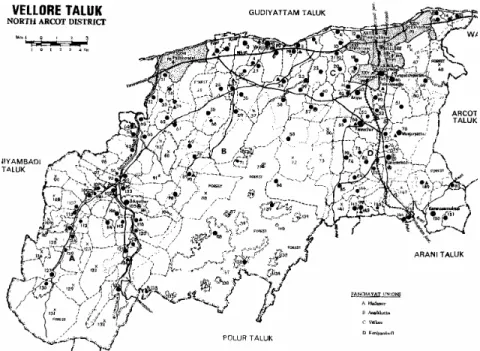
The second solution resides in the utilization of census maps, available at the level of each taluk or tashil, as we mentioned earlier. These maps offer the advantage of providing an exhaustive location of all primary units of the census, namely the revenue villages, administrative units that can comprise several distinct hamlets. They remain, nevertheless, rough (Figure 3) and in particular do not allow a direct georeferencing in the absence of geographic
coordinates; for this reason, a meticulous work is required to piece together information. It will be noted that the maps are often published belatedly after the census, the last publications for the 1991 census dating from August 2000, which does not facilitate the task.
Figure 2: Topographical map of the Vellore region (Tamil Nadu, India), 1914-15
Figure 3: Census villages in Vellore taluk (Tamil Nadu, India) from the 1981 Census map
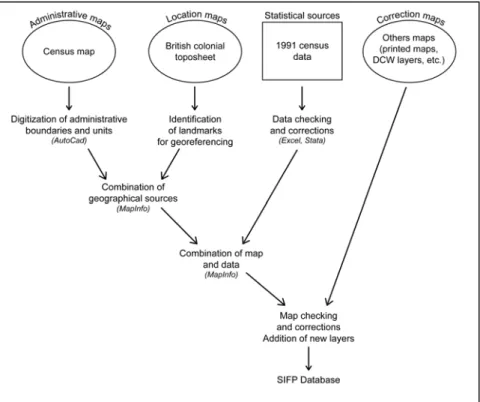
In view of the scope of the work, the establishment of a georeferenced database proved to be a long-term task, which is summarized in Figure 4. The apparent simplicity of the diagram should not mislead as to the difficulty of the operations, the major stages of which will be presented.
The first stage consisted in capturing, with the help of 712 taluk maps provided by the census, the location of villages and towns. The operation of assembling and keying the digitized maps was undertaken with AutoCad software (computer-aided design software). The absence of maps or of volumes for 1991 often made it necessary for us to utilize the data from 1981, which had to be updated later by the addition of villages newly included in the subsequent census. The 76,366 administrative units (75,523 villages and 843 towns) were entered with the same software. One of the major decisions when drawing up the database concerned the mode of representation of the villages. The primary maps of the census provided the detailed demarcation of the boundaries of each village, corresponding to
what one terms in GIS jargon a “polygon”. However, it was decided to simplify the data entry and to digitize each village in the simple form of a point, while the boundaries of urban agglomerations would all be captured in polygons. There were several reasons for this choice.
Figure 4: From many sources to the SIFP database
First, the boundaries of villages provided by the census did not appear to be reliable and were sometimes so badly represented on the primary maps that they were not digitizable. Comparisons between the areas of the villages given by the census and measured by the GIS showed, moreover, the unequal quality of this information. Then, the future evolution of the database was judged to be easier if the village units were represented by points than if they were to be represented by areas. In fact, the appearance or disappearance of a new administrative entity is expressed by the appearance or disappearance of a point. Thus, the overall cartography hardly changes. On the other hand, in a polygonal representation, the least punctual change
necessitates the modification of all adjacent units. Furthermore, on the scale of the whole of South India, the cartographic representation of village boundaries would not be possible and it would require such a level of generalization (i.e. simplification) that automatic tessellation (i.e. partition into a pattern of interlocking shapes) of point patterns would provide comparable results. And, to conclude in a prosaic manner, the initial capture by polygons rather than points for each village would have required an effort ten to twenty times greater than the capture by points and, on the scale of more than 50,000 villages, this difference is not without consequence in terms of time and budget.
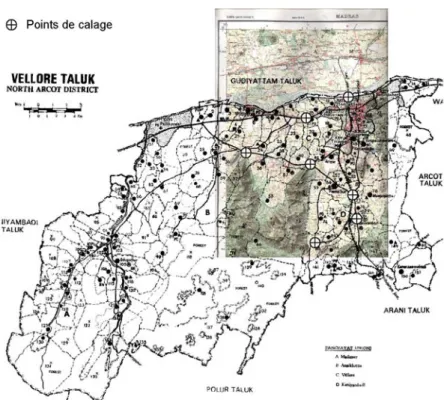
At the same time, the operation of locating control or registration points, which constitutes the second stage, was done manually on the old British toposheets to enable future georeferencing of maps captured with AutoCad. Maps without geographic reference points are, in fact, unusable in a modern GIS. The difficulty thus resided in the identification of registration points that would be present on the different maps at our disposal and, when our sources dated from the colonial period, sometimes would not have changed between the beginning and the end of the century! These points (“points de calage” in French) make it possible to register a map derived from the census maps and therefore initially devoid of geographic coordinates, as shown in Figure 5. They mostly consisted in bridges, intersections of roads and railway lines or other noteworthy and reputedly fixed points. Once the entire set of census villages and towns were digitized and georeferenced for each taluk, it was necessary to assemble the maps of the taluks beside each other in order to reconstitute a coherent overall map without overlap or gap between the taluks. This required global geometric transformations (using a technique know as “rubber sheeting”) for an even fit.
The first test was initially conducted on the district scale (that of Vellore appearing on the preceding maps) so as to validate the capture procedure and the quality of statistical information connected with the census of 1991 (Oliveau, 1998). The result having been positive, the data entry of all the villages began. After two years of preparation, the 76,366 units captured with AutoCad were gathered in a GIS integrating the whole. The georeferencing was done with MapInfo, the software that appeared to best perform this meticulous work without needless efforts.
Figure 5: Registration points to join the topographical and Census maps (Figures 2 and 3)
While these capturing operations were going on, work on statistical preparation and verification of census data took place. The data, provided by the Census of India in the form of more than 400 files in Dbase format, were assembled in Stata software. This control work9 brought to light numerous statistical problems, which had to be corrected: missing data, inconsistencies, repetitions, etc. To this purpose, we used upon the various volumes of the District Census Handbooks, including volumes from 1981 when those from 1991 were not yet available. When the data correction had been completed, it was necessary to connect the census statistics with the spatial units in the GIS. Linking up the villages from the census tables with the GIS locations gave rise to further difficulties. Thus, numerous villages
9 This work was in particular carried out by Bernard Buffière and Véronique Joseph
were absent from the maps and this was particularly the case in tribal zones inadequately covered by the administration. What is more, the English transcription of the local names (four principal languages and alphabets co-exist in South India) created numerous ambiguous toponyms. Good knowledge of the field by the technicians and verifications with the regional census offices mitigated part of these problems. In general, 95% of the villages were processed without difficulty on the basis of available information and could be unambiguously located. Among the remaining cases, 95% were in their turn corrected by a more attentive examination of the sources and a specific correction: written form of the name, geographic position, data, etc. However, for the hundred or so villages remaining (5% of 5% of 75,000 villages), the marginal cost of the processing can become truly prohibitive: it would have been virtually necessary to go there with a GPS (global positioning system) and a team of researchers, a proposition considerably beyond the possibilities of our project. Depending to the given case, it was thus necessary to aggregate them with the neighbouring villages, locate them in an imprecise manner, or indeed eliminate them from the base when the data were too defective.
An example of the GIS obtained is seen in Figure 6, which represents the border between the states of Kerala and Karnataka. The unequal geographic distribution of villages will be noticed, very dense in the Mysore region of Karnataka and much more spaced out in Kerala, in which the population is on the contrary characterized by very populated “villages” and a very open settlement. With the help of other cartographic sources (most notably data from the Digital Chart of the World, also known as DCW10), we were able to verify the quality of the georeferencing and integrate new information. Additional layers of information were progressively incorporated.
The final database, unique in India by this granularity, thus offered an incomparable mine of information covering the four states of South India: Andhra Pradesh, Karnataka, Kerala and Tamil Nadu, as well as the Union Territory of Pondicherry. A few figures summarize the extent of the system: the area covered is of the order of 636,000 km2, for a population of
223,384,786 persons in 2001, distributed over 75,523 villages and 843 urban
10 The Digital Chart of the World is a geographic database on a world scale. It was developed
by the ESRI enterprise for the cartography agency of the American defence. The primary source is the ONC (Operational Navigation Chart).
units (in 1991). With each administrative unit, 130 attributes are connected concerning socio-economic data (literacy, professional activities, etc.) and some forty attributes concerning village infrastructures and land utilization. In addition to these layers on village and urban scales, the data at the level of taluks and districts were aggregated for wider studies. By the same token, a layer pertaining to road and railway networks was added by crossing available information in the census and in diverse private maps. The hydrographical coverage (notably with the help of the DCW) and data pertaining to altitude were also incorporated.
Figure 6: 1991 Census localities (villages) and urban areas along the Karnataka-Kerala border
An important point is worth noting. While the GIS thus created is already relatively large, it was conceived so as to be able to be updated and completed later. A first updating began with the publication of data from the 2001 census. The first results concerning the districts and towns have appeared and have been integrated. But the georeferencing also makes it possible to integrate other sources such as maps in vector format (for example, the DCW), raster or satellite images. However, in conclusion, we should mention several of the limitations of the exercise, which are of three types.
As the information could not be produced in real-time and the sources were all the same limited, the data and the raw census maps were already seven years old at the start of the project. They were over ten years old at the end of the project, and that constitutes a first limitation of their utilization. Local situations have of course evolved, and this is all the more true as infrastructures and demography are particularly dynamic dimensions in South India. Thus, for example, the coastal road that, since 1999, links Chennai and Pondicherry and numerous access roads today bypassing agglomerations are absent from the originally utilized maps.
As the census is the only exhaustive source at the village level, the second limitation resides in the unique source of data. Possible verifications and corrections are limited. We have carried out a series of statistical and logical tests on the data as well as cross verifications between digitized data and printed publications, when they were available. The final statistical base of the South India Fertility Project, while it was not perfect, is somewhat better than the census publications. On the other hand, there exists no other statistical data at the village level. It is therefore not possible today to enrich our base with other information, if not by the incorporation of specific data gathered in the field (and consequently geographically very limited).
The third limitation is of a cartographic order. Since the sources are diverse and sometimes of middling quality, the final error in precision, based on verifications made in the field with a GPS, is less than 500 metres for a territory extending over some 1400 kilometres from north to south. It is often less than 250 metres, but unforeseeable occurrences are probable, such as in badly covered forest regions. The general precision of the database remains satisfactory and allows a spatial processing that we perform (cf. infra). Moreover, it should be pointed out that computerized cartographic sources pertaining to the Indian population are nearly nonexistent. A source such as the DCW is less precise (its definition is of 1:1,000,000), older (the surveys for India date from the 1970s) and contains more errors: location by means of satellite images does not “see” the infrastructures existing beneath vegetation (roads in forests or bordered by trees), just as it is not able to differentiate abandoned infrastructures from those still in use11.
11 As concerns the quality of the DCW and the limitations to its utilization, see Kraak and
Sharing the data: CD-ROM and Internet
Once the database had been built, its use began in a systematic manner in the framework of the scientific projects described below. At the same time, the team soon received frequent requests for geographic and statistical information of all types. Requests came from other researchers, but demand was greater in the Indian society (NGOs, administrations, private enterprises). In addition, as all the data utilized came from the public domain, it seemed fitting to return this information to the citizens. It thus appeared to be necessary to make our research material available to the greatest number, but in a form that could be utilized by everyone. To do this, it was first necessary to envisage a mode of diffusion and tools for exploring the data that could satisfy such varied users.
The reconstitution of this data encountered diverse problems. Thus, the enormous mass of data precluded that it be made available on the Internet in its entirety, unless the consultations were limited to very reduced samples or to very well equipped users. By the same token, making the raw data available did not seem to be satisfactory owing to the fact that the public having the means to process it was restricted, first, because GIS software is costly, and then because it is complicated.
To mitigate the problem of the volume of data to be transmitted, a CD-ROM was chosen as the medium. This makes it possible to store the complete database and to add to it a few supplementary maps prepared for the occasion. A mini-GIS capable of mapping and exploring the data was included on the CD-ROM.
This CD-ROM project, supported by funding from the United Nations Population Fund (UNFPA), was entitled South India Population Information
System (SIPIS). The state of Tamil Nadu was chosen for this project, as the
four states could not be treated of concurrently because the processing capacities of personal computers at that time were not sufficient (and just about are today). Begun in January 2000, the finalization of the CD-ROM and the software lasted less than one year because the database had nearly been completed.
In order that the greatest number of users could employ this tool, efforts were above all made to develop a user-friendly tool enabling one to move easily from the data to the maps. From the point of view of geographic
information, this project necessitated the production of new data calculated on the basis of the raw data of the census so that the end-user need only press a button to obtain structured information, such as a literacy index or a map of administrative boundaries. All the statistical information was brought together in large families (social, economic, employment, infrastructure data, etc.). Likewise, a few systematic maps are provided in raster format (literacy, fertility, etc.) to assist the user in identifying regional tendencies.
Figure 7: The SIPIS software and database
Figure 7 presents a map drawn by means of the SIPIS. A map of the labour force in the secondary sector at the taluk level is shown, with the layers of urban areas and roads as well as the demographic data for a particular unit, in this instance the taluk of Vedaranniyam (which is incidentally the first place from where Lord Rama is said to have attempted to reach Lanka). The software programming was done with tools developed by ESRI. For this reason, the cartographic functions of the SIPIS interface resemble those of the existing software Arc Explorer developed by ESRI. However, the interface was simplified so as to make it
usable by untrained persons. A few options were added, notably a help window in Tamil language.
In this connection, it should be noted that the realization of a Tamil version of the SIPIS proved to be impossible, and this was a source of disappointment for the authors. The first reason was due to the difficulty in composing a GIS menu in Tamil because of the total absence of corresponding nomenclature in that language. But more prohibitive was the impossibility of finding an exhaustive list of villages in the Tamil language, something that cannot fail to appear paradoxical in a region characterized by a relative linguistic nationalism. Although some lists of villages exist (the directory of post codes, for example), they do not correspond to that established by the census. The best multilingual lists of villages date from the colonial period (Alphabetical List of Villages in the Taluks and Districts
of the Madras Presidency, 1933): they of course do not correspond any
longer to the present village grid. Moreover, it would be very hazardous to transcribe in Tamil the list of the Census of India (available in English) as ambiguities and errors in transcription are numerous.
The resulting CD (Guilmoto et al., 2000) was very favourably received, all the more so as the subsidy by the UNFPA made a low sales price possible. The magnitude of the orders for the SIPIS from the French Institute of Pondicherry confirms the foreseen demand. The choice for the diffusion of this database would therefore appear to have been judicious, but the medium of diffusion still retains several limitations. First, once the information has been written on the CD-ROM, the product is completely finalized; with the appearance of the next census, an update will be wanted. It would thus be necessary to recommence the operation. The second limitation of the CD-ROM pertains to the physical media of information (such as printed works), that is to say, problems of diffusion: availability at all places at any given time is not possible. Finally, and this is a major point, the software content, although it was made as user-friendly as possible, nevertheless leaves the user alone faced with the interpretation of the data. A further limitation, which is technical, is that the introduction of new versions of Windows, incompatible with the earlier ones, has undermined the diffusion of the software.
Encouraged by the success of this first evaluation by the wider public, we have considered the diffusion of previously processed geographic
information. In addition to the raw information diffused by CD-ROM, why not attempt to offer to the public information prepared by the researchers and briefly explained? The idea of producing an atlas naturally arose. The superiority of an atlas over a data bank for the diffusion of geographic information is of two types: graphic and scientific. Graphic, of course, because the processed information is directly readable; the maps are made by researchers who master the tools of cartography and the method of structuring information. And it is scientific because the information is selected; the researchers have chosen the maps to be presented according to their interest and following a thematic classification. Furthermore, the maps are explained, restored to their contexts12.
This atlas could have seen the light of day on paper, as all traditional atlases, or as a CD-ROM, as is increasingly seen today. But these two forms suffer from the same limitations: impossible to update, cost of production and diffusion. The Internet, a free13 and decentralized medium, thus seemed to be the perfect tool for our objective: to diffuse free of charge and as widely as possible the information produced by the researchers. We therefore adopted the project of an online atlas.
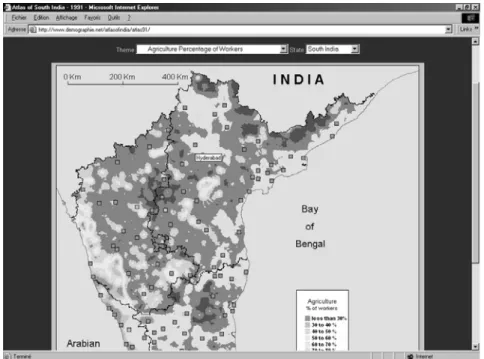
Other than the lower cost, which we have mentioned, the realization of an online atlas has other obvious advantages. Thus, the accommodation capacities in terms of the number of maps are nearly unlimited. Then, a later update (with data from a new census, for example), as and when new maps are published, is possible. Finally, the comparison of maps is simplified, as one is able to vary the scales (a local phenomenon can be situated in the state in which it appears or viewed on the scale of South India) and the themes (on the same scale, one can move from the fertility map to the literacy map, then to gender inequalities, etc.). Figure 8 shows a screen from the site (www.demographie.net/atlasofindia), representing the distribution of primary sector employees in South India.
12 Various researchers of the team have joined colleagues (F. Landy, O. Aubriot, M. Thanuja,
and C. Garcia) who have undertaken to write commentaries to the maps corresponding to the areas in which they specialize.
13 Free for the user. Even though relatively low, the producer bears the costs inherent in the
Figure 8: The South India web atlas
But the establishment of this online atlas gave rise to new technical problems. The first concerns the general structure of the atlas. The 100 available maps must be gathered together thematically. In addition, the regional division was retained. The selection of the geographic entity is made by a simple click on a pull-down menu at the chosen level: South India, Andhra Pradesh, Karnataka, Kerala, and Tamil Nadu. A second concern while realizing this atlas was to enable access to persons using an Internet access with a low rate, as is the case in India, without however sacrificing the quality of the maps. Technical choices of two types were made. First, the programming of the site was done in the least demanding manner possible, without using the undoubtedly comfortable, but user contingent, techniques of resources such as the latest cartographic servers. The HTML language, simply programmed, was therefore retained. This makes it possible to limit to the maximum extent the size of the files generated. Then, and without abandoning the quality of the maps, we opted for a graphic format reducing the size of the images generated. The format of the images adopted is the GIF, one of the characteristics of which is the
encoding in 256 colours. This lightens the weight of the maps, but entailed long phases of experimentation and the image visualized on the GIS software underwent numerous transformations before being published on line.
We shall conclude by recalling that there are no perfect methods in the matter of diffusion of spatial databases. Nevertheless, and according to the objective, solutions do exist and they are efficient. Finally, the utilization of two complementary supports, CD-ROM and online accessibility, made it possible to obtain an interesting result: making available to a large public information that had until then been reserved for well-informed professionals.
From villages to spatial clusters
The phases described up to now would almost cause one to forget that the initial project was not conceived to constitute and make available an abundance of documentary material. On the contrary, this development is only a secondary product, for the endeavour of the participants in the project aimed above all at enriching the issues proceeding from the spatialization of social change in India. As soon as our geomatic tool had been put in place, the volume of information suddenly proved to be too large to allow for efficient utilization in a research objective. We had in effect a spatialized base numbering more than 75,000 villages and provided with some 100 indicators. Such a collection of localities can hardly be mapped, if not on a micro-regional scale, for the quantity of information does not fit on a map of standard size. From a strictly visual point of view, several thousand localities are not really discernable. The maps would be unreadable and the statistical or geostatistical (see below) analyses would, moreover, often be impracticable for sheer computational reasons.
Table 1 enables a rapid examination of the database for South India. Let us first note that the number of villages in our base is slightly less than that of the figures published by the Census of India because we had to aggregate more than 100 villages (137) in Andhra Pradesh. This difference in the number of villages, less than 0.2% of the total, is due to our reclassifications and diverse corrections undertaken when the consolidated statistical base was created and during its spatialization in the GIS. It should be observed that these villages, in general with a very low population, are in the main located in the tribal parts of Andhra Pradesh where their location
has not been identified. These are often not permanent settlements. Moreover, some are absent on other published maps because they are sometimes situated in regions more frequented by Naxalite groups than by agents of the state.
Table 1: Villages in the SIFP database Census of India SIFP dataset Population State Inhabited Census Villages Number of Inhabited
Villages population Average deviation Standard
Number of Uninhabited villages Andhra Pradesh 26586 26449 1838 2202 1411 Karnataka 27066 27066 1147 1402 2131 Kerala 1384 1384 15475 8182 0 Pondicherry 263 263 1105 1240 1 Tamil Nadu 15822 15822 2325 2588 958 South India 71121 70984 1946 3034 4501
Note: Means and standard deviations computed on inhabited villages
Sources: Official data from the Census of India are from Office of the Registrar General (1997)
The primary units in the census correspond to a very disparate assembly of “villages”. The table indicates in this connection the number of villages by state and their average population. One will note the considerable differences, as for example between Karnataka (mean population of the villages = 1402 inhabitants) and Kerala (8182 inhabitants). In terms of the variation in demographic sizes, South India appears to be very heterogeneous as the standard deviation is 50% greater than the average population, which expresses the considerable differences prevailing among the regions of the south. These variations remain large within the states, notably in Andhra Pradesh and in Karnataka, where the villages are generally of very small size. In the two latter states, more than 10% of them contain less than 100 inhabitants, corresponding therefore more to hamlets than to villages strictly speaking. Conversely, several hundred “villages”, located above all in Kerala, exceed 10,000 inhabitants. One will also observe that in this case, the administrative grid (that is, the density of census villages) is far from reflecting the density of the population.
0 0.5 1 1.5 2 2.5 3 3.5 10 100 1000 10000
average population (log)
co ef fi ci e n t of vari a ti o n
Child woman ratio Literacy rate dalit
The administrative, historical or ecological variables that govern these regional differences could themselves be the object of a special study employing the SIFP base. But for our purposes, the size of the villages poses other problems. The first concerns the quality of the data that can be derived from these units. The second relates to the interregional comparability of these data. We will examine in the first place the question pertaining to the reliability of the data, and to this end we will examine the variability of certain indicators according to the size of the villages. We have grouped the villages in 100 classes of increasing population, beginning with the villages of smallest demographic size. Each class represents one hundredth of the sample, which means around 710 villages. For these hundred classes of villages, we have examined a given variable by calculating first its mean value, its standard deviation, and its coefficient of variation (computed as (standard deviation)/ mean). The coefficient of variation reflects the variability of the variable across its size class: if classes were random, variability would remain almost the same across classes.
Figure 9: Coefficients of variation of three variables classified by average population size of villages
The results presented in Figure 9 refer to three variables: the child-woman ratio (CWR), used as proxy for fertility, the literacy rate (population aged 7 years or more) and the proportion of Dalits (Scheduled Castes). The
values shown on the graph correspond to the variability (i.e. coefficient of variation) of these indicators according to the average size of the 100 classes of villages (omitting villages of more than 10,000 inhabitants). One will first note that the variability tends to diminish with the increase in the size of the villages, which confirms that the quality of the indicators improves for villages with the largest population. For villages with populations of less than 1000 inhabitants, the coefficient of variation is relatively high and this is still more striking for villages with less than 200 inhabitants. One will even note, for the CWR, a truly aberrant value for the fourth class of villages: this class includes, in fact, a village counting 22 children per woman, which results in a totally extravagant CWR value. This single outlier suffices to push the coefficient of variation of the CWR to a level of 1.7, which is thrice the mean value.
It can be reasonably assumed that the greater part of the variance observed in the small villages is above all due to disruptive effects of the small numbers rather than to real variations of the phenomena considered. This is perhaps less true concerning the Dalits: according to the severe spatial segregation which characterizes the village settlement, the minority Dalits are sometimes in an absolute majority in certain hamlets counted separately from the principal villages and this in part explains the strong variations observed in the small villages. But as regards literacy or the CWR, one much more suspects the effect of statistical variability characteristic of low population: the calculation of these indices on small numbers frequently leads to absurd values. Above 1000 inhabitants, this variability progresses much more slowly and tends to a minimal level that no doubt closely approaches the real variability of the considered variables. Without being able to draw an absolute limit, it thus seems reasonable to avoid treating of demographic units of less than 1000 inhabitants, because the smaller localities are greatly affected by statistical imprecision. The study of statistical robustness shows more generally that the indicators employed (rate, ratio or percentage) are dangerously unstable, or even devoid of significance, when the reference population was around 200 persons or less.
It therefore became necessary to adopt a procedure for aggregation so as to constitute larger populations. Different methods were considered, but it was soon evident that one could not make use of the administrative grid for reasons similar to those seen in the case of villages. The smallest units, namely the taluks, were not at all comparable in area or population from one state to another, as indicated in Table 1. In particular, the taluks had been
eliminated in Andhra Pradesh before the 1991 census and replaced by much more scaled-down units (the mandals), which are much smaller. While the
mandals are utilizable for comparative purposes in Andhra Pradesh (as
Virginie Chasles does below), it is not possible to compare them to the taluks of the neighbouring states, the average population of which is from ten to twenty times larger. Thus, 1513 sub-district units are counted in South India, but among them more than two thirds (1099) are in fact mandals in Andhra Pradesh, whereas Kerala contains only 61 (taluks).
It was also necessary to avoid ascribing an identical weight to each unit (i.e. each village) independently of its population, as is commonly done in the smoothing programmes contained in commercial GIS software. It would have been a serious error, of course, to estimate the mean of an area by simply averaging the values in the villages belonging to it. The highly variable size of the villages (in terms of population or of area, etc.) would have made the direct smoothing of the observed values aberrant, for it would have accorded an undue weight to the small villages compared to large villages.
We therefore decided to proceed to a group of villages based exclusively on a criterion of spatial proximity, independent of administrative borders, including those of the states. The usual method of rectangular grids seemed hardly appropriate because it would have had the effect of placing at a disadvantage the border zones, along the sea or southern borders, which had a size smaller than the standard rectangular grid. Introducing units necessarily smaller than the others in the administrative or coastal bounds would have created a spatial bias. We sought to find a grid constituted of comparable units of area by employing Voronoi polygons.
The agglomeration procedure was as follows. First, an aggregation point around the villages was automatically identified, after having fixed a maximal distance. The point obtained is the centre of gravity of different villages within the radius of fixed size. Starting from this first layer of aggregation points, a spatial partitioning was created in Voronoi (or Thiessen) polygons covering South India. These polygons are areas created around points, usually in the form of hexagons14. Without being identical,
14 This corresponds to a partitioning of South India with n aggregation points into n Voronoi
polygons such that: each polygon contains exactly one aggregation point as its centre and every location in a given Voronoi polygon is closer to its central point than to any other central point. About Voronoi polygons and aggregation procedures, see Pumain and Saint Julien (1997) or Martin (1996).
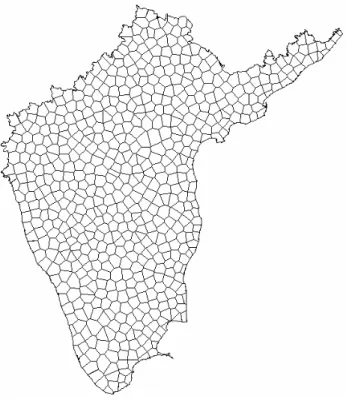
they have relatively comparable areas, also in the border regions of our maps of South India. By way of example, we reproduce the map of Thiessen polygons on the basis of aggregations of 20 km in Figure 10. South India is divided into 620 units of relatively homogeneous size (see also Table 2). The villages are grouped together within each polygon and the observed socio-demographic values are accumulated.
Figure 10: Division of South India into 20-km clusters
In this manner a series of “clusters” was defined, that is, groupings composed of a variable number of primary village units. The area of the clusters obtained is, as said, rather homogeneous. The socio-demographic indices are then recalculated within each cluster to obtain a global value. The same operation was carried out for four distinct sets of aggregation, determined by the distances of 2, 5, 10 and 20 kilometres respectively. The divisions into clusters obtained will be all the smaller given the fact that the distance of aggregation is reduced. This method, developed by
Christophe Z. Guilmoto, although in part empirical, is to our knowledge the best way to compose regular spatial divisions starting from a territory such as South India.
These aggregations considerably improve the quality of the statistics as the number of under-populated units is moderated, or becomes negligible. Thus, in the aggregation with a distance of two kilometres, the number of statistically vulnerable units of less than 200 inhabitants decreases from 15.8% to 2.1% of the sample. This proportion becomes truly negligible at higher levels of aggregation. As shown in Table 2, the number of units decreases, from 24,000 (for a distance of 2 km) to 7000 (for 5 km) to 2000 (for 10 km) and then to 600 (for 20 km) respectively, which makes all the foreseen mapping possible. It suffices to vary the level of aggregation utilized according to the scale retained, choosing notably the largest aggregations for the maps of the whole of South India. In the same way, thanks to this smaller sample of better quality, statistical and geographic modelling (see below) are now realizable in better conditions for calculation.
Table 2: Characteristics of villages and clusters
Cluster types SIFP villages 2 km 5km 10 km 20 km Number of units 70984 23848 6974 2151 620 Average area 784.8 2403 8309 26991 93643 Standard deviation 1185.9 2046 4153 8854 26123 Variation (%) 151.1% 85.1% 49.9% 32.8% 27.8% Average population 1946.6 5794.3 19814 64241 222877 Standard deviation 3035.0 6368 17961 53086 166218 Variation (%) 155.9% 109.9% 90.6% 82.6% 74.5%
Table 2 summarizes the characteristics of these families of clusters, eliminating the few remaining clusters inhabited in mountainous zones. Here, the number of units has been indicated, the average size and its coefficient of variation, as well as the average area and its coefficient of variation. As the diameter of the aggregation increases, the number of units decreases, while the population and the average area of each cluster
continues to increase. Also important in our view is the rapid reduction of the variability of the units, as the line of coefficients of variation shows.
Also crucial is the variability of the areas. It is more than 150% for the villages of the census, which means that the database comprises village territories with areas that are difficult to compare. Thanks to clustering, these variations in area between the units diminish very quickly: the variability (coefficient of variation) thus amounts to 50% for the 6974 clusters of 5 km. This indicates that the units are henceforth of a much more harmonious size. Turning to the administrative units of sub-districts (i.e. 1513 taluks and mandals), one observes a variability in area of 100% between these units: this figure is thrice that of clusters of 10 km, which are comparable in number.
Of course, the population remains more variable than the area despite clustering because the effect of the differences in regional densities subsists. But the variability of the population of the villages in the first clusters of 2 km nevertheless decreases by one third. The sparsely populated clusters, or with a population of less than 1000 inhabitants, have not entirely disappeared because there are still large forest or mountainous regions that are sparsely populated. Their part in the whole, however, becomes very small and the effect of variations characteristic of the administrative grouping, illustrated by the “micro-villages” of the region of Mysore and the “macro-villages” of Kerala in Figure 6, tend to become indistinct.
In order to be mapped, the data will often then be smoothed and contoured. Figure 11 summarizes the different stages in the study of a phenomenon, starting from the primary data of our GIS to obtain a systematic cartography. We are using here the values of the child-woman ratio (computed as the ratio of children below 7 years to women aged 7 or more), which we will utilize as a proxy for fertility. The zone represented covers the north-east point of Andhra Pradesh, centred on the district of Visakhapatnam. All the 6700 villages of this region are represented on the first map. It will be noted that the highest densities of units of population do not necessarily correspond to a greater demographic density. Thus, the northern limits of the State (along the border with Orissa) encompasses several hundred census villages which, in fact, are only isolated tribal hamlets of a demographic size seldom greater than 100 inhabitants. Conversely, the villages on the coast oriented toward the south-east are much more populated, but appear very scattered.
Figure 11: Mapping fertility data in North-East Andhra Pradesh: original villages, cluster aggregation, kriged estimates and final contouring