HAL Id: cea-02499788
https://hal-cea.archives-ouvertes.fr/cea-02499788
Submitted on 5 Mar 2020
HAL is a multi-disciplinary open access archive for the deposit and dissemination of sci-entific research documents, whether they are pub-lished or not. The documents may come from teaching and research institutions in France or abroad, or from public or private research centers.
L’archive ouverte pluridisciplinaire HAL, est destinée au dépôt et à la diffusion de documents scientifiques de niveau recherche, publiés ou non, émanant des établissements d’enseignement et de recherche français ou étrangers, des laboratoires publics ou privés.
composition in liquid- liquid extraction systems with
rainbow diffractometry
M. Ouattara, F. Lamadie, M. Sentis, F. Onofri
To cite this version:
M. Ouattara, F. Lamadie, M. Sentis, F. Onofri. Experimental characterization of single droplets size and composition in liquid- liquid extraction systems with rainbow diffractometry. The International Symposia on Applications of Laser Techniques to Fluid Mechanics, Jul 2016, Lisbonne, Portugal. �cea-02499788�
Experimental characterization of single droplets size and composition in
liquid-liquid extraction systems with rainbow diffractometry
M. Ouattara1,2, F. Lamadie1,*, M. Sentis1, F.R.A. Onofri2,*
1: CEA, DEN, DTEC, SGCS, F-30207 Bagnols-sur-Cèze, France 2: Aix-Marseille Université, CNRS, IUSTI, UMR 7343, 13453, Marseille, France
* Correspondent authors: [email protected], [email protected]
Keywords: Liquid-liquid flows, Extraction, Droplets, Size, Composition, Rainbow scattering, Diffractometry ABSTRACT
This paper is focused on the analysis of the rainbow phenomenon produced by droplets with a low relative refractive index with the aim to characterize their size distribution and composition in liquid-liquid two-phase flows. The Lorenz-Mie theory, geometrical optics and physical approximations are used to bring insight on the specificities of the corresponding scattering patterns : near-forward location, reverse polarization and lower modulation compared to conventional rainbows. Material and methods to retrieve the parameters of the dispersed phase are reported when the rainbow diffractometry technique is operated as a single particle counting technique. Experimental results show that an accuracy better than 5% on the diameters and 4.10-4 on the refractive index (i.e.
0.8% in mass fraction of Marcol in hydrogenated tetrapropylene) can be achieved. These results open up perspectives for liquid–liquid extraction studies and more generally, mixing studies in two-phase flows.
1. Introduction
Liquid–liquid extraction, designed for selective separation of products in a mixture by solvent extraction, is a key process in chemical engineering. When applied in nuclear fuel reprocessing, two immiscible liquids are contacted: an aqueous phase and an organic phase. Only one phase, the continuous or the dispersed one, contains an extractant molecule capable of transferring the desired radioactive element from one phase to the other. After the transfer in a contactor such as a mixer–settler, an agitated or a pulsed column, both phases are separated by settling. To better understand the key factors and thus enhance the efficiency of the whole process, the experimental analysis of the kinetics of extraction and the interfacial area is a major issue, e.g. Lamadie et al. (2012). This requires in particular the determination of the size distribution and composition of the dispersed phase (i.e. in the present study, droplets with a low relative refractive index m≈1.06-1.23, the latter being used to infer the droplet composition).
For this purpose, in gas-flows and droplets with a large relative refractive index, the most promising elastic light scattering technique is certainly the rainbow or (global) rainbow
thermometry technique, e.g. Roth et al. (1990), van Beeck et al. (1999). However, surprisingly, this technique, that we prefer to call rainbow diffractometry (RD) for its obvious similarities with the forward diffractometry and critical diffractometry techniques (Onofri, 2012), has rarely been applied to the characterization of liquid-liquid systems, Lohner et al. (1999) and Vetrano et al. (2004). In the same way, the behavior of the rainbow phenomenon for droplets with a low relative index is not frequently discussed in the literature, e.g. Nussenzweig (1992).
From this assessment, this paper is focused on the analysis of the rainbow phenomenon produced by large droplets with a low relative refractive index with the aim to characterize liquid-liquid two-phase flows. It is structured as follows. After this introduction, section 2 briefly reviews the specificity of the rainbow pattern produced by droplets with a low relative refractive index. It shows that the Airy theory previously used to analyze liquid-liquid systems is not accurate enough for reliable measurements. Section 3 presents the material and methods, and more particularly the experimental setup, the calibration procedure of the RD system as well as the properties of the simulating fluids that are used for the liquid–liquid extraction process. Section 4 describes the rainbow signals post-processing, and the direct method developed for the retrieval of single-droplet parameters. Section 5 is an overall conclusion with perspectives.
2. Specificities of the rainbow scattering pattern of droplets with low relative refractive index Following pure geometrical optics, the externally reflected rays (p=0) and single internal
reflected (p=2) rays scattered at the rainbow angle θr occurs for:
p 0,r p 0,r p 2,r p 2,r p 2,r 2 4 2 = = = = = θ = τ ʹ θ = τ − τ (1)
with θp 0,r= ≡ θp 2,r= ≥0, where τ and 2,r τ stand respectively for the complementary incident angle ʹ2,r
and the complementary refraction angle associated to the maximum deviation angle condition of
rays p 2= , with τ2,r=sin−1
(
(m2−1) / 3)
and(
( )
)
1
2,r cos− cos 2,r / m ʹ
τ = τ , see van de Hulst (1957).
Classically, in the latter equations, the relative refractive index m m / m= 2 1 is the ratio of the
particle refractive index m2 in air, for the incident wavelength λ0, and the corresponding
(a) (b)
Fig.1. (a) Geometry and ray tracing calculations for the single internally refracted rays (p=2) and externally reflected rays (p=0)
contributing the most to the first-rainbow pattern produced by a droplet with a low relative refractive index (m2/m1=1.06); (b)
comparison of the scattering diagram in the 1st rainbow angle region of a millimeter droplet with m=1.06, according to the
Lorenz-Mie Theory (LMT, exact), the Debye theory (only partial waves p=2) and Airy theory of the rainbow (i.e. physical optics approximation, p=2 only), and an advanced Geometrical Optics Approximation(GOA) (rays p=0,1,...,8). The zoomed
view points out the ripple (high frequency) structures of the scattering pattern.
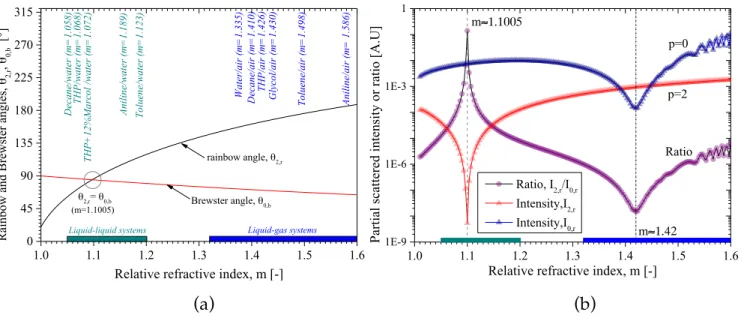
Using Eq. (1) we can readily show that for conventional rainbows, e.g. produced by liquid droplets in gas, the first rainbow is localized in the near-backward scattering domain (
2,r 137.8 157.2 deg
θ ≈ − for m 1.332 -1.5≈ ), whereas for common liquid-liquid systems (m 1.06 -1.23≈ ),
it is localized on the side-ways or in near-forward scattering regions (θ ≈2,r 57.3 93.5 deg− ), see Fig.
1(b). In this angular region also takes place the Brewster angle θ condition for the externally 0,b
reflected rays and a parallel polarized incident beam (electrical field component E2, see Fig.
1(a)):
( )
1 1
0,b 2 tan− m−
θ = (2)
As illustrated on Fig. 2(a), for liquid-liquid systems, the two optical phenomena may coincide
perfectly whenθ = θ . Indeed, this condition occurs for a particular refractive index, 2,r 0,b m 1.1005≈
which can be estimated numerically by solving the former transcendental equation. This result is
confirmed by Fig. 2(b) which presents the intensity of the partial waves p 2= and p 0=
calculated with the Debye theory, for the parallel polarization and at the geometrical optics rainbow angle. To conclude on that point, contrary to droplets in gas-flows, the parallel polarization is the optimal one for low refractive index droplets. This polarization state of the
68 69 70 71 72 73 74 75 76 0.00 0.01 0.02 0.03 72.2 72.4 Airy theory Airy theory Inflection point 3rd fringe 2nd fringe 4th fringe Scattered intensity, I( θ ) [AU]
Scattering angle, θ [deg]
LMT Debye Airy GOA 1st fringe Ripple Rainbow angle - F old causti c θ2,r Alexand er's dar k ba nd Zoom GOA
incident beam allows minimizing the relative contribution of the externally reflected rays to the rainbow signal, i.e. to minimize the amplitude of the ripple which contribution is often considered as disruptive, e.g. Saengkaew et al. (2010).
(a) (b)
Fig. 2 (a) Evolution of the geometrical optics positions of the rainbow and Brewster angles versus droplets relative refractive
index. (b) Intensities and ratio of the partial waves p=2 and p=0 for the parallel polarization and at the geometrical optics rainbow angle (calculations performed with the Debye theory for droplets with diameter D=200µm).
Going back to Fig. 1(b), it is also clear that the intensity decay and angular location of the supernumerary fringes (n≥2) are poorly estimated by the Airy theory. This was confirmed by numerical calculations (not shown here) comparing the evolution of the angular position and intensity of the first supernumerary fringes for different droplet sizes. In fact, such a discrepancy, even for large droplets, is a third major difference with respect to droplets in gas-flows. Clearly, the predictions of the standard Airy theory are too rough (i.e. its angular range validity is limited) to be considered for the inversion of rainbow scattering patterns in liquid-liquid systems. In Fig. 1(b), excepted at the vicinity of the rainbow angle where takes place the caustic (Onofri et al., 2015), the predictions of the GOA (Sentis et al., 2016) appears to be in much better agreement with those of the Debye and LMT theories, for both the coarse and the ripple structures. One additional advantage of the GOA is that it can manage spheroidal droplets while being computationally efficient (Ren et al., 2011). In any event, for convenience reasons, the LMT is used for all calculations presented in what follows and notably for the inversion procedure.
1.0 1.1 1.2 1.3 1.4 1.5 1.6 0 45 90 135 180 225 270 315 θ2,r= θ0,b Brewster angle, θ 0,b Liquid-gas systems Wate r/air (m=1.335) TH P/ air (m=1.426) TH P+12%Marcol /wat er (m= 1. 072) Glyc ol/ air (m=1.430) Decane /ai r (m=1.410) Toluene /wat er (m= 1. 123) Decane /wat er (m= 1. 058) Toluene /ai r (m=1.498) Ra
inbow and Brew
ster angle s, θ2, r , θ0, b [°]
Relative refractive index, m [-]
Ani li ne/ wate r (m=1.189) Ani li ne/ air (m= 1. 586) TH P/ wate r (m=1.068) Liquid-liquid systems rainbow angle, θ2,r (m=1.1005) 1.0 1.1 1.2 1.3 1.4 1.5 1.6 1E-9 1E-6 1E-3 1 p=0 m≈1.42 Part ial scat ter ed int ensi ty or rat io [ A.U ]
Relative refractive index, m [-]
Ratio, I2,r/I0,r Intensity,I2,r Intensity,I0,r m≈1.1005 p=2 Ratio
3. Experimental setup, fluids and calibration
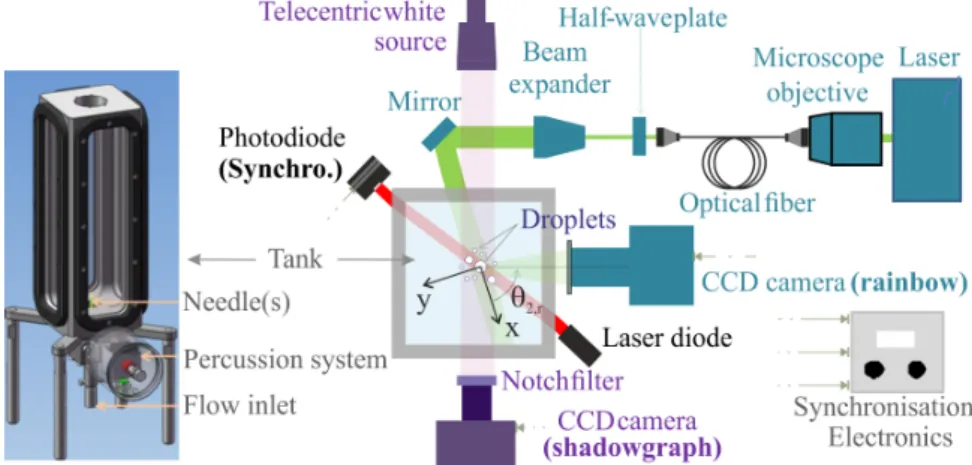
The whole laboratory experiment is built around a column designed for liquid-liquid extraction studies, i.e. a rectangular tank equipped with four optical glass windows and filled with demineralized water, see Fig. 3. At the bottom of the tank, a needle produces a stream of single rising droplets (plus or less monodisperse) passing through the center of the probe volume, located 200 mm above the needle, i.e. along the z-axis (Lamadie et al., 2012).
Fig. 3 Schematic of the liquid-liquid extraction columnand the optical setup (the optical measurements are performed 200mm
above the needle).
The emission part of the RD-system is composed of a continuous high-power single-mode laser (doubled Nd:YAG 532nm, 5W) with a polarization maintaining beam delivery optics, a beam expander (x10) and a half-wave plate. The beam expander allows to ensure that the beam waist is within the probe volume (defined as the crossing of all optical diagnostics field of views) as
well as to enlarge the beam diameter up to 2ω0≈15mm. With a ratio of the beam diameter to
maximum droplet size of 2ω0/Dmax>9, the latter condition allows minimizing Gaussian beam
effects (as well as to characterize clouds of droplets, while these results are not reported in the present paper). The polarization optics is used to adjust the polarization (parallel) of the illumination beam. The detection of the RD-system is composed of a laser-line interference filter, a high-numerical aperture camera lens focused at infinite (f/d#1.4), and a high resolution and high dynamic CCD camera (4MPix, 12 bits). A shadowgraph system is used for droplet size and shape comparison purpose. This system is composed of a white light source associated to a telecentric lens, a high magnification optics (x6.9µm/pix) with a notch filter, a high resolution and high dynamic CCD camera (1.3MPix, 12 bits). Both systems are synchronized and triggered by a third optical system (basically a red laser diode and a photodiode) detecting all droplets passing within the optical probe volume which is common to both diagnostics, see Fig. 3.
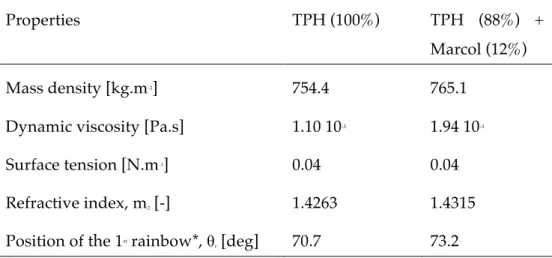
Table 1 Properties at 20°C and 1 atm. of the solutions used to generate droplets of various compositions. *when the surrounding fluid is composed of HPLC-grade water (m1=1.3354) - λ0=532nm.
Properties TPH (100%) TPH (88%) +
Marcol (12%)
Mass density [kg.m-3] 754.4 765.1
Dynamic viscosity [Pa.s] 1.10 10-3 1.94 10-3
Surface tension [N.m-1] 0.04 0.04
Refractive index, m2 [-] 1.4263 1.4315
Position of the 1st rainbow*, θ
r [deg] 70.7 73.2
For obvious reasons, activated fluids are not used in this preliminary study which goal is to investigate the potential of the RD for liquid-liquid extraction studies. Instead, various mixtures of Tetra-Propylene Hydrogenated (TPH) and Marcol are used as simulating fluids to produce the droplets. TPH is the diluent used with the solvent in the nuclear fuel recycling process, while Marcol is a saturated hydrocarbon liquid with a higher refractive index than TPH but with comparable viscosity and surface tension. In the same way, for the continuous phase, demineralized water (HPLC-grade) replaces the nitric aqueous solution used in the PUREX method. Nine solutions of TPH-Marcol mixtures were prepared to produce droplets with the aim to retrieve on-line their mixing fraction with the RD. Their mass fraction in Marcol is ranging from 0% to 12%, leading to absolute refractive indexes increasing from 1.4263 to 1.4315 (at 20°C) respectively. Some of their basic properties are summarized in Table 1. The refractive indexes of these solutions were carefully measured for a large range of temperatures (15-30°C) with an
Abbe refractometer (resolution ± 2.10-4 at 532nm). For these conditions and the droplet sizes
(600-1550µm) considered here, the Eötvös and Reynolds numbers are in the range #1.2 10-1-2.6 10-2 and
#6.4-90.2 ensuring a good sphericity of the droplets.
The angular calibration of the RD-system is obviously central to the method. As an order of magnitude, for a droplet with diameter D=1000µm, an error in the positioning of the detection
system of 0.2deg would induce an error of #5.7 10-4 in the determination of its refractive index,
i.e. an error of 1.3% on its volume fraction in Marcol. In order to minimize this error, the calibration of the RD-system is performed with a high resolution goniometer (embedding a
mirror submerged in the tank) and a careful auto-collimation procedure. For the experiments
reported here, the pixel to angle calibration of this system is of 6.10-3deg/pix with a systematic
error that is estimated to be lower than 0.05 deg (i.e. corresponding to a possible error of 0.3% in the fraction of Marcol over a maximum variation of 12%). Actually, the main source of uncertainty in this experiment lies in the control of the laboratory room temperature (and thus of both liquids). During an experiment, the variations of the latter were measured to be about ±0.5-1°C over 17 to 23°C. As the refractive index of the mixture varies almost linearly with the fraction
of Marcol and the temperature, with respectively 4.4 10-4 /% and 4.6 10-4 /°C, the variations of the
laboratory room limit the expected resolution on the droplet composition to 0.5% in Marcol.
4. Droplets parameters retrieval methods
The shadowgraph images are recorded using a short exposure time (less than 80 µs considering that the velocity of droplets ranges from 3-7 cm/s) to minimize blurring effects. The shadowgraph images are characterized with a classical blob analysis followed by a linear interpolation scheme based on the point spread function of the high magnification optics.
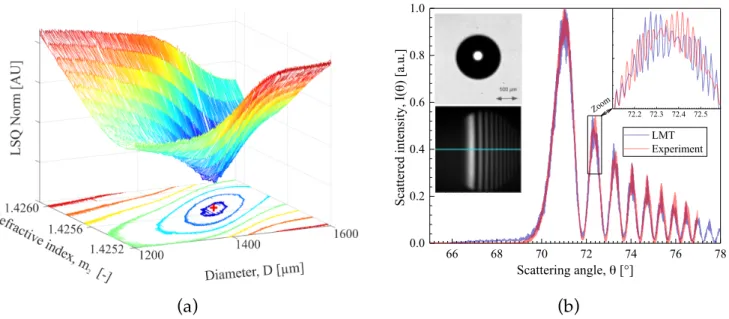
The rainbow intensity profiles are obtained by averaging a 20 pixels central band height (i.e. off-axis angle range of ±0.15deg, see the embedded picture in Fig. 4(b)) from each image recorded by the corresponding CCD camera. This classical procedure allows to dump the contribution of the electronic white noise and thus to improve the SNR. For single droplets, in order to account for the CCD response (assumed to be linear) as well as to get a better graphical comparison with numerical calculations, the theoretical scattering diagrams are scaled to the experimental ones. The gain and offset are simply derived from the measurement of the intensity of the first and third supernumerary (bright) fringes. One further advantage of this scaling procedure, that was originally introduced to process critical-scattering patterns (Onofri et al., 2009), is that it allows minimizing the effect of the variations of the rainbow signal intensity with the droplets trajectory within the probe volume. The droplets parameters (diameter and refractive index) are simply retrieved by comparing, in the least square sense, scaled experimental intensity profiles with theoretical intensity profiles calculated with the LMT (Onofri et al., 2009). This procedure is illustrated in Fig. 4(a).
66 68 70 72 74 76 78 0.0 0.2 0.4 0.6 0.8 1.0 72.2 72.3 72.4 72.5 a Scatt ere d int ensi ty, I (θ ) [ a.u.] Scattering angle, θ [°] LMT Experiment Zoom a (b) (a) (b)
Fig. 4 (a) Typical evolution for the Euclidean norm (L2 ) of the least square difference between an experimental rainbow intensity profile and the profiles calculated with LMT for various sizes and refractive indexes. (b) Comparison of the experimental intensity profile and the reconstructed one (minimizing the norm of the least square difference). The corresponding
shadowgraph image and rainbow scattering diagram are also shown.
5. Results and discussion
A typical shadowgraph image and the rainbow far field pattern of a free rising millimeter droplet containing 0% of Marcol are shown in Fig. 4(b), as well as the corresponding rainbow intensity profile and the reconstructed one. The two intensity profiles match pretty well. However, one can notice minor differences, like a small offset (more noticeable in the Alexander dark band) that is attributed to some residual background noise and a slight angular shift of the ripple. Three major reasons can easily explain this observation. Firstly, this shift could be attributed to small changes in the laboratory room temperature during the course of an experiment. Secondly, while the linearity and magnification of the shadowgraph system are quite limited, the aspect ratio of the largest droplets was estimated to be about 0.992 instead of 1 (spherical droplet model). It is known that even a small change in the droplets sphericity induces a shift of the ripple structure. Thirdly, any residual oscillations of the droplets cannot be rejected, even if such oscillations were not detected with the shadowgraph system. In any event, the
droplet parameters retrieved, m2= 1.4253 and D=1015µm, are in good agreement with the ones
derived with the Abbe refractometer and the shadowgraph, m2= 1.4248 and D=995µm. The
values obtained with the RD are within the uncertainty of the values provided by the Abbe refractometer and the shadowgraph system.
1,426 1,428 1,430 1,432 1,426 1,428 1,430 1,432 0 3 6 9 12 0 3 6 9 12 Mean (mA-mRD): 3.9 10-4 Std dev (mA-mRD): 1.6 10-4 (b) Raw data Y=X ΔT= 1°C ΔY=1% SRD - refr ac tive index, m RD [-]
Abbe refractometer - refractive index, mA[-]
600,0 800,0 1000 1200 Diameter, DS [µm] Color c oding y=x 1400 ΔY=1 % ΔT= 1°C SRD- conce ntration i n Ma rcol, C RD [% ]
Dilutions - Concentration in Marcol, CDIL [%]
(a) (b)
Fig. 5 (a) Comparison of the size of droplets with various compositions (m2 = 1.4248∼1.4317) measured with the SRD and
shadowgraph; (b) Comparison of the refractive index of droplets with various sizes (D = 600∼1550µm) measured with the SRD and an Abbe refractometer (initial solutions). Both results correspond to 5700 analyzed droplets.
The results obtained for the nine solutions of TPH-Marcol mixtures are summarized in Fig. 5(a), which compares the droplet size measured with the shadowgraph and RD systems for various
droplet compositions (color coding), while Fig. 5(b) compares the refractive index m2 measured
by the Abbe refractometer and the RD system. Obviously, the RD provides simultaneously the size and refractive index of the droplets (5700 analyzed droplets). It is found that the global agreement on the droplet size is better than 5%, while the agreement on the refractive index is
better than 4.10-4 (corresponding to an error on the estimation of the concentration in Marcol of
less than 0.8% or a change in the room temperature of less than 1.1°C). The deviation in the slope of the linear regression is less than 1% in both cases with a correlation coefficient superior to 0.99.
6. Conclusion
The results presented in this paper clearly demonstrate the potential of the RD technique for the in-line analysis of the droplet size and composition in liquid-liquid systems. The LMT, geometrical optics and physical approximations are used to bring insight on the specificities of the corresponding scattering patterns: near-forward location, reverse polarization and lower modulation compared to conventional rainbows. Material and methods to retrieve the parameters of the disperse phase are reported when the rainbow diffractometry technique is operated as a single particle counting technique. Experimental results show that an accuracy
500 750 1000 1250 1500 500 750 1000 1250 1500 Mean difference (DS-DRD): 14µm Std dev of difference (DS-DRD): 11µm Refractive index [-] Color c oding Raw data Y=X Y=X 5% SRD diam ete r, D RD [ µ m] Shadowgraph diameter, DS [µm] 1.425 1.426 1.427 1.428 1.429 1.430 1.431 1.432 1.433 (a)
better than 5% on the diameters and 4.10-4 on the refractive index (i.e. 0.8% in mass fraction of
Marcol in TPH) can be achieved. These results open up perspectives for liquid–liquid extraction studies and more generally, mixing studies in two-phase flows. It will be shown in a forthcoming publication that the RD can also provide reliable statistics on liquid-liquid systems when it is operated as an ensemble averaging technique.
Funding Information. French National Research Agency (ANR) (13-BS09-0008-02, ANR-11-LABX-0092, ANR-11- IDEX-0001-0). This study is part of the “Nuclear Fuel Processing Program” of the French Alternative Energies and Atomic Energy Commission.
References
o Lamadie F., Bruel L., Himbert M. (2012). Digital holographic measurement of liquid– liquid two-phase flows. Optics and Lasers in Engineering 50(12): 1716-1725.
o Lohner H., Lehmann P., Bauckhage K. (1999). Detection based on rainbow refractometry of droplet sphericity in liquid-liquid systems. Appl. Opt. 38(7): 1127-1132.
o Nussenzweig H.M. (1992). Diffraction effects in semiclassical scattering. Cambridge University Press, Cambridge.
o Onofri F., Barbosa S (2012), Chapter II: Optical particle characterization, in Laser Metrology in Fluid Mechanics (A. Boutier, ed.), Wiley-ISTE, London.
o Onofri, F. A., Krzysiek M., Mroczka J., Ren K.-F., Radev S., Bonnet J.-P. (2009). Optical characterization of bubbly flows with a near-critical-angle scattering technique. Exp. in Fluids 47(4-5): 721-732.
o Onofri F.R.A., Ren K. F., Sentis M., Gaubert Q., Pelce C. (2015). Experimental validation of the vectorial complex ray model on the inter-caustics scattering of oblate droplets. Opt Express 23(12): 15768-15773.
o Ren K. F., Onofri F., Rozé C. and Girasole T. (2011). Vectorial complex ray model and application to two-dimensional scattering of plane wave by a spheroidal particle. Opt. Lett. 36(3): 370-372.
o Roth N., Anders K., Frohn A. (1990). Simultaneous measurement of temperature and size of droplets in micrometer range. J. of Laser. Appl. 2(1 ): 37-42.
o Saengkaew S., Charinpanikul T., Laurent C., Biscos Y., Lavergne G., Gouesbet G., Gréhan G. (2010). Processing of individual rainbow signals. Exp. Fluids 48: 111-119.
o Sentis, M. P., Onofri F. R., Méès L., Radev S. (2016). Scattering of light by large bubbles: Coupling of geometrical and physical optics approximations. J. Quant. Spectrosc. Radiat. Transfer 170: 8-18.
o van Beeck J., Giannoulis D., Zimmer L., Riethmuller M. (1999). Global rainbow thermometry for droplet-temperature measurement. Optics Letters 24(23): 1696-1698. o van de Hulst H.C. (1957). Light scattering by small particles, John Wiley & Sons.
o Vetrano M.R., van Beeck J.P.A.J., Riethmuller M.L. (2004). Global rainbow thermometry: improvements in the data inversion algorithm and validation technique in liquid–liquid suspension. Appl. Opt. 43(18): 3600-3607.
![Abbe refractometer - refractive index, m A [-]](https://thumb-eu.123doks.com/thumbv2/123doknet/12982219.378402/10.892.72.818.99.432/abbe-refractometer-refractive-index-m-a.webp)
![[PDF] Cours C 2 Types entrees sorties de base et structures de controle | Cours langage c](data:image/gif;base64,R0lGODlhAQABAIAAAP///wAAACH5BAEAAAAALAAAAAABAAEAAAICRAEAOw==)