HAL Id: cea-01383761
https://hal-cea.archives-ouvertes.fr/cea-01383761
Submitted on 19 Oct 2016
HAL is a multi-disciplinary open access
archive for the deposit and dissemination of
sci-entific research documents, whether they are
pub-lished or not. The documents may come from
teaching and research institutions in France or
abroad, or from public or private research centers.
L’archive ouverte pluridisciplinaire HAL, est
destinée au dépôt et à la diffusion de documents
scientifiques de niveau recherche, publiés ou non,
émanant des établissements d’enseignement et de
recherche français ou étrangers, des laboratoires
publics ou privés.
Multi-frequency study of the newly confirmed supernova
remnant MCSNR J0512–6707 in the Large Magellanic
Cloud
P. J. Kavanagh, M. Sasaki, L. M. Bozzetto, S. D. Points, M. D. Filipović, P.
Maggi, F. Haberl, E. J. Crawford
To cite this version:
P. J. Kavanagh, M. Sasaki, L. M. Bozzetto, S. D. Points, M. D. Filipović, et al.. Multi-frequency study
of the newly confirmed supernova remnant MCSNR J0512–6707 in the Large Magellanic Cloud.
As-tronomy and Astrophysics - A&A, EDP Sciences, 2015, 583, pp.A121. �10.1051/0004-6361/201526987�.
�cea-01383761�
A&A 583, A121 (2015) DOI:10.1051/0004-6361/201526987 c ESO 2015
Astronomy
&
Astrophysics
Multi-frequency study of the newly confirmed supernova remnant
MCSNR J0512
−
6707 in the Large Magellanic Cloud
?
P. J. Kavanagh
1, M. Sasaki
1, L. M. Bozzetto
2, S. D. Points
3, M. D. Filipovi´c
2, P. Maggi
4,
F. Haberl
5, and E. J. Crawford
21 Institut für Astronomie und Astrophysik, Kepler Center for Astro and Particle Physics, Eberhard Karls Universität Tübingen, Sand 1,
Tübingen 72076, Germany
e-mail: [email protected]
2 Western Sydney University, Locked Bag 1791, Penrith, NSW 2751, Australia 3 Cerro Tololo Inter-American Observatory, Casilla 603, La Serena, Chile
4 Laboratoire AIM, CEA-IRFU/CNRS/Université Paris Diderot, Service d’Astrophysique, CEA Saclay, 91191 Gif-sur-Yvette Cedex,
France
5 Max-Planck-Institut für extraterrestrische Physik, Giessenbachstraße, 85748 Garching, Germany
Received 17 July 2015/ Accepted 22 September 2015
ABSTRACT
Aims.We present a multi-frequency study of the supernova remnant MCSNR J0512−6707 in the Large Magellanic Cloud.
Methods.We used new data from XMM-Newton to characterise the X-ray emission and data from the Australian Telescope Compact
Array, the Magellanic Cloud Emission Line Survey, and Spitzer to gain a picture of the environment into which the remnant is expanding. We performed a morphological study, determined radio polarisation and magnetic field orientation, and performed an X-ray spectral analysis.
Results.We estimated the remnant’s size to be 24.9 (±1.5) × 21.9 (±1.5) pc, with the major axis rotated ∼29◦
east of north. Radio polarisation images at 3 cm and 6 cm indicate a higher degree of polarisation in the northwest and southeast tangentially oriented to the SNR shock front, indicative of an SNR compressing the magnetic field threading the interstellar medium. The X-ray spectrum is unusual as it requires a soft (∼0.2 keV) collisional ionisation equilibrium thermal plasma of interstellar medium abundance, in addition to a harder component. Using our fit results and the Sedov dynamical model, we showed that the thermal emission is not consistent with a Sedov remnant. We suggested that the thermal X-rays can be explained by MCSNR J0512−6707 having initially evolved into a wind-blown cavity and is now interacting with the surrounding dense shell. The origin of the hard component remains unclear. We could not determine the supernova type from the X-ray spectrum. Indirect evidence for the type is found in the study of the local stellar population and star formation history in the literature, which suggests a core-collapse origin.
Conclusions.MCSNR J0512−6707 likely resulted from the core-collapse of high mass progenitor which carved a low density cavity
into its surrounding medium, with the soft X-rays resulting from the impact of the blast wave with the surrounding shell. The unusual hard X-ray component requires deeper and higher spatial resolution radio and X-ray observations to confirm its origin.
Key words.ISM: supernova remnants – Magellanic Clouds – X-rays: ISM
1. Introduction
Supernova remnants (SNRs) are formed via the interaction of ejecta from violent supernova (SN) explosions with the sur-rounding medium. The supernovae (SNe) can result from either the core-collapse (CC) of a massive star or from the explosion of a carbon-oxygen white dwarf in a binary system which ex-ceeds the Chandrasekhar limit, either via accretion from a stel-lar donor or white dwarf mergers, so-called Type Ia explosions. The SN ejecta blasted into the interstellar medium (ISM) con-tain heavy elements produced in the stellar progenitors and via explosive nucleosynthesis which chemically enriches the ISM. The energy deposited by the explosions drive the mechanical evolution of the ISM and cosmic rays can be accelerated in the fast moving shocks (see Vink 2012, for a review). Studies of these objects in the Milky Way are problematic due to uncer-tain distance estimates and high foreground absorption, which
?
Based on observations obtained with XMM-Newton, an ESA sci-ence mission with instruments and contributions directly funded by ESA Member States and NASA.
particularly affects evolved SNRs whose low temperature plas-mas are extremely susceptible to foreground absorption.
The Large Magellanic Cloud (LMC) is an excellent galaxy for the study of SNRs due to its ideal observational properties. At a distance of 50 kpc (di Benedetto 2008) it is sufficiently close that its stellar population and diffuse structure is resolved in most wavelength regimes. The LMC is almost face-on (incli-nation angle of 30–40◦,van der Marel & Cioni 2001;Nikolaev et al. 2004) and the modest extinction in the line of sight (av-erage Galactic foreground NH ≈ 7 × 1020 cm−2) means optical
and X-ray observations of SNRs are only slightly affected by foreground absorption, whereas its location in one of the coldest parts of the radio sky (Haynes et al. 1991) allows for improved radio observations without interference from Galactic emission. The total number of confirmed SNRs in the LMC now stands at ∼60 (Maggi et al. 2015;Bozzetto et al. 2015, and references therein). Recent additions includeBozzetto et al.(2014),Maggi et al.(2014),Kavanagh et al.(2015a,b).
Typically, objects are classified as SNRs based on satisfying certain observational criteria. The Magellanic Cloud Supernova
Remnant (MCSNR) Database1 requires that at least two of the following three observational criteria must be met: significant Hα, [S
], and/or [O
] line emission with an [S
]/Hα flux ratio >0.4 (Mathewson & Clarke 1973;Fesen et al. 1985); extended non-thermal radio emission; and extended thermal X-ray emis-sion. A discussion of the significance of each of these classifica-tion criteria is given inFilipovic et al.(1998).The ROSAT catalogue of X-ray sources in the LMC of Haberl & Pietsch(1999) contained the source [HP99] 483 at a J2000 position of RA = 05h12m28.0s and Dec = −67d07m27s which is located in the wider DEM L97 HII region (Davies et al. 1976). The source is also projected near the edge of the molec-ular cloud [WHO2011] A126 (Wong et al. 2011) to its south and southwest. However, due to the faintness of the source, only coarse properties of [HP99] 483 were determined byHaberl & Pietsch(1999) and the source did not make it into the final list of ROSAT detected SNRs and candidate SNRs.
The study ofReid et al.(2015) identified the optical coun-terpart to [HP99] 483 using deep Hα imaging of the LMC per-formed with the United Kingdom Schmidt Telescope (UKST). Spectroscopic follow-up of several regions in the object with the Anglo Australian Telescope and the 1.9 m telescope at the South African Astronomical Observatory revealed the charac-teristically high [S
]/Hα values, consistent with an SNR. The radio counterpart was also detected using data from the Australia Telescope Compact Array (ATCA), whose spectral index of −0.52 (±0.04) is consistent with with the typical value of −0.5 for non-thermal emission from SNRs. Therefore, the object was confirmed as an SNR by Reid et al. (2015), who assigned the identifier MCSNR J0512−6707. A study of the surrounding dust emission using Spitzer data was also presented, with the au-thors noting that the SNR is located in a complex dust envi-ronment with the SNR appearing to be encased in dust, no-tably by a bright filament in the east and north. Using optical imaging, these authors determined the size of the remnant to be 13.5 × 15.5 pc and estimated the age to be 2–5 kyr assuming that the remnant is in the Sedov phase.In this paper we present new X-ray observations of MCSNR J0512−6707 with XMM-Newton. As we will show, the new X-ray data revealed that, at 24.9 (±1.5) × 21.9 (±1.5) pc (see Sect.4.1), the size of MCSNR J0512−6707 is significantly larger than determined by Reid et al.(2015), with the optical emission only present in the northeast of the remnant. In addi-tion, we will show that MCSNR J0512−6707 is likely not in the Sedov phase (Sect.4.2). We performed a similar study to as-sess the morphology and physical characteristics in light of these new findings, making use of the data from the Magellanic Cloud Emission Line Survey (MCELS,Smith et al. 2006), radio data from ATCA, and IR data from Spitzer reported by Reid et al. (2015).
Our work on the multi-frequency study of
MCSNR J0512−6707 using X-ray, radio, IR, and optical emission line data is arranged as follows: the observations and data reduction are described in Sect. 2; data analysis is outlined in Sect. 3; results are given and discussed in Sect. 4; and finally we summarise our work in Sect. 5.
2. Observations and data reduction 2.1. X-ray
XMM-Newton (Jansen et al. 2001) observed
MCSNR J0512−6707 on May 17 2014 (Obs. ID 0741800201,
1 http://www.mcsnr.org/
PI P. Kavanagh). The primary instrument for the observation was the European Photon Imaging Camera (EPIC), which consists of a pn CCD (Strüder et al. 2001) and two MOS CCD (Turner et al. 2001) imaging spectrometers. However, a “false radiation” warning due to a flaring optical source in the FOV affected the EPIC-MOS CCDs during this observation, resulting in both EPIC-MOS cameras being shut for extended periods. Because of this, the observation was repeated and a second dataset was obtained on June 8 2014 (Obs. ID 0741800301, PI P. Kavanagh). We reduced all available data (i.e., the usable data from Obs. ID 0741800201 and Obs. ID 0741800301) using the standard reduction tasks of SAS2version 14.0.0, filtering for periods of high particle background. This resulted in combined flare-filtered exposure times of ∼42 ks for EPIC-pn, ∼48 ks for EPIC-MOS1, and ∼46 ks for EPIC-MOS2.
2.2. Optical
The MCELS observations (Smith et al. 2006) were taken with the 0.6 m University of Michigan/Cerro Tololo Inter-American Observatory (CTIO) Curtis Schmidt Telescope equipped with a SITE 2048 × 2048 CCD, producing individual images of 1.35◦ × 1.35◦ at a scale of 2.300 pixel−1. The survey mapped both the LMC (8◦× 8◦) and the SMC (3.5◦ × 4.5◦) in narrow
bands covering [O
]λ5007 Å, Hα, and [S
]λ6716, 6731 Å, in addition to matched green and red continuum bands. The survey data were flux calibrated and combined to produce mosaicked images. We extracted cutouts centred on MCSNR J0512−6707 from the MCELS mosaics. We subtracted the continuum im-ages from the corresponding emission line imim-ages, thereby re-moving the stellar continuum and revealing the full extent of the faint diffuse emission. Finally, we divided the continuum subtracted [S
] image by the continuum subtracted Hα im-age to get a [S
]/Hα map of MCSNR J0512−6707, with re-gions of [S
]/Hα > 0.4 indicative of the presence of an SNR (Mathewson & Clarke 1973;Fesen et al. 1985).2.3. Radio
2.3.1. Radio continuum
MCSNR J0512−6707 was observed with the Australian Telescope Compact Array (ATCA) on November 15 and 16 2011 (project C634), using the new Compact Array Broadband Backend (CABB). The ATCA array configuration EW367 was used and observations were taken simultaneously at λ = 3 and 6 cm (ν= 9000 and 5500 MHz) using the dual-frequency mode. Baselines formed with the 6th ATCA antenna were excluded as the other five antennas were arranged in a compact configura-tion. The observations were carried out in the so called “snap-shot” mode, totalling ∼50 min of integration over a 14 h pe-riod. PKS B1934-638 was used for flux density calibration and PKS B0530-727 was used for secondary (phase) calibration. The phase calibrator was observed twice every hour for a total 78 min over the whole observing session. The
3 (Sault et al.1995) and
4(Gooch 1995) software packages were used for reduction and analysis.The relatively small size of the SNR coupled with the observing array focusing on the shorter baselines, led to the remnant remaining unresolved from these observations, and
2 Science Analysis Software, seehttp://xmm.esac.esa.int/sas/ 3 http://www.atnf.csiro.au/computing/software/miriad/ 4 http://www.atnf.csiro.au/computing/software/karma/
P. J. Kavanagh et al.: XMM-Newton study of MCSNR J0512−6707
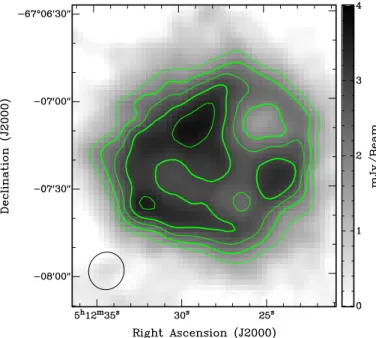
Fig. 1.20 cm radio-continuum image of MCSNR J0512−6707 overlaid with contours at 1.5, 2.0, 2.5, 3.0, and 3.5 mJy/beam. The ellipse in the lower left corner represents the synthesised beamwidth of 13.000
×12.100
.
therefore, the radio morphology of the remnant cannot be read-ily seen. As an alternative, we use archival observations from the ATCA (project C1395) at λ= 20 cm (ν = 1384 MHz; band-width= 128 MHz). These observations were taken using ATCA arrays 1.5A and 6B on April 18 2005 and June 24 2005, respec-tively, for a combined integration time of 819.7 min. As these arrays focus on longer baselines, we were able to resolve the SNR, as seen in Fig.1.
2.3.2. CO
To gain an understanding of the molecular environment in the region of MCSNR J0512−6707, we used data from the Magellanic Mopra Assessment (MAGMA) survey by Wong et al.(2011)5. MAGMA is the mapping survey of the Large and Small Magellanic Clouds in the CO(1–0) line using the 22 m Mopra Telescope of the Australia Telescope National Facility. The survey data have a spatial resolution of ∼4500corresponding to 11 pc at the LMC distance.
2.4. Infrared
The cold environment surrounding MCSNR J0512−6707 can be revealed by infrared (IR) emission. To aid in the discussion of the morphology and environment of the remnant, we make use of data from the SAGE survey of the LMC (Meixner et al. 2006) with the Spitzer Space Telescope (Werner et al. 2004). During the SAGE survey, a 7◦ × 7◦ area of the LMC was
ob-served with the Infrared Array Camera (IRAC,Fazio et al. 2004) in the 3.6 µm, 4.5 µm, 5.8 µm, and 8 µm bands, and with the Multiband Imaging Photometer (MIPS,Rieke et al. 2004) in the 24 µm, 70 µm, and 160 µm bands. The MIPS 24 µm images provide us with a picture of the stochastically, thermally, and ra-diatively heated dust in the region of MCSNR J0512−6707, with spatial resolution comparable to XMM-Newton, to give an indi-cation of the distribution of cool material. We obtained the 24 µm
5 See alsohttp://mmwave.astro.illinois.edu/magma/
MIPS mosaicked, flux-calibrated (in units of MJy sr−1) images processed by the SAGE team from the NASA/IPAC Infrared Science Archive6. The pixel sizes correspond to 4.800 for the 24 µm band.
3. Analysis
The object was detected in radio, optical, and X-rays as an ex-tended source with a size of ∼1.07 × 1.05 (see Sect. 4.1). Here
we describe the analysis of the SNR in these multi-wavelength datasets.
3.1. Radio
Linear polarisation images of MCSNR J0512−6707 were cre-ated at the same resolution at 6 and 3 cm using the Q and U Stokes parameters from the
task IMPOL. The mean fractional polarisation was calculated using flux density and polarisation: P= q S2 Q+ S 2 U SI (1) where SQ, SU, and SI are integrated intensities for the Q, U,and I Stokes parameters. Mean polarisation across the remnant was found to be 12.0 (±1.4)% at 6 cm and 7.1 (±1.9)% at 3 cm. Figure2shows the polarisation for both wavelengths, where a signal-to-noise cut-off of 2σ was used for the Q and U images, and a level of 6σ for the intensity image. Values that fell be-low these cut-off levels are blanked in the output image. As we detected polarised emission at two frequencies, we attempted to determine the Faraday rotation through the
task imrm. However, as there is not any notable rotation between the vec-tors in the two images, the resulting errors were in the same order as the detected rotation measure.3.2. X-ray imaging
We produced images and exposure maps in various energy bands from the flare-filtered event lists for each EPIC instrument in each observation. We filtered for single and double-pixel events (PATTERN6 4) from the EPIC-pn detector, with only single pixel events considered below 0.5 keV to avoid the higher detector noise contribution from the double-pixel events at these ener-gies. All single to quadruple-pixel events (PATTERN6 12) were considered for the MOS detectors.
We used three energy bands suited to the analysis of the spectra of SNRs. A soft band from 0.3–0.7 keV includes strong lines from O; a medium band from 0.7–1.1 keV comprises Fe L-shell lines as well as Ne Heα and Lyα lines; and a hard band (1.1–4.2 keV) which includes lines from Mg, Si, S, Ca, Ar, and non-thermal continuum if present.
We subtracted the detector background from the images us-ing filter-wheel-closed data (FWC). The contribution of the de-tector background to each EPIC dede-tector was estimated from the count rates in the corner of the images, which were not exposed to the sky. We then subtracted appropriately-scaled FWC data from the raw images. We merged the EPIC-pn and EPIC-MOS images from each observation into combined EPIC images and performed adaptive smoothing of each using an adaptive tem-plate determined from the combined energy band (0.3–4.2 keV)
6 Seehttp://irsa.ipac.caltech.edu/data/SPITZER/SAGE/
Fig. 2. Polarisation of MCSNR J0512−6707 at 6 cm (top) and 3 cm (bottom) overlaid on an intensity image at the same wavelength. The 6 cm contours are 1 to 11 mJy in steps of 2 mJy, and the 3 cm contours are 0.9 to 9.9 mJy in steps of 1.8 mJy. The ellipse in the lower left corners represents the synthesised beamwidth of 37.500× 25.000
, and the line directly below the ellipse represents a polarisation vector of 100 per cent.
EPIC image. The sizes of Gaussian kernels were computed at each position in order to reach a signal-to-noise ratio of five, setting the minimum full width at half maximum of the kernels to ∼500. In the end the smoothed images were divided by the
corresponding vignetted exposure maps. Finally, we produced a three-colour image of MCSNR J0512−6707 which is shown in Fig.3-top left.
3.3. X-ray spectral analysis
For the spectral analysis, we made use of the EPIC-pn and EPIC-MOS data. However, because of a low number of total counts, the MOS data from Obs. ID 0741800201 were omitted from our analysis. We extracted source and background spec-tra from vignetting-weighted event lists for each EPIC instru-ment which include a correction for the effective area variation across the source and background. This was achieved using the SAS task evigweight. The SNR spectra were extracted from elliptical regions encompassing the X-ray extent of the SNR. To ensure enough counts for a solid characterisation of its com-ponents, the background spectra were extracted from a larger annulus surrounding the SNR with point sources excluded. All spectra were rebinned so that each bin contained a minimum of 30 counts to allow the use of the χ2 statistic during
spec-tral fitting. The EPIC-pn and EPIC-MOS source and background spectra from each observation were fitted simultaneously using XSPEC (Arnaud 1996) version 12.8.2p with abundance tables set to those of Wilms et al. (2000), photoelectric absorption cross-sections set to those ofBalucinska-Church & McCammon (1992), and atomic data from ATOMDB 3.0.17 with the latest equilibrium and non-equilibrium data.
3.3.1. X-ray background
Detailed descriptions of the X-ray background constituents and spectral modelling can be found inBozzetto et al. (2014) and Maggi et al.(2014). Here we briefly summarise the treatment of the X-ray background in the case of MCSNR J0512−6707.
The X-ray background consists of the astrophysical X-ray background (AXB) and particle induced background. The AXB typically comprises four or fewer components (Snowden et al. 2008; Kuntz & Snowden 2010), namely the unabsorbed ther-mal emission from the Local Hot Bubble, absorbed cool and hot thermal emission from the Galactic halo, and an absorbed power law representing unresolved background active galactic nuclei (AGN). The spectral properties of the background AGN com-ponent were fixed to the well known values ofΓ ∼ 1.46 and a normalisation equivalent to 10.5 photons cm−2s−1sr−1at 1 keV
(Chen et al. 1997). The foreground absorbing material comprises both Galactic and LMC components. The foreground Galactic absorption component was fixed at 5.1 × 1020 cm−2 based on theDickey & Lockman(1990) HI maps, determined using the HEASARC NH Tool8, while the foreground LMC absorption
component, with abundances set to those of the LMC, was al-lowed to vary in the spectral fits.
The particle-induced background of the EPIC consists of the quiescent particle background (QPB), instrumental fluorescence lines, electronic read-out noise, and residual soft proton (SP) contamination. To determine the contribution of these compo-nents we made use of vignetting corrected FWC data. We ex-tracted FWC spectra from the same detector regions as the ob-servational source and background spectra. The EPIC-pn and EPIC-MOS FWC spectra were fitted with the empirical models developed bySturm(2012) andMaggi et al.(2015), respectively. Since these spectral components are not subject to the instru-mental response, we used a diagonal response in XSPEC. The resulting best-fit model was included and frozen in the fits to the observational spectra, with only the widths and normalisations
7 http://www.atomdb.org/index.php
8 http://heasarc.gsfc.nasa.gov/cgi-bin/Tools/w3nh/
P. J. Kavanagh et al.: XMM-Newton study of MCSNR J0512−6707 45.0 40.0 35.0 5:12:30.0 25.0 20.0 15.0 10.0 05.5 06.0 06.5 -67:07.0 07.5 08.0 08.5 09.0
RA (J2000)
D
EC
(J2000)
1.21e-06 1.23e-06 1.26e-06 1.33e-06 1.46e-06 1.73e-06 2.26e-06 3.33e-06 5.47e-06 9.70e-06 1.81e-05
45.0 40.0 35.0 5:12:30.0 25.0 20.0 15.0 10.0 05.5 06.0 06.5 -67:07.0 07.5 08.0 08.5 09.0
RA (J2000)
D
EC
(J2000)
1.21e-06 1.23e-06 1.26e-06 1.33e-06 1.46e-06 1.73e-06 2.26e-06 3.33e-06 5.47e-06 9.70e-06 1.81e-05
45.0 40.0 35.0 5:12:30.0 25.0 20.0 15.0 10.0 05.5 06.0 06.5 -67:07.0 07.5 08.0 08.5 09.0
RA (J2000)
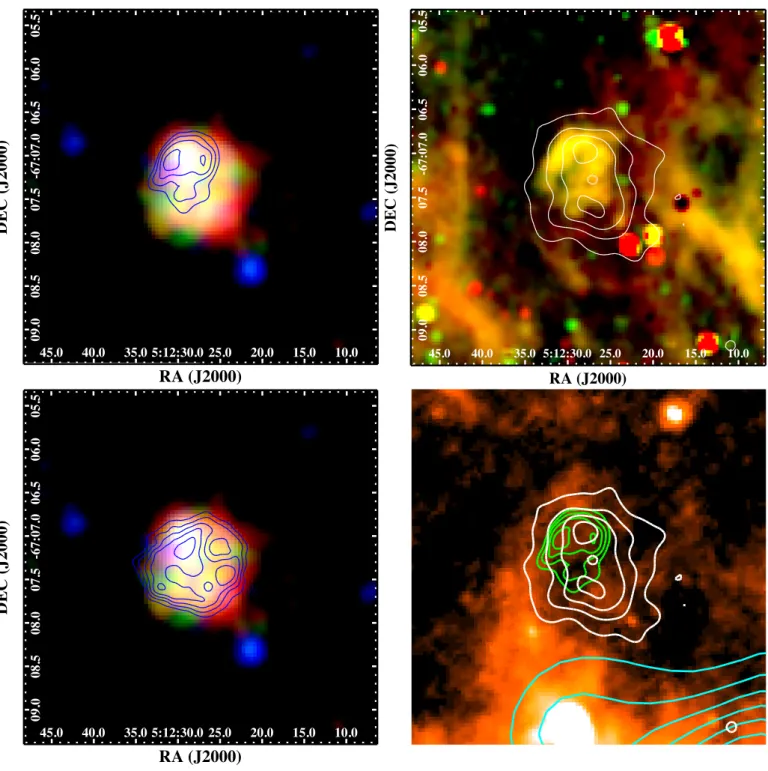
D EC (J2000) 0 0.0036 0.011 0.025 0.053 0.11 0.22 0.45 0.9 1.8 3.6 0 1 2 6 12 26 52 104 208 416 829Fig. 3.Top left: XMM-NewtonEPIC image of MCSNR J0512−6707 in false colour with RGB corresponding to 0.3–0.7 keV, 0.7–1.1 keV, and 1.1–4.2 keV. The image is overlaid with [S
]/Hα contours with the lowest level corresponding to [S
]/Hα = 0.4, and the remaining levels at 25%, 50%, and 75% of the maximum above this level. Top right: continuum subtracted MCELS image of MCSNR J0512−6707 with Hα in red and [S
] shown in green overlaid with 0.3–0.7 keV contours. The lowest contour level represents 3σ above the average background surface brightness, with the remaining levels marking 25%, 50%, and 75% of the maximum above this level. Bottom left: same as top left but with 20 cm radio contours from Fig.1overlaid. The contours are at 1.5, 2.0, 2.5, 3.0, and 3.5 mJy/beam. Bottom right: Spitzer MIPS 24 µm image of the MCSNR J0512−6707region with the X-ray contours from top right in white and [S
]/Hα contours from top left in green. The cyan contours represent the CO emission from the MAGMA survey and delineate the location of the molecular cloud [WHO2011] A126. The lowest level corresponds to 1.2 K km s−1(theapproximate sensitivity limit of the survey), increasing in steps of 1 K km s−1. The image scale is the same as in all other panels.
of the fluorescence lines allowed to vary. We also included a multiplicative constant to normalise the continuum to the obser-vational spectra using the high energy tail (E > 5 keV) where the QPB component dominates. The residual SP contamination was fitted by a power law not convolved with the instrumental response (Kuntz & Snowden 2008), which was only required in the spectra of Obs. ID 0741800301.
3.3.2. Source emission
Depending on the age and ambient ISM density of an SNR, the X-ray emission is expected to be dominated by shock-heated ISM swept-up by the blast wave and/or reverse shock-heated ejecta. The swept-up ISM component should have abundances consistent with the LMC, whereas the ejecta component will be A121, page 5 of10
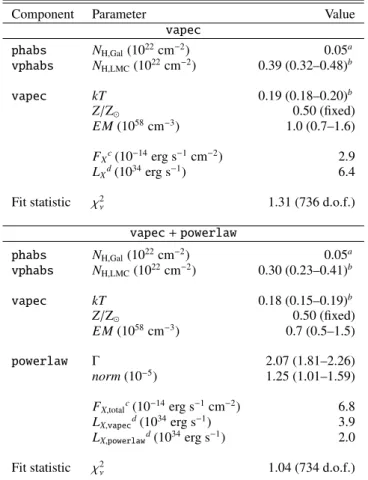
Table 1. Spectral fit results MCSNR J0512−6707.
Component Parameter Value
vapec phabs NH,Gal(1022cm−2) 0.05a vphabs NH,LMC(1022cm−2) 0.39 (0.32–0.48)b vapec kT 0.19 (0.18–0.20)b Z/Z 0.50 (fixed) E M(1058cm−3) 1.0 (0.7–1.6) FXc(10−14erg s−1cm−2) 2.9 LXd(1034erg s−1) 6.4 Fit statistic χ2 ν 1.31 (736 d.o.f.) vapec+ powerlaw phabs NH,Gal(1022cm−2) 0.05a vphabs NH,LMC(1022cm−2) 0.30 (0.23–0.41)b vapec kT 0.18 (0.15–0.19)b Z/Z 0.50 (fixed) E M(1058cm−3) 0.7 (0.5–1.5) powerlaw Γ 2.07 (1.81–2.26) norm(10−5) 1.25 (1.01–1.59) FX,totalc(10−14erg s−1cm−2) 6.8 LX,vapecd(1034erg s−1) 3.9 LX,powerlawd(1034erg s−1) 2.0 Fit statistic χ2 ν 1.04 (734 d.o.f.)
Notes. See text for description of the models. The numbers in parenthe-ses are the 90% confidence intervals.(a)Fixed to the Galactic column
density from theDickey & Lockman(1990) HI maps.(b) Absorption
and thermal component abundances fixed to those of the LMC.
(c)0.3–10 keV absorbed X-ray flux.(d)0.3–10 keV de-absorbed X-ray
luminosity, adopting a distance of 50 kpc to the LMC.
characterised by strong emission lines from its metal content. A cursory scan of the extracted spectra showed emission lines below 1 keV, however, these did not appear to be significantly enhanced and do not suggest a shocked-ejecta component. The spectrum above 1 keV was notably featureless with no evidence for emission lines.
As a first attempt to model the X-ray emission from MCSNR J0512−6707, we included a single thermal plasma model of LMC abundance absorbed by foreground Galactic and LMC material on top of the AXB and particle-induced back-ground. We initially assumed that the plasma was in collisional ionisation equilibrium (CIE), and therefore applied the vapec (Smith et al. 2001) model. The abundance of the LMC absorp-tion component was fixed to the LMC values (0.5 Z ,Russell
& Dopita 1992). The best-fit vapec model (see Table1 for fit results), with kT ∼ 0.2 keV, adequately accounts for the emis-sion below ∼1 keV but cannot explain the harder emisemis-sion above 1 keV (see Fig.4-left). This is reflected in the fit-statistic with re-duced χ2 (χ2ν) = 1.31. In initial test fits we also allowed the O and Fe abundance parameters in the vapec component to vary to search for signatures of ejecta emission, with O and Fe being the dominant constituents of CC and Type Ia explosive nucleosyn-thesis products, respectively. However, the resulting confidence
ranges on these parameters were consistent with the LMC val-ues, and we therefore kept the fixed LMC abundances.
We relaxed our assumption of a CIE plasma and made use of a non-equilibrium ionisation (NEI) model in XSPEC ap-propriate for SNRs, namely the plane-parallel vpshock model (Borkowski et al. 2001). The vpshock model features a lin-ear distribution of ionisation ages behind the shock which is more realistic than single ionisation age models such as vnei. While this model resulted in a substantially improved fit-statistic (χ2
ν = 1.11), the best-fit model suggested a very high plasma
temperature (kT > 4 keV) and very low ionisation parameter (τu < 1010 s cm−3). Such spectral parameters are necessary to
account for the hard tail above 1 keV. Allowing abundance pa-rameters to vary to account for possible ejecta signatures did not improve the fit. Given the very high plasma temperature and very low ionisation parameter, we were reluctant to take the fit results as the true physical description of the SNR emission, though it was clear that some component must be introduced to account for the harder emission above 1 keV.
Therefore, we applied a simple two component fit with a thermal plasma and an additional power law (powerlaw in XSPEC). In trial fits we applied both the vapec and vpshock model to represent the softer emission component. However, since the plasma temperature and ionisation parameter (though poorly constrained) are consistent with a plasma in CIE, we pro-ceed using the vapec model to account for the soft component. The vapec+powerlaw model resulted in an improved fit over both single thermal plasma models with χ2
ν = 1.04. The vapec
model parameters are largely consistent with the single vapec fit (kT ∼ 0.2 keV), and the harder emission is accounted for by the power law withΓ = 2.07 (1.81−2.26), see Table1and Fig.4-right. We note here that we also tried a two-temperature fit employing the vpshock model for the harder component. While this yielded a good fit ( χ2
ν = 1.10) the best-fit temperature and
ionisation parameter of the vpshock component were poorly constrained with the best-fit driven to high temperature and low ionisation parameter to handle the hard, featureless emission. However, we note that the hard emission may be modelled with either a power law or a thermal plasma.
4. Results
4.1. Multi-wavelength morphology
The X-ray emission from MCSNR J0512−6707 is approx-imately circular, though slightly extended in the northeast-southwest direction, with the brightest region of emission in the northeast (Fig.3top-left). Emission from the remnant is detected in all energy bands with the softest emission tracing the outer edge, and the hardest emission localised in the northeastern re-gion and correlated with the brightest radio emission (Figs.3 bottom-left and1) and the enhanced [S
] emission detected in the optical (Figs. 3 top-left and top-right). The MIPS 24 µm image (Fig.3 bottom-right) reveals a possible reason for this. The remnant is projected against a denser eastern region, as evident by a large arm of cool material emanating from the [WHO2011] A126 molecular cloud to the south and southwest, bordering the eastern front of the SNR, as noted byReid et al. (2015). If indeed the SNR is expanding into this cool material to the east, the higher density in the east compared to the west can explain the observed multi-wavelength morphological properties of MCSNR J0512−6707. There is no evidence that the SNR is interacting with [WHO2011] A126 itself.P. J. Kavanagh et al.: XMM-Newton study of MCSNR J0512−6707 10−3 0.01 0.1 normalized counts s − 1 keV − 1
data and folded model
1 0.5 2 5 −4 −2 0 2 4 χ Energy (keV) paddy 6−Jul−2015 15:27 10−3 0.01 0.1 normalized counts s − 1 keV − 1
data and folded model
1 0.5 2 5 −4 −2 0 2 4 χ Energy (keV) paddy 6−Jul−2015 15:28
Fig. 4.XMM-NewtonEPIC-pn spectrum of MCSNR J0512−6707 from Obs. ID 0741800201, shown alone for clarity. In each panel the best-fit model is given by the solid black line, the purple dash-dot lines mark the AXB components, the blue dash-dot-dot-dot line shows the combined contributions of the QPB, residual SPs, instrumental fluorescence lines, and electronic noise. Left: best-fit vapec model shown by the dashed red line. Right: best-fit vapec+powerlaw model shown by the dashed red line and dashed green line, respectively. The model fit parameters are given in Table1. Note that the instrumental fluorescence line normalisations are free in each fit and adjust themselves according to the residuals at their respective energies.
The 20 cm radio morphology exhibits a more shell-like struc-ture than the X-ray or optical. The radio polarisation images (Fig.2), the 6 cm in particular, indicate a higher degree of po-larisation in the northwest and southeast, tangentially oriented to the SNR shock front. Such a polarisation structure typically indicates evolved SNR shells (Fürst & Reich 2004), with the tangentially oriented magnetic fields indicative of compression of the ISM threading magnetic field.
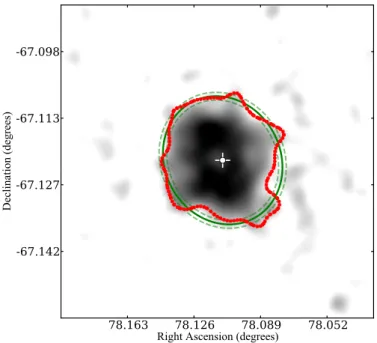
To estimate the size of the X-ray remnant we determined the average background surface brightness and corresponding standard deviation (σ) in the 0.3–0.7 keV band. We defined the edge of the SNR as regions where the extended emission sur-face brightness rises to 3σ above the average background and fitted an ellipse to this contour. The error on the fit was deter-mined by quantifying the standard deviation of points on the contour from the best-fit ellipse. We determined a best-fit el-lipse centred on the J2000 coordinates RA= 05h12m26.87sand
Dec= −67d07m21.7s, of size 1.072 (±0.010) × 1.051 (±0.010), cor-responding to 24.9 (±1.5) × 21.9 (±1.5) pc at the LMC distance, with the major axis rotated ∼29◦ east of north. The best-fit di-mensions and error are shown in Fig.5.
4.2. X-ray emission
The X-ray spectrum of MCSNR J0512−6707 is rather puzzling. There are obvious thermal features below ∼1 keV, which are eas-ily fitted with a thermal plasma component in CIE. However, this leaves significant residuals above ∼1 keV. An NEI plasma can account for both the soft and hard parts of the spectrum, but the resulting parameters do not provide a satisfactory physical interpretation of the X-ray emission. The addition of a second component in the form of a power law, provides the best fit to the spectrum, though again presents problems in the physical in-terpretation, which we now discuss.
4.2.1. Soft emission
We found no spectral signatures of ejecta, suggesting that the soft thermal plasma is dominated by swept-up ISM. This, and the
78.163
78.126
78.089
78.052
Right Ascension (degrees)
-67.142
-67.127
-67.113
-67.098
Declination (degrees)
Fig. 5.Combined 0.3–0.7 keV EPIC image of MCSNR J0512−6707. The red points delineate the contour level corresponding to 3σ above the average background surface brightness. The green solid line shows the best-fit ellipse to the contour, with the dashed lines indicating the 1σ error on the fit. The white plus-sign marks the best-fit centre of the SNR.
low plasma temperature (kT ∼ 0.2 keV), are consistent with an SNR in the Sedov phase of its evolution. Using the best-fit vapec parameters for both the single vapec and vapec+powerlaw models, and the Sedov solution, we estimated some proper-ties of the remnant (see Sasaki et al. 2004; Kavanagh et al. 2015b, for example). However, for both the one and two com-ponent models, the derived SNR properties indicate a break-down of the Sedov model with the determined upper limit on initial explosion energy an order of magnitude less than the canonical 1051erg. Therefore, the soft thermal component of the
MCSNR J0512−6707 spectrum is not consistent with an SNR in the Sedov phase.
If the remnant is not in the Sedov phase, then, given its rela-tively small size of ∼25 × 22 pc, we might expect to see at least some ejecta contribution. One possible explanation that can ex-plain both the soft thermal emission of LMC abundance and the lack of ejecta emission is that the blast wave may have recently encountered a shell of dense material which it is now propagat-ing into. This would be the case if MCSNR J0512−6707 resulted from a CC explosion and the progenitor stellar wind has mod-ified the ambient medium creating a large, low-density cavity surrounded by a dense shell of ISM. Such stellar wind blown bubbles can have radii of the order of 10 pc (e.g.,Weaver et al. 1977;Chen et al. 2013), which is in agreement with the radius of MCSNR J0512−6707 of ∼12 pc. In such a scenario, the rem-nant would have initially swept-up the circumstellar medium, then expanded into the low-density wind-blown cavity, before interacting with the dense shell (Dwarkadas 2005). When the blast wave encounters the dense shell, a shock is transmitted into the shell with significantly reduced velocity and a reflected shock travels back into the low-density interior which contains the ejecta. However, as shown byDwarkadas & Dewey(2013) applied to the case of the Galactic remnant Kes 27, the emissiv-ity of the shocked ejecta is much lower than the shocked shell material, given the dramatic difference in densities. Therefore, only the shocked-shell emission would be observed which, given reduced transmitted shock velocity and the shell composition, would exhibit a soft thermal spectrum with ISM abundances. In Sect. 4.3, we refer to secondary evidence in the literature that MCSNR J0512−6707 does indeed result from a CC explosion and, therefore, the early evolution of the SNR into a wind-blown cavity is possible.
4.2.2. Hard emission
The origin of the hard emission presents a significant problem in its physical interpretation. We initially considered that the hard component may be due to a point source embedded in the extended emission of the SNR, most likely a background active galactic nucleus (AGN). During our analysis we per-formed a source detection using the SAS task edetect_chain (see Kavanagh et al. 2015b, for a full description of the de-tection method). However, the resulting sources located within the extent of SNR were identified as false detections due to the extended emission. We also searched in AGN catalogues for sources located within the extent of MCSNR J0512−6707 but found nothing. A further test of a possible AGN origin lies in the X-ray spectrum. If the hard component is the result of a back-ground AGN, we should expect that the hard component is more absorbed than the soft thermal component. Therefore, we per-formed spectral fits allowing for the additional absorption of the hard component. However, the hydrogen column density tended to zero, with an upper limit of ∼1 × 1021 cm−2, indicating no
additional absorption of the hard emission. For these reasons, we conclude that the hard X-ray emission is associated with MCSNR J0512−6707 and not due to a point source.
The hard emission is well fitted with either a simple power law or a high-kT , low-τ thermal plasma model of LMC abun-dance. Unfortunately, we are hampered in statistically distin-guishing between these models because of the low count statis-tics at energies above ∼2 keV. Therefore, we now discuss possible non-thermal and thermal origins of the emission.
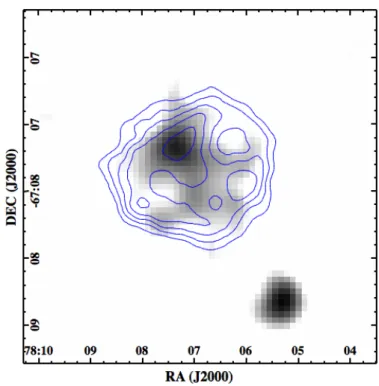
Fig. 6.XMM-NewtonEPIC image of MCSNR J0512−6707 in the 2.0– 4.5 keV range. The image was produced following the same procedure outlined in Sect.3.2and is overlaid with 20 cm radio contours from Fig.3– bottom left.
Non-thermal
Morphologically, the SNR emission above ∼2 keV is enhanced towards the northeast of the remnant, with the brightest hard X-ray emission correlated with the brightest region of radio emission (see Fig.6). In addition, this approximately correlates with the region where the polarisation fraction of the magnetic field is low and the magnetic field is oriented quasi-parallel to the SNR shock front (see Fig.2), conditions favourable for par-ticle acceleration and magnetic turbulence generation (Reynoso et al. 2013). This suggests that the hard X-ray emission could be due to synchrotron emission from very high energy electrons. However, shock speeds of the order of 103 km s−1 are still
re-quired for diffusive shock acceleration and X-ray synchrotron emission (see, e.g.,Vink 2012). The temperature of the soft ther-mal X-rays is not compatible with such shock speeds. The re-flected shock velocity may be high enough, especially relative to the expanding ejecta which it is moving into, though it is un-clear if the synchrotron emissivity could explain the observed luminosity.
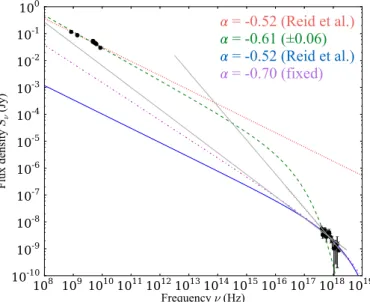
To assess if the radio and X-ray data are compatible with the emission from a single electron population, we created a spectral energy distribution (SED). Integrated flux densities in the radio regime were reported in Reid et al. (2015, their Table 4). We adopt these values for the radio points on the SED. For the X-ray points, we used the EPIC-pn spectrum from Obs. ID 0741800201, the EPIC spectrum with the most counts. We then subtracted the background spectrum to ensure as much as possible that only X-rays due to MCSNR J0512−6707 were present. We confined our analysis to the 2−7 keV energy range to isolate the portion of the spectrum where the hard component is dominant. The radio and X-ray data points are shown in Fig.7. We initially fitted the SED with a straight power law but it was immediately clear the X-ray fluxes were much lower than suggested by the radio data, which is expected if the
P. J. Kavanagh et al.: XMM-Newton study of MCSNR J0512−6707 𝛼 = -0.52 (Reid et al.)
𝛼 = -0.61 (±0.06)
𝛼 = -0.52 (Reid et al.)
𝛼 = -0.70 (fixed)
Fig. 7.SED of MCSNR J0512−6707. The data points at the lower fre-quencies are the radio flux densities reported inReid et al.(2015). The data at the higher frequencies correspond to the background-subtracted EPIC-pn spectrum from Obs. ID 0741800201 in the 2–7 keV range, which excludes the contribution of the soft X-ray component. The red dotted line shows the power-law fit to the radio data, the green dashed line shows the exponentially cut-off power law fit to the entire SED, the magenta dash-dot line shows the exponentially cut-off power law fit to the X-ray data with α fixed to −0.7, and the blue solid line shows the ex-ponentially cut-off power law fit to the X-ray data with α fixed to –0.52 determined byReid et al.(2015). The grey lines indicate the upper and lower limit of the photon index in the X-ray power law fit (see Table1).
electrons are close to the maximum energy of the relativistic electron distribution. We therefore applied a cut-off electron distribution of the form Ne(E) = KE−se−E/Emax, where E is the
electron energy, Emax the cut-off energy, s is the spectral index
of the electron distribution, and K a constant. The spectral index of the electron distribution is related to the spectral index of the photon distribution α as α = (s−1)/2. We make the simplifying assumption that each electron emits all its energy at its characteristic frequency (the δ-function approximation), and thus the resulting photon spectrum cuts off as e−(ν/νmax)1/2
(Reynolds 1998). This cut-off function provides a very poor fit to the SED of MCSNR J0512−6707 with α = −0.61 (±0.06), and νmax = 1.8 (±0.8) × 1016 Hz (shown by the green dashed
line in Fig.7). Indeed, this fit is incompatible with the photon index confidence intervals determined in the fits to the hard X-ray emission (see Table 1). These confidence intervals are shown by the grey lines in Fig. 7. Therefore, we concluded that the combined radio and hard X-ray SED is not derived from the same electron population. This might be the case of the hard X-ray emission originates from specific regions of the SNR, as already indicated by its morphology. In the case of the SNR interaction with a dense shell, as suggested by the soft thermal X-rays, the integrated radio emission is made up of synchrotron emission from electrons behind the transmitted shock and any high velocity shocks, if present. The hard X-rays, on the other hand, are emitted near high velocity shocks only. We attempted to quantify the expected radio flux densities from electrons behind the high velocity shocks as follows: we adopted the radio spectral index of Reid et al. (2015), α = −0.52, which is consistent with the typical value for SNRs (shown by the red dotted line in Fig.7); we then fixed the value of α in the cut-off function to –0.52 and applied this model to
the X-ray data only, resulting in the blue curve shown in Fig.7. Comparing the blue curve to the radio data points indicates that the expected radio flux densities for α = −0.52 are more than two orders of magnitude lower than observed. However, we expect this to be a lower limit since young remnants with very fast shocks have radio spectral indices of α ∼ −0.7. Fixing α in the cut-off function to this value results in the magenta dash-dot line in Fig. 7, and the expected radio flux densities are now about one order of magnitude below the observed value, which is not an unreasonably low or high estimate. Unfortunately, without deeper and higher spatial resolution radio and X-ray observations, it is impossible to create SEDs for individual regions of the SNR and, therefore, to confirm if the hard X-rays result from synchrotron emission.
Thermal
The reflected shock may also be employed in a thermal origin for the hard X-rays. While the transmitted shock is slowed signifi-cantly as it moves into the dense shell, the reflected shock travels back through the still expanding ejecta, further heating the al-ready shocked gas. Such a reflected shock-heating scenario has been used to explain the observed morphology at shock-cloud interaction regions in the Cygnus Loop (Levenson et al. 2002).
Another, though somewhat less likely, thermal explanation for the hard emission is the presence of a background galaxy cluster projected against the SNR. The hot intracluster medium of these objects can be described by CIE models with kT val-ues up to ∼10 keV (for a review, seeBöhringer & Werner 2010). At such high temperatures, the spectrum is effectively feature-less, which is especially true for low metallicity plasmas. Trial fits with a CIE plasma model in place of the power-law result in acceptable fits of equivalent goodness. However, the required chance alignment of a background galaxy cluster, located at the position of MCSNR J0512−6707 with a compatible morphol-ogy, makes this explanation for the hard component extremely tenuous. In addition, the correlation of the synchrotron radio emission with Bremsstrahlung dominated galaxy cluster X-ray emission makes no physical sense.
We have briefly discussed some possible origins for the hard X-ray emission from MCSNR J0512−6707 here but we cannot offer a definitive explanation. Deep high spatial resolution obser-vations with Chandra would allow the morphology of the hard emission region to be properly traced, helping to better identify the origin of the hard X-rays.
4.3. Progenitor type
The apparent association of MCSNR J0512−6707 with the DEM L97 HII region (Davies et al. 1976) and the proxim-ity to the [WHO2011] A126 molecular cloud (Wong et al. 2011) would qualitatively favour a CC origin for the SNR. Unfortunately, given the lack of ejecta signatures in the X-ray spectrum, it is not possible to suggest a supernova remnant type directly.
A secondary indicator for the SN type is the local stellar pop-ulation and star formation history (SFH). For example, a local stellar population harbouring many massive early-type stars and a corresponding recent burst of star formation would indicate that the SNR is most likely the result of a core-collapse explo-sion. Similarly, the absence of such a high mass stellar popula-tion and recent star formapopula-tion burst would point to a Type Ia origin. While this typing method is not infallible (see Maggi et al. 2015, for a detailed description of the method and caveats) it still offers a good indication of the likely SN type and has been A121, page 9 of10
used in the past to gauge the explosion scenarios for a number of evolved LMC remnants (e.g.,Kavanagh et al. 2013;Maggi et al. 2014;Bozzetto et al. 2014).
Maggi et al. (2015) performed a stellar population and SFH analysis of all confirmed SNRs in the LMC using photometric data from Zaritsky et al. (2004) and the spa-tially resolved SFH maps of Harris & Zaritsky (2009). They identified 25 massive OB stars located within 100 pc of MCSNR J0512−6707, inferring an expected CC/Type Ia ratio for the region of 5.56+1.2−2.66 (their Table C.1). These factors in-dicate that MCSNR J0512−6707 most likely resulted from a CC event.
5. Summary
We presented a study of MCSNR J0512−6707 in the LMC and supplemented this with optical, radio, and IR data to gain an understanding of the physical properties of the SNR. The main findings of our analysis can be summarised as follows:
– We showed that the ROSAT source [HP99 483] is the X-ray counterpart of the supernova remnant MCSNR J0512−6707 identified by Reid et al. (2015). However, we determined that the remnant is larger than determined by Reid et al. (2015) from the optical emission. We suggested that the op-tical emission is confined to a region where the remnant ap-pears to be expanding into a denser ambient medium. – The 20 cm radio morphology exhibits a shell-like structure.
Radio polarisation images at 3 cm and 6 cm in particu-lar, indicate a higher degree of polarisation in the northwest and southeast, tangentially oriented to the SNR shock front, indicative of an SNR where the expanding shell has com-pressed the magnetic field threading the ambient ISM. – The X-ray spectrum of MCSNR J0512−6707 is unusual in
that it exhibits soft emission lines which are consistent with a soft thermal plasma in collisional ionisation equilibrium, but also shows featureless hard emission. We suggested that the soft thermal X-rays can be explained by a remnant initially evolving into the wind-blown cavity of a progenitor massive star and is now interacting with the surrounding dense shell. We discuss some possible thermal and non-thermal emission mechanisms for the hard X-ray component, though the true origin of these X-rays remains unclear. We found no spectral signatures of shocked ejecta.
– The location of MCSNR J0512−6707 in the DEM L97 HII region and at the edge of the [WHO2011] A126 molecu-lar cloud points to a core-collapse origin to the remnant. Due to the lack of ejecta signatures, we cannot directly determine the supernova type from the X-ray spectrum. Indirect evi-dence for the explosion mechanism is found in the study of the local stellar population and star formation history study ofMaggi et al.(2015), which, because of the large number of nearby OB stars and recent star formation burst, suggest a core-collapse origin. This is consistent with the SNR evolu-tion into a the wind-blown cavity suggested above.
Acknowledgements. We thank the anonymous referee for reviewing our manuscript. P.J.K. acknowledges support from the Bundesministerium für Wirtschaft und Technologie/Deutsches Zentrum für Luft- und Raumfahrt (BMWi/DLR) through grant FKZ 50 OR 1309. M.S. acknowledges support by the Deutsche Forschungsgemeinschaft through the Emmy Noether Research Grant SA2131/1-1. P. M. acknowledges support by the Centre National d’Études Spatiales (CNES). Cerro Tololo Inter-American Observatory (CTIO) is operated by the Association of Universities for Research in Astronomy Inc. (AURA), under a cooperative agreement with the National Science Foundation (NSF) as part of the National Optical Astronomy Observatories (NOAO). We gratefully acknowledge the support of CTIO and all the assistance that was provided for
upgrading the Curtis Schmidt telescope. The MCELS project has been supported in part by NSF grants AST-9540747 and AST-0307613, and through the gener-ous support of the Dean B. McLaughlin Fund at the University of Michigan, a bequest from the family of Dr. Dean B. McLaughlin in memory of his last-ing impact on Astronomy. We used the karma software package developed by the ATNF. The Australia Telescope Compact Array is part of the Australia Telescope, which is funded by the Commonwealth of Australia for operation as a National Facility managed by CSIRO.
References
Arnaud, K. A. 1996, in Astronomical Data Analysis Software and Systems V, eds. G. H. Jacoby, & J. Barnes,ASP Conf. Ser., 101, 17
Balucinska-Church, M., & McCammon, D. 1992,ApJ, 400, 699
Böhringer, H., & Werner, N. 2010,A&ARv, 18, 127
Borkowski, K. J., Lyerly, W. J., & Reynolds, S. P. 2001,ApJ, 548, 820
Bozzetto, L. M., Kavanagh, P. J., Maggi, P., et al. 2014,MNRAS, 439, 1110
Bozzetto, L. M., Filipovi´c, M. D. Maggi, P., Haberl, F., et al. 2015, MNRAS, submitted
Chen, L.-W., Fabian, A. C., & Gendreau, K. C. 1997,MNRAS, 285, 449
Chen, Y., Zhou, P., & Chu, Y.-H. 2013,ApJ, 769, L16
Davies, R. D., Elliott, K. H., & Meaburn, J. 1976,MRAS, 81, 89
di Benedetto, G. P. 2008,MNRAS, 390, 1762
Dickey, J. M., & Lockman, F. J. 1990,ARA&A, 28, 215
Dwarkadas, V. V. 2005,ApJ, 630, 892
Dwarkadas, V. V., & Dewey, D. 2013,High Energy Density Physics, 9, 22
Fazio, G. G., Hora, J. L., Allen, L. E., et al. 2004,ApJS, 154, 10
Fesen, R. A., Blair, W. P., & Kirshner, R. P. 1985,ApJ, 292, 29
Filipovic, M. D., Haynes, R. F., White, G. L., & Jones, P. A. 1998,A&AS, 130, 421
Fürst, E., & Reich, W. 2004, in The Magnetized Interstellar Medium, eds. B. Uyaniker, W. Reich, & R. Wielebinski, 141
Gooch, R. 1995, in Astronomical Data Analysis Software and Systems IV, eds. R. A. Shaw, H. E. Payne, & J. J. E. Hayes,ASP Conf. Ser., 77, 144
Haberl, F., & Pietsch, W. 1999,A&AS, 139, 277
Harris, J., & Zaritsky, D. 2009,AJ, 138, 1243
Haynes, R. F., Klein, U., Wayte, S. R., et al. 1991,A&A, 252, 475
Jansen, F., Lumb, D., Altieri, B., et al. 2001,A&A, 365, L1
Kavanagh, P. J., Sasaki, M., Points, S. D., et al. 2013,A&A, 549, A99
Kavanagh, P. J., Sasaki, M., Bozzetto, L. M., et al. 2015a,A&A, 573, A73
Kavanagh, P. J., Sasaki, M., Whelan, E. T., et al. 2015b,A&A, 579, A63
Kuntz, K. D., & Snowden, S. L. 2008,A&A, 478, 575
Kuntz, K. D., & Snowden, S. L. 2010,ApJS, 188, 46
Levenson, N. A., Graham, J. R., & Walters, J. L. 2002,ApJ, 576, 798
Maggi, P., Haberl, F., Kavanagh, P. J., et al. 2014,A&A, 561, A76
Maggi, P., Haberl, F., Kavanagh, P. J., et al. 2015, A&A, in press, DOI: 10.1051/0004-6361/201526932
Mathewson, D. S., & Clarke, J. N. 1973,ApJ, 179, 89
Meixner, M., Gordon, K. D., Indebetouw, R., et al. 2006,AJ, 132, 2268
Nikolaev, S., Drake, A. J., Keller, S. C., et al. 2004,ApJ, 601, 260
Reid, W. A., Stupar, M., Bozzetto, L. M., Parker, Q. A., & Filipovic, M. D. 2015,
MNRAS, 454, 991
Reynolds, S. P. 1998,ApJ, 493, 375
Reynoso, E. M., Hughes, J. P., & Moffett, D. A. 2013,AJ, 145, 104
Rieke, G. H., Young, E. T., Engelbracht, C. W., et al. 2004,ApJS, 154, 25
Russell, S. C., & Dopita, M. A. 1992,ApJ, 384, 508
Sasaki, M., Plucinsky, P. P., Gaetz, T. J., et al. 2004,ApJ, 617, 322
Sault, R. J., Teuben, P. J., & Wright, M. C. H. 1995, in Astronomical Data Analysis Software and Systems IV, eds. R. A. Shaw, H. E. Payne, & J. J. E. Hayes,ASP Conf. Ser., 77, 433
Smith, R. K., Brickhouse, N. S., Liedahl, D. A., & Raymond, J. C. 2001,ApJ, 556, L91
Smith, R. C., Points, S. D., & Winkler, F. 2006,NOAO Newsletter, 85, 6
Snowden, S. L., Mushotzky, R. F., Kuntz, K. D., & Davis, D. S. 2008,A&A, 478, 615
Strüder, L., Briel, U., Dennerl, K., et al. 2001,A&A, 365, L18
Sturm, R. K. N. 2012, Ph.D. Thesis, Fakultät für Physik, Technische Universität München, Germany
Turner, M. J. L., Abbey, A., Arnaud, M., et al. 2001,A&A, 365, L27
van der Marel, R. P., & Cioni, M.-R. L. 2001,AJ, 122, 1807
Vink, J. 2012,A&ARv, 20, 49
Weaver, R., McCray, R., Castor, J., Shapiro, P., & Moore, R. 1977,ApJ, 218, 377
Werner, M. W., Roellig, T. L., Low, F. J., et al. 2004,ApJS, 154, 1
Wilms, J., Allen, A., & McCray, R. 2000,ApJ, 542, 914
Wong, T., Hughes, A., Ott, J., et al. 2011,ApJS, 197, 16