OATAO is an open access repository that collects the work of Toulouse
researchers and makes it freely available over the web where possible
Any correspondence concerning this service should be sent
to the repository administrator:
[email protected]
This is an author’s version published in: http://oatao.univ-toulouse.fr/24547
To cite this version:
Deng, Yiming
and Ansart, Renaud
and Baeyens, Jan and Huili,
Zhang Flue Gas Desulphurization in Circulating Fluidized Beds. (2019)
Energies, 12 (20). 1-19. ISSN 1996-1073
Official URL: https://doi.org/10.3390/en12203908
Open Archive Toulouse Archive Ouverte
Energies 2019, 12, 3908; doi:10.3390/en12203908 www.mdpi.com/journal/energies
Article
Flue Gas Desulphurization in Circulating
Fluidized Beds
Yimin Deng 1, Renaud Ansart 1, Jan Baeyens 2 and Huili Zhang 3,*
1 Laboratoire de Génie Chimique, Université de Toulouse, CNRS, INPT, UPS, 31432 Toulouse Cedex 4, France; [email protected]‐toulouse.fr (Y.D.); renaud.ansart@toulouse‐inp.fr (R.A.) 2 Beijing Advanced Innovation Centre of Soft Matter and Engineering, Beijing University of Chemical Technology, Beijing 100029, China; [email protected] 3 School of Life Science and Technology, Beijing University of Chemical Technology, Beijing 100029, China; [email protected] * Correspondence: [email protected]; Tel.: +86‐135‐8196‐2967 Received: 4 September 2019; Accepted: 12 October 2019; Published: 15 October 2019
Abstract: Sulphur dioxide (SO2) is mostly emitted from coal‐fueled power plants, from waste
incineration, from sulphuric acid manufacturing, from clay brick plants and from treating nonferrous metals. The emission of SO2 needs to be abated. Both wet scrubbing (absorption) and
dry or semi‐dry (reaction) systems are used. In the dry process, both bubbling and circulating fluidized beds (BFB, CFB) can be used as contactor. Experimental results demonstrate a SO2‐removal
efficiency in excess of 94% in a CFB application. A general model of the heterogeneous reaction is proposed, combining the external diffusion of SO2 across the gas film, the internal diffusion of SO2
in the porous particles and the reaction as such (irreversible, 1st order). For the reaction of SO2 with
a fine particulate reactant, the reaction rate constant and the relevant contact time are the dominant parameters. Application of the model equations reveals that the circulating fluidized bed is the most appropriate technique, where the high solid to gas ratio guarantees a high conversion in a short reaction time. For the CFB operation, the required gas contact time in a CFB at given superficial gas velocities and solids circulation rates will determine the SO2 removal rate. Keywords: SO2 abatement; dry or semi‐dry reaction; calcium oxide; model; efficiency 1. Introduction 1.1. An Overiew of the Sulphur Problem SO2 is mostly related to energy generation from fossil fuels. The International Energy Agency (IEA) reported that fossil fuels account for over 80% of the word energy supply [1]. In China, about 70% of the energy is provided by coal and fuel oil. Although the combustion of fossil fuels is the dominant contribution for anthropogenic CO2 emission [2], the combustion‐derived emissions of NOx
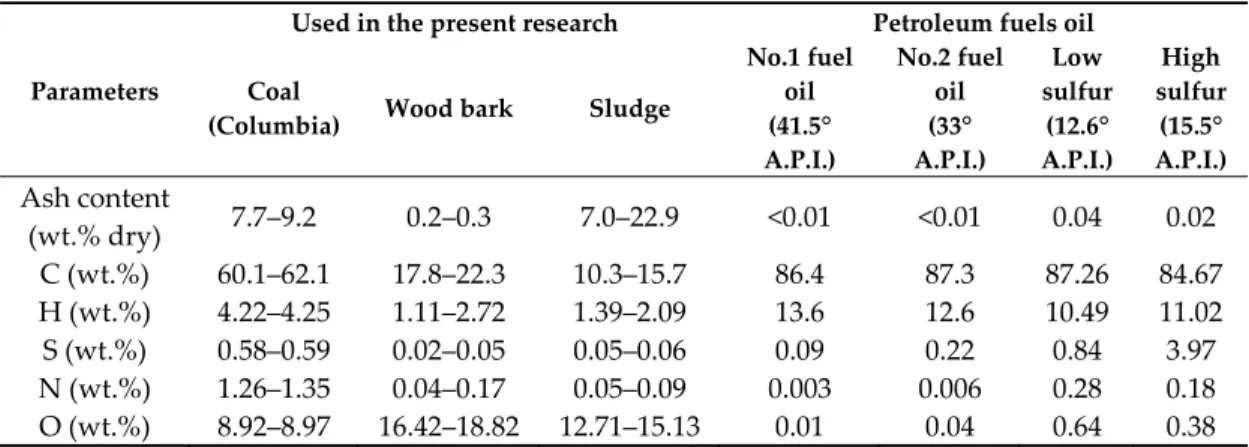
and SO2 are also important towards atmospheric pollution. The ultimate analysis of some fuels
determines the composition and the extent of the possible SO2 problem. Table 1 illustrates some
example compositions. Even biomass or waste activated sewage sludge contain non‐negligible S‐ contents.
The NOx problem related to combustion has been extensively dealt with by Mahmoudi et al. [3].
The emission and abatement of SO2 merits a further attention, especially in the field of in‐situ removal
from waste incineration and fuel combustion, it also originates from sulphuric acid manufacturing, from clay brick plants and from treating nonferrous metals. Its presence in the atmosphere is one of the major environmental concerns, since it contributes to acid rain formation [4,5], has various other environmental impacts such as localised cooling (by reflecting sunlight back into space) [6] and is hazardous to human health resulting in many types of respiratory illnesses such as asthma and bronchitis [7,8]. The emission of SO2 by industrial activities also needs to be limited. Two types of SO2‐loaded off gases need to be distinguished. Power plant flue gases generally contain low concentrations of SO2 (less than 0.5% by volume), but are emitted at high volumetric flow rates: A coal‐fired power plant burning 1% sulphur coal (by weight) produces 20 kg of SO2 for every ton of coal burned, and this at over 10,000 Nm3/t of exhaust gas [6]. Similarly, a clay brick kiln will
emit about 6 g/Nm3 of SO2 at high flue gas flow rates (~ 100,000 Nm3/h for a medium size brick kiln).
These “dilute” SO2 gases will mainly rely on a “throw‐away” reactant for the abatement, as further
described in Section 1.2 below.
Highly loaded off gases are produced by e.g., smelter operations, containing SO2 at a
concentration of about 10% by volume. These concentrated gases will be mostly water‐scrubbed in a counter‐current absorption tower, and the resulting liquid will be upgraded to sulphuric acid (H2SO4). The upgrading of sulphuric acid to commercial grade (>95%) is necessary for making this method economically feasible [9–12]. Table 1. Characteristics of combustion feedstock. Parameters Used in the present research Petroleum fuels oil Coal
(Columbia) Wood bark Sludge
No.1 fuel oil (41.5° A.P.I.) No.2 fuel oil (33° A.P.I.) Low sulfur (12.6° A.P.I.) High sulfur (15.5° A.P.I.) Ash content (wt.% dry) 7.7–9.2 0.2–0.3 7.0–22.9 <0.01 <0.01 0.04 0.02 C (wt.%) 60.1–62.1 17.8–22.3 10.3–15.7 86.4 87.3 87.26 84.67 H (wt.%) 4.22–4.25 1.11–2.72 1.39–2.09 13.6 12.6 10.49 11.02 S (wt.%) 0.58–0.59 0.02–0.05 0.05–0.06 0.09 0.22 0.84 3.97 N (wt.%) 1.26–1.35 0.04–0.17 0.05–0.09 0.003 0.006 0.28 0.18 O (wt.%) 8.92–8.97 16.42–18.82 12.71–15.13 0.01 0.04 0.64 0.38 1.2. Review of De‐SO2 Techniques
There are two approaches to SO2 emission control, i.e., the removal of sulphur from the fuel
before it is burned, by using low‐sulphur fuels [13], or the end‐of‐pipe removal of SO2 from the
exhaust gases before emission into the atmosphere. In the flue gas treatment, both wet (scrubbing) and dry systems (sorbent injection) are used. The present research only deals with SO2 removal from
flue gases, since the complete removal of S from the fuel prior to combustion is at present neither technically nor economically viable [13]. Some relevant references are given in Table 2. A further description is given below.
Table 2. Relevant literature findings for end‐of‐pipe deSOx.
Author Methods Characteristics
[14,15] Semi‐dry flue gas desulphurization (FGD)
Contact with slurry of Ca(OH)2
Production of CaSO4 (in some cases reusable in building
industry)
[11,16] Scrubbing (H2O) Scrubbing with water in countercurrent adsorption tower
Concentration to technical grade H2SO4 needed [17–19] Thiosorb lime wet scrubbing Reagent of 3–6 wt% MgO acts as catalyst for SO2 removal by lime Reliable and cost‐effective process for high‐sulphur applications [20–23] Regenerative alumina process
Simultaneous removal of NOx and SO2 by of alumina pellets
with sodium aluminates Spent sorbent is regenerated No longer used in practical applications [24,25] Dry limestone Most practical method, using dry limestone or lime Application in fluidized beds [26–28] Electron beam flue gas treatment (EBFT) Simultaneous dry removing of SO2 and NOx Flue gas irradiation with fast electrons initiating chemical reactions High capital and operating costs [29] Oxy‐fuel combustion
The substitution of N2 by O2 in oxy‐fuel combustion does not
affect the release of sulphur from the coal during combustion.
Increased retention will reduce the SO2 emission rate
Various “throw‐away” techniques for desulphurisation have been developed in semi‐dry or dry flue gas desulphurisation (FGD). Hydrated lime (Ca(OH)2) and/or sodium bicarbonate (NaHCO3) are
commonly used as SO2 reactants, with solid reaction product (CaSO4 / Na2SO4) removed with the gas
exhaust of the contactor and partly recycled (till exhausting the active reactant) or finally recovered in a collection device (fabric filter or electrostatic precipitator). A portion of solids is recycled, mixed with fresh reactant and fed (semi‐) dry to the contactor. Dry reaction products are obtained. In the dry process, both bubbling and circulating fluidized beds (BFB, CFB) can be used as contactor [30– 33]. In this process no waste water is produced and dry calcium sulphate is the product of reaction [14]. In a wet scrubbing process [16], SO2 is removed by scrubbing with water or alkali solutions in a counter‐current absorption tower, and sulphuric acid is formed. The concentration of sulphuric acid to commercial grade (>95%) is necessary for making this method economically feasible.
The Thiosorb process is an example of a mixed deSOX process and requires the use of lime
reagent with 3–6 wt% magnesium oxide (MgO) for SO2 capture in a wet flue gas desulphurization
system. Absorbent slurry is sprayed into the gas containing SO2. The pure lime scrubbing process has
a number of deficiencies and desulphurization is exceptionally low (removal efficiency of 50% to 85%). A large volume of slurry has to be brought into contact with flue gas for abatement of SO2 and
it needs a significant amount of energy for pumping. By addition of MgO, which acts as catalyst and reactant, lime scrubbing can achieve SO2 removal of 99% with high sulphur coal. This system is
recognized as a reliable process for high‐sulphur applications and is cost‐efficient [17,18].
A system based on sorption on alkalised alumina simultaneously removes SO2 and NOx uses a
fluidized bed of alumina pellets with sodium aluminate. Flue gas in the range of 120–150 °C passes through a fluidized bed which contains the active sorbent to remove SO2 and NOX and form sodium
sulphate, sulphite and nitrate. Spent sorbent, recovered separated from the absorption reactor, is regenerated in a number of steps: initially, the sorbent is heated with hot air and the stripped gas is subsequently sent to a selective catalyst reduction to transform NOx to N2, and finally to a multistage
regenerator to react with steam and natural gas to obtain hydrogen sulphide (H2S) and SO2. This
One of the most practical methods to reduce SO2 emissions is using dry lime [CaO, Ca(OH)2] or limestone (CaCO3). This method will be further investigated in this paper. Limestone and/or lime are
used to enable SO2 gas to chemically react with CaCO3 or CaO forming calcium sulphate (CaSO4) and
calcium sulphite (CaSO3) as can be seen in the following reactions.
CaCO3(s) + SO2(g) + 0.5O2 (g) → CaSO4 (s) + CO2 (g)
CaCO3 (s) + SO2 (g) → CaSO3 (s) + CO2 (g)
CaO(s) + SO2 (g) + 0.5O2 → CaSO4(s)
A continuous circulating fluidized bed (CFB) is commonly chosen as the most appropriate processing unit due to the high velocity of air being used, thus reducing the plant size and providing very good mixing and contact for the desired removal. The flue gas is forced into the riser via a fan and a distributor situated at the bottom of the riser. After the distributor, the flue gas will be in contact with limestone or lime being both fed from the L‐valve, and injected as fresh reactant. The excellent mixing achieved in the CFB promotes mass transfer between the limestone and the flue gas. As the air/solid mixture leaves the riser, it enters the cyclone. The cyclone will collect coarser solids and recycle them to the riser. Over time, particles erode and become smaller, they become saturated with chemisorbed SO2 and need to be removed from the system. Very small solids together with the flue gas will leave the system from the top of the cyclone, at approximately the same temperature as the inlet flue gas, and are directed to a polishing filtration. CFB technology was commercially introduced by Lurgi in the early eighties for the abatement of acid gases, especially for flue gas desulphurization using Ca2+ compounds. Numerous plants based on this CFB desulphurization technology are in commercial operation [34–37]. Leuschke et al. [38], have shown that it is possible to achieve desulphurization efficiencies in excess of 99%, reducing residual SO2 emissions to about 50 mg/Nm3. The model developed in the present paper will
theoretically demonstrate that these high efficiencies can indeed be achieved.
1.3. Objectives and Novelties of the Present Researach
Despite numerous previous researches, as highlighted in 1.2 above, the SO2 capture by alkali
sorbents is not fully understood towards (1) the reaction rate; (2) the application in a large‐scale combustor. The present study offers answers to these questions. The de‐SO2 efficiency is analyzed in a large‐ scale CFBC, with cheap Ca(OH)2 as alkali sorbent. It moreover develops a theoretical model approach, applicable to any alkali sorbent of different particle size, by developing model equations that combine gas film diffusion, reaction rate and gas diffusion in the pore of the sorbent. Application of the overall model to sorbents of small particle size will determine that the reaction of SO2 with CaO is the dominant factors in the reaction rate. The conversion can be predicted when the SO2 to sorbent ratio and the gas‐solid contact time are determined.
The continuous circulating fluidized bed (CFB) is demonstrated to be the most appropriate processing unit due to both the high gas velocity (U) and solid circulation flux (G) being used, thus reducing the plant size, and providing very good mixing and contact between SO2 and reactant for
the desired removal [39–41]. A cyclone will collect solids and recycle them to the riser of CFB. When the size of solids becomes smaller due to attrition, the particles have a higher surface area per unit volume to react with the SO2. Usually very fine solids are SO2‐saturated and can no longer be
separated by the cyclone. These very fine particle will exit the system together with the fly ash and flue gas, and need subsequent cooling before a fabric filter or electrostatic precipitator [42,43].
2. Experimental Set‐Up and Results
The specific reactions of SO2 with Ca2+ in the circulating fluidized bed combustor of biomass
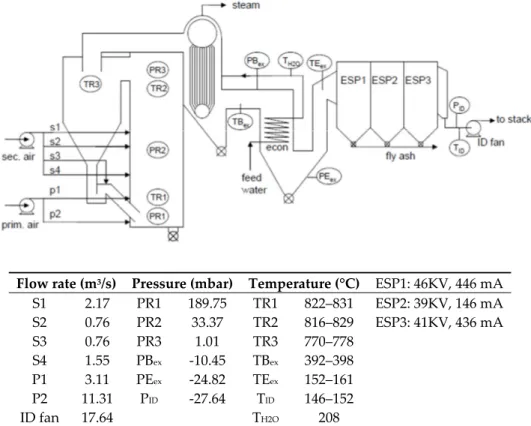
were examined in a large scale CFB combustor of UPM‐Kymmene (UK) Ltd (Caledonian paper mill, Irvine, Ayrshire, Scotland, UK) while burning coal, wood bark and sewage treatment sludge. The layout of the plant and its operational conditions are illustrated in Figure 1. Relevant dimensions are given in Table 3. The feedstock of the CFB was given in Table 1. Due to the high percentage of coal
used (2.1 kg/s for a total of 2.5 kg/s), the SO2 formed is between 1.25 and 1.4 g/m3 as measured in the
stack exhaust. Measurements were made continuously while adding Ca(OH) 2 to the feed of the CFB.
Since Ca(OH) 2 decomposes to CaO and H2O at ~ 580 ℃, the reaction of SO2 at the operating
temperature of ≥800 ℃ should consider CaO as reactant. Due to the fact that the CFB combustor is essential in the paper manufacturing process to supply process steam, variations in the CFB operation were limited (towards operating temperature (T), superficial gas velocity (U), and solids circulation flux (G)).
Experimental results are expressed as percentage SO2‐removed in function of the operating
temperature, with the operating superficial gas velocity (U) and solid circulation flux (G) as additional parameters. Hydrated lime [Ca(OH)2] of particle size <<100 μm was added within the fuel
feed, at such a mass flow rate that the resulting CaO inventory in the CFB was between 1 and 2 wt%. Due to particle attrition in the CFB, reacted lime (as CaSO4) was removed with the fly‐ash in the
electrostatic precipitator. Due to particle attrition in the CFB, reacted lime (as CaSO4) was removed
with the fly ash in the electrostatic precipitator.
Flow rate (m3/s) Pressure (mbar) Temperature (°C) ESP1: 46KV, 446 mA
S1 2.17 PR1 189.75 TR1 822–831 ESP2: 39KV, 146 mA S2 0.76 PR2 33.37 TR2 816–829 ESP3: 41KV, 436 mA S3 0.76 PR3 1.01 TR3 770–778 S4 1.55 PBex ‐10.45 TBex 392–398 P1 3.11 PEex ‐24.82 TEex 152–161 P2 11.31 PID ‐27.64 TID 146–152 ID fan 17.64 TH2O 208
Figure 1. Flow‐sheet and operating conditions of the 58 MWth circulating fluidized bed (CFB)‐
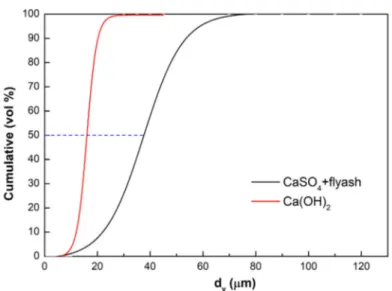
combustor at UPM‐Kymmene (UK) Ltd., Caledonian paper mill, Irvine, Ayrshire, Scotland, UK [3] (Reprinted from [3], with permission from Elsevier, 2019.) Table 3. Relevant dimensions of the CFB. Riser Cyclone Square Total length Length above L‐valve Diameter cylinder Length cylinder Length conical part Solids apex Gas outlet 3780 mm 18,450 mm 14,000 mm 4560 mm 5460 mm 5000 mm 1310 mm 1860 mm Ca(OH)2 consists of soft hexagonal crystals. Its particle size is illustrated in Figure 2. The figure also includes the laser diffractometry size analysis of the fines collected (CaSO4 and flyash) collected. Since both flyash and CaSO4 cannot be separated from the discharge of the electrostatic precipitators, both are jointly analyzed.
Figure 2. Particle size analysis (Malvern) of the Ca(OH)2 sorbent used, and of the flyash‐CaSO4 fines
collected.
The BET of the Ca(OH)2 used was 40.6 m2/g, against only 3.4 to 4.9 m2/g for the flyash‐CaSO4
discharge. These Malvern results clearly indicate that Ca(OH)2 is a brittle sorbent, reduced to smaller
particle sizes by reaction, thermal decrepitation and attrition. BET results also tentatively demonstrate that the formation of CaSO4 reduces the porosity of the sorbent. This is expected, since
the molar volume of CaSO4 is 74.69 cm3/mol, against 31.66 cm3/mol for Ca(OH)2: CaSO4 with a higher
molar volume tends to block the Ca(OH)2 pores upon reaction.
Additional measurements for Ca(OH)2 include the pore size distribution, and field emission
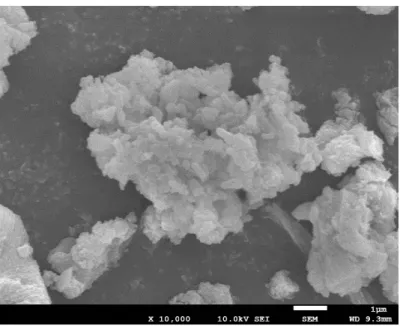
scanning electron microscopy (FESEM). Nitrogen adsorption‐desorption isotherms were measured using a ASiQwin, ver.5.2, Quantachrome Instruments, as shown in Figure 3 and Table 4. The surface morphology of the adsorbent was determined by JEOL JSM‐7800F field emission scanning electron microscope (FESEM), as illustrated in Figure 4.
Table 4. BET results of Ca(OH)2 nanoparticles.
Component Pore volume (cm3/g) BET surface area (m2/g) Type of porosity
Ca(OH)2 0.20 40.6 Mesoporous 5–12 nm
Figure 4. SEM imaging of Ca(OH)2 particles.
The pores of the Ca(OH)2 particles are all mesopores. The pore size of Ca(OH)2 is anyway larger
than CaSO4. Similar measurements could not be made for the reaction product, CaSO4, since it was
collected together with the flyash fines. SEM images reveal the porous and irregular structure of the Ca(OH)2 particles.
The SO2 abatement experiments reveal SO2 removal efficiencies between 95% and 99.5%, as a
function of operating superficial air velocity, solid circulation flux and temperature (Figure 5).
Figure 5. Experimental data under different conditions, at dp = 40 μm.
The results will be further compared with model predictions in Section 5. An increasing G increases the efficiency of SO2 removal, irrespective of U. Increasing values of U at a given G reduce
the removal efficiency. Both effects are in accordance with the hydrodynamic expectations: An increasing U will reduce the SO2‐CaO contact (residence) time, thus reducing the reaction potential;
an increasing G on the contrary will increase the amount of CaO present in the riser, thus enhancing the reaction by the increasing CaO/SO2‐ratio [44]. These effects will also be further discussed when
model equations are applied.
3.1. Model Equations
The reaction of the solid reactant with SO2 follows a first order kinetics in SO2, provided O2 is
present in high concentrations [45,46]. This is always the case in combustion flue gases in view of the legal obligation to emit them into the atmosphere at minimum 6 vol % O2. As shown in Figure 6, three combined factors are important in the SO2 /particle reaction: 1. The external diffusion of SO2 across the gas film, determined by the Sherwood number, and a function of the turbulence of the system and therefore of the type of reactor; 2. The internal diffusion of SO2 in the porous particles, expected to play a role in particles of large diameter, only; 3. The reaction as such (1st order), function of the reaction rate constant and the contact time. Figure 6. Graphical illustration of resistances in the overall reaction mechanism.
These 3 factors are combined in general model equations, although the gas film diffusion is expected to only control the overall reaction rate in the early stages of conversion when no product layer is present: A product layer will introduce a pore‐diffusion resistance. Since CFB attrition might however remove the product layer, gas film diffusion was included in the calculations.
To develop a model that spans a wide range of particles sizes of the CaO reactant, a shrinking core model is used, which assumes a sharp boundary between the un‐reacted core and the formed product layer [47]. CaO particles, are assumed spherical and of uniform size. The overall mass balance is expressed in terms of the SO2 and CaO conversion by:
C = Cg/Cg0 = 1‐MRX (1)
Cg0 and Cg, Initial SO2 concentration, and SO2‐concentration at any time (mol/m3)
MR, Molar ratio of Ca2+‐reactant/SO2 (mol/mol)
X, Fractional conversion of Ca2+‐reactant (‐)
The relationship between the conversion X, and the radius of the shrinking core, rc, as a function
of its initial radius, R0, is given by:
1‐X = (rc/R0)3 (2)
The reaction rate can be expressed in terms of the determining factors where gas film mass transfer (kg), pore diffusion (De) and reaction rate constant (kc) are combined [47,48].
‐ρP Ms drc dt= Cg rc2 R02kg +(RR0‐rc)rc 0De + 1 kc (3)
rc and R0, Radius of the reaction boundary and Initial radius (m), respectively; Ms, Molar mass
of solid reagent (CaO) (kg/kmol); ρp, Particle density (kg/m3); kg, Gas film mass transfer coefficient
(m/s); De, Effective Diffusivity of SO2 in the porous reagent (m2/s); kc, Reaction rate constant (m/s).
Introducing MR and X from equations (1) and (2) respectively, together with a dimensionless reaction time τ according to equation (4), and dimensionless groups that include the relevant reaction resistances (Bi, Da), yields: τ = DeMsCg0 R02ρp t (4) dX dτ = 3 1‐X 13 1‐ 1‐Bi1 1‐X 13+Da‐1 1‐X ‐13 (1‐MRX) (5)
t = Reaction time (s); τ = Dimensionless time (‐); Bi = Biot number = kgR0/De, incorporating film
and intra‐particle (pore) diffusion; Da = Damkohler number = kcR0/De, including reaction rate constant
and pore diffusion.
This equation is solved with the following boundary conditions: at τ = 0, X = 0 (no CaO conversion at t = τ = 0) and C = 1 (Cg = Cg0 at t = τ = 0) Introducing further appropriate ratios and equations provides a general solution [48]: α = (1‐Mg Mg ) 1/3 (6) γ = (1‐X)1/3 (7) τ = (1+α3)(g 1φ1+g2φ2+g3(g4‐φ3)) (8) g1 = 1 2α 1‐ Da‐1 α (9) g2 = 1 3 1‐Bi ‐1 ‐ 1 6α 1‐ Da‐1 α (10) g3 = 1 α√3 1+ Da‐1 α (11) g 4 = tan ‐1 2‐α α√3 (12) φ1 = ln γ+α γ‐α (13) φ2 = ln γ 3+α3 1+α3 (14) φ3 = tan‐1 2γ‐α α√3 (15)
The integrated reaction equation includes the dominant parameters. Physical properties are included in the Biot‐and Damköhler numbers. The required reaction yield can be predicted for any value of MR and/or τ provided these parameters are calculated.
3.2.1. External Diffusion The rate coefficient of gas diffusion, kg, is commonly expressed in terms of the Sherwood number, Sh, being the ratio of the mass transfer coefficient at the particle surface and the gas diffusivity. Different expressions are used in powder‐gas systems: Sh = f Re,Sc = kgdp Dg (16) Sh, Sherwood number, kgdp/Dg (‐) Re, Reynolds number, dpUslρg/μg (‐) Sc, Schmidt number, μg /ρg Dg (‐) Dg, Diffusivity of SO2 in the gas flow (m2/s) dp, Particle diameter (m) kg, Gas film mass transfer coefficient (m/s) Usl, Slip velocity (i.e., ~ U‐Ut) (m/s) U, Superficial gas velocity in the CFB (m/s) Ut, Particle terminal velocity (m/s) 𝜇 , Gas viscosity (Pa.s) 𝜌 , Gas density (kg/m3) All gas‐related parameter values need to be calculated at the operating temperature. Powder related parameters are nearly insensitive to the temperature. Equations for the Sherwood number are given by Li and Wang [49], Zevenhoven and Jarvinen [50], and Gunn [51]. A CFB combustor, the UPM‐Kymmene (UK) Ltd (Caledonian paper mill, Irvine, Ayrshire, Scotland, UK) application with a riser of 3.78 × 3.78 m2 being a typical example, operates at
temperatures between 1023 K and 1173 K, with small particles (Ca2+‐reactant is injected with particle
size ≤74 μm). The slip velocities, being the difference of the superficial gas velocity, U, and the calculated terminal (free fall) velocity of the particle, Ut, are around 3 m/s [52]. Application of the
literature equations leads to the following predictions of kg, as illustrated in Figure 7. Figure 7. Predicted kg (in m/s) in CFB combustors, at 1023K and 1123K. Although predicted values differ among the equations, the kg value exceeds 200 m/s for reactant particle sizes below 74 μm, being closer to 300 m/s for an average particle size of ~40 μm. From these calculated kg‐values, it is also clear that the effect of the gas diffusion resistance can be assumed negligible ( rc2 R02kg
<<) for fine particles, as will also be proven by further calculations. 3.2.2. The Effective Internal Diffusion Coefficient, De
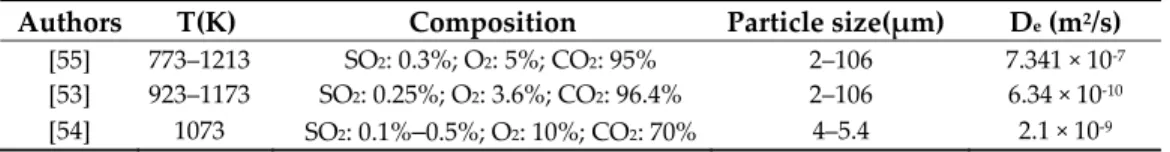
The effective pore diffusivity De determines the resistance to gas penetration within the particle. It depends on pressure, temperature, particle porosity, and particle size. As previously experienced [52], it only plays a role for coarser particles. For fine particles the contribution of the pore diffusion resistance is small. The effect of the internal pressure is limited, and pressure is assumed to remain atmospheric in a CFB environment. At atmospheric pressure, and using sorbent particles between 2 and 106 μm at absorption temperatures between 773 and 1123 °C, the effective diffusivity in m²/s was determined by various researches, as illustrated in Table 4. Values differ by several orders of magnitude i.e., from 6.4 × 10⁻¹⁰ [53], to 2.1 × 10⁻⁹ [54] and 7.3 × 10⁻⁷ [55]. The effect of pressure is not
outspoken [56–59].
Table 5. Table of effective diffusivities, measured for different systems at atmosphere pressure.
Authors T(K) Composition Particle size(μm) De (m2/s)
[55] 773–1213 SO2: 0.3%; O2: 5%; CO2: 95% 2–106 7.341 × 10‐7 [53] 923–1173 SO2: 0.25%; O2: 3.6%; CO2: 96.4% 2–106 6.34 × 10‐10 [54] 1073 SO2: 0.1%–0.5%; O2: 10%; CO2: 70% 4–5.4 2.1 × 10‐9 It is common to use De ~10–9 m2/s in reaction rate calculations. 3.2.3. The Reaction Rate Constant, kc This key parameter for all gas‐solid reactions. For limestone it is of the order of 10‐4 to 10‐3 m/s
[54,55,57,59,60]. It is between 10–2 to 10–3 m/s for CaO [45,46,59,61,62]. Since the sulphation of Ca2+ is
an exothermic process, reaction rates are lower at high temperatures and higher at lower temperatures.
3.2.4. The Molar Ratio MR (Expressed as Ca/S or CaO/S)
To find the molar ratio, the molar flow rate of CaO (or CaCO3)) and molar flow rate of SO2 are
required operational variables. With a solid circulation flux, G (kg/m2s) and cross‐sectional area of
the riser, A (m2), the molar flow rate of solids is known. Molar flow rate of solid reactant = G A(%CaCO3) MMCaCO3 or G A(%CaO) MMCaO (17) Where, G, Solid circulation flux (kg/m2s) A, Cross sectional area of the riser (m2)
MMCaCO3, molecular weight of CaCO3 100 kg/kmol
MMCaO, molecular weight of CaO 56 kg/kmol
%CaCO3/%CaO, weight percentage in G ‐
Similarly, for a superficial gas velocity, U (m/s) in the same riser dimensions, the molar flow rate of SO2 is also defined. Molar flow rate of SO2= AU MVSO2 SO2(ppmv) 106 * 273 (T+273)
MV SO2, molar volume of SO2 22.4 Nm3/kmol MR= GA(%CaO) 56 UASO2(ppmv) 106 * 273 22.4(T+273) or MR= GA(%CaCO3) 56 UASO2(ppmv) 106 * 273 22.4(T+273) (18) 3.2.5. Evaluation of the Model Parameters During the experiments, the CFB of UPM‐Kymmene (UK) Ltd (Caledonian paper mill, Irvine, Ayrshire, Scotland, UK) was operated at 1107–1135 K, for superficial velocities of 2.5 to 4.8 m/s and solids circulation fluxes of 36 to 71 kg/m2s. The initial SO2 concentration was
0.8 m/s. The amount of CaO in the bed was between 1 to 2 wt%, and was continuously kept at that level by adding fresh CaO [as Ca(OH)2].
Under these specific operating conditions, the essential parameters can be retrieved from previous equations and data, whilst MR and the contact time t are calculated below:
1. De: 10–7 to 10–9 m2/s, commonly adopted as 10–9 m2/s
2. kg: Allowing for a safety margin, kg i s taken at a conservative average of 300 m/s, for the
particle size range (<74 μm) under scrutiny 3. kc: 5 × 10‐2 m/s
4. The MR ratio is calculated according to the equations before, and illustrated in Figures 8.
Figure 8. Molar ratio CaO/SO2 at selected operating conditions (T = 1125 K) for G = 50 (a), 70 (b) and 90 (c) kg/m2s. 5. The residence time distribution of the gas phase in the riser of a CFB was studied by [39]. The average contact time is given by:
𝑡̅ = 0.54(U‐UTR)‐0.25G‐0.2H with 𝑡̅ in s and H, the riser height in m (19)
It should be remembered that U is the superficial gas velocity, whereas UTR is the superficial gas
velocity whereby a CFB operating mode is initiated [31,63,64].
Considering a riser of 14 m height above the solids recycle feed as in the UPM‐Kymmene (UK) Ltd (Caledonian paper mill, Irvine, Ayrshire, Scotland, UK) case, operating at an average velocity of 3.5 m/s for particles with UTR, of 0.8 m/s, yields 𝑡̅‐values of 𝑡̅ = 2.98 s for G = 30 kg/m2s and 2.52 s for
G = 10 kg/m2s. 4. Application of the Model Equations and Comparison with Experimental Result 4.1. Effect of Contact Mode From the model application, Figure 9 illustrates that a short time contact time, τ, is needed in a CFB, and an average τ in a BFB. The required residence times in a pneumatic conveying line (>>100 s) make this solution in practice impossible since extremely long piping would be needed at a velocity of e.g., 2 m/s. Figure 9. Theoretical contact time vs. Temperature with CaO, for a removal efficiency of 95% in a bubbling fluidized bed (BFB), CFB, and pneumatic reactor. 4.2. The CFB Contact Mode
Using the parameters of 3.2, the model equations can be used to predict SO2 capture
efficiencies and parameter influences.
1. Prior to performing detailed predictions, the effect of both kg and De were assessed. All other
parameters remaining within the predicted range of 4.2, the effects of both kg and De are
negligible. Increasing kg from 200 to 2000 m/s has a negligible effect on the predicted time for a
given conversion: this was indeed expected due to the high Reynolds number in the riser, where flue gas film diffusion is of negligible influence.
Similarly, the variation of De by 2 orders of magnitude, at kg~300 m/s for an average particle size
of 40 μm, has an effect well below 10% on the expected conversion. Pore diffusion is not a rate‐ limiting resistance when using small particles, as is common in CFB combustors.
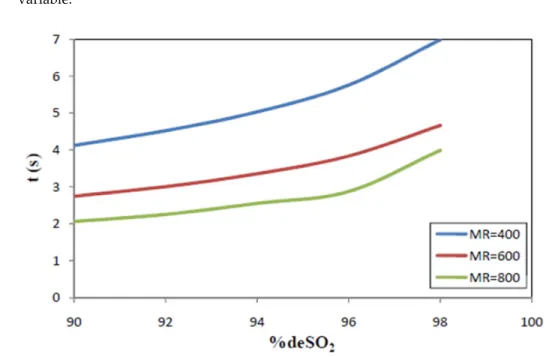
2. Using kg ~ 300 m/s, De = 10‐9 m2/s and kc = 5 × 10‐2 m/s, the model equations predict the required
time (t) for a given conversion. This is illustrated in Figure 10 below, MR being the remaining
variable.
Figure 10. Predicted required reaction time for a given de‐SO2 efficiency, at various values of MR
(1125K, kg = 300 m/s, De = 10‐7 m2/s.).
Since the average gas‐solid contact time in the CFB‐riser is between 2.5 and 3 s and MR‐values
exceed 500, very high SO2‐removal efficiencies are predicted.
3. The effect of CaO‐particle size is important. For e.g., MR = 400, kg = 300 m/s, De = 10‐7 m2/s, the
required contact time is between 2 sec (for 90% SO2 removal) and 3 sec (for 98% SO2 removal)
when using 25 μm sorbent particles. Since for a continuous reaction system, required times are proportional with the particle size, these required contact times need to be multiplied by 2, respectively 4, when using sorbent particles of 50 or 100 μm.
Clearly, operating with coarser CaO‐particles, increases the required reaction time for a required conversion. Commercial Ca(OH)2 normally has a particle size <<74μm, with an average
around 40 μm: efficiencies well in excess of 95% can then be expected in the CFB.
Since particles in a CFB are subjected to attrition, their particle size will progressively decrease. They will be carried out of the system when their particle size is lower than the cut‐size of the CFB cyclone [42]. The attrition will not affect the gas‐solid contact mode, since the bulk CFB bed material will either be an inert powder (e.g., sand), and fresh reactant is continuously added. However, the reaction rate for small particles is inversely proportional to the particle size. Finer particles will therefore be more rapidly converted, thus providing a safely margin towards the required reaction time predicted by the model on the basis of the average particle size.
4. When using the model equations to predict the SO2 removal rate over the range of operating
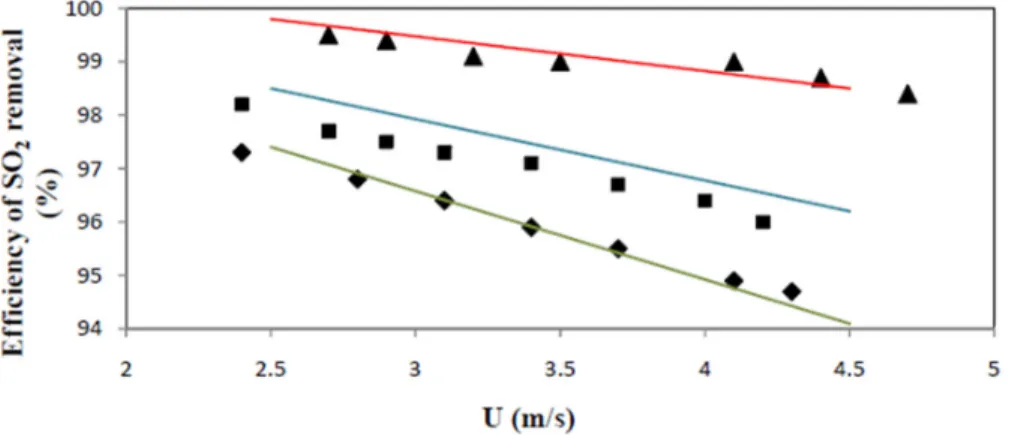
conditions of the UPM‐Kymmene (UK) Ltd (Caledonian paper mill, Irvine, Ayrshire, Scotland, UK) application the correspondence of predicted and measured removal yields is illustrated in Figure 11 (with kc at a conservative 0.03 m/s).
Figure 11. Comparison of experimental data and model predictions, at dp = 40 μm. T = 1107 K, G =
36 kg/m2s; ■ T = 1135 K, G = 57 kg/m2s; ▲T = 1135 K, G = 71 kg/m2s.; ─,─,─ Model prediction for ,
■ and ▲ respectively.
A very fair agreement is obtained. The limited over/or underestimation might be due to the kc‐
value taken at 0.03 m/s (at kc = 0.025 m/s, the predicted removal efficiencies decrease on average by
about 0.2%); a slight overestimation of the reaction time, and/or the use of an average particle size of 40 μm: since the lime used has a wide size distribution and decreases due to attrition, the average particle size can be below 40 μm.
The experimental and model comparison however stresses the reliability of the model approach. This was a further assessed for the case of using CaCO3‐filler, with commonly quoted efficiencies
of >99.9% [38], and widely applied in the Lurgi CFB‐SO2 removal plants. In these applications, a
CaCO3 circulating bed is used. At an average conversion of 50%, the CaCO3‐content of the bed can
be assumed as 50%. MR values in this case vary between 5000 and 14,000 for SO2 = 600 ppmv and U
decreasing from 6 to 3 m/s respectively. For SO2 = 400 ppmv the MR‐values increase to 11,000 and
21,000 respectively at 6 and 3 m/s.
It is hence clear that SO2 removal efficiencies in a CFB‐riser are excellent and are achieved by
a simple direct contact between the Ca2+ reactant and SO2.
5. Conclusion
The SO2 capture by alkali sorbents is examined for a large‐scale CFBC (58 MWth) of coal, biomass
and sludge. Experimental results demonstrate a removal efficiency of >94.5 at high superficial gas velocity and low solid circulation flux. Efficiencies of over 99.5% are reached at lower operating velocities and higher solid circulation flux. A theoretical reaction model was developed to encompass gas film diffusion, gas diffusion in the sorbent pores, and the chemical reaction at the unreacted particle core. From the evaluation of the model parameters, the chemical reaction is the major resistance in the overall reaction rate. The application of the model equations moreover demonstrate that a CFB is a better gas–solid contacting mode than a BFB. A pneumatic reactor is practically unacceptable. The fair agreement between experimental and model results stress the reliability of the model approach. Author Contributions: Y.D. and J.B. performed the experiments. Y.D., J.B. and R.A. developed and compiled the model. J.B. and H.Z. provided parameter data. All authors participated in the preparation and presentation of the manuscript. Funding: This research received no external funding.
Acknowledgments: This work was funded by the Beijing Advanced Innovation Center for Soft Matter Science and Engineering of the Beijing University of Chemical Technology. Conflicts of Interest: The authors declare no conflict of interest. Nomenclature A Cross sectional area of the riser m2 C Dimensionless gas reactant concentration ‐ Cg0 Initial gas concentration mol/m3 Cg Gas concentration at any time mol/m3 dp Particle diameter m D Diameter of riser m De Effective Diffusivity of SO2 in the porous reagent m2/s Dg Diffusivity of SO2 in the gas flow m2/s H Height of the riser m G Solid circulation flux kg/m2s gi Reaction rate parameters defined by equations (9) to (12) ‐ kc Reaction rate constant m/s kg Gas film mass transfer coefficient m/s MR Molar ratio of Ca2+‐reactant and S ‐ Ms Molar mass of solid reagent (CaO) g/mol MM molecular weight kg/kmol MV molar volume Nm3/kmol P Pressure Pa rc Radius of the reaction boundary m R0 Initial radius m T Temperature K t Reaction time s 𝒕̅ Average contact time in CFB s U Superficial gas velocity in the CFB m/s Usl Slip velocity (i.e., ~ U‐Ut) m/s Ut Terminal velocity of particle m/s UTR Transport velocity m/s X Fractional conversion ‐ Greek letters ρg Gas density kg/m3 ρp Particle density kg/m3 μg Gas viscosity Pa∙s τ Dimensionless time ‐ ε Voidage in the riser ‐ φi Reaction rate parameters defined by equations (13) to (15) ‐ Abbreviations A.P.I American Petroleum Institute BFB Bubbling fluidized bed Bi Biot number, kgR0/De
CFB Circulating fluidized bed
CFBC Circulating fluidized bed combustor Da Damkohler number, kcR0/De
EBFT Electron beam flue gas treatment FGD Flue gas desulphurisation Re Reynolds number, dpUslρg/μg Sc Schmidt number, μg/ρg Dg Sh Sherwood number, kg/dp Dg References 1. IEA. CO2 Emissions from Fuel Combustion; OECD iLibrary: Marrakesh, Morocco, 2016; ISBN: 9789264258563, doi:10.1787/co2_fuel‐2016‐en. 2. Quéré, C.; Andrew, R.; Friedlingstein, P.; Sitch, S.; Hauck, J.; Pongratz, J.; Pickers, P.; Ivar Korsbakken, J.; Peters, G.; Canadell, J.; et al. Global Carbon Budget 2018. Earth Syst. Sci. Data 2018, 10, 2141–2194, doi:10.5194/essd‐10‐2141‐2018.
3. Mahmoudi, S.; Baeyens, J.; Seville, J.P. NOx formation and selective non‐catalytic reduction (SNCR) in a fluidized bed combustor of biomass. Biomass Bioenergy 2010, 34, 1393–1409.
4. Urone, P. The primary air pollutants—Gaseous. Their occurrence, sources, and effects. In Air Pollution; Stern, A.C., Ed.; Academic Press: New York, NY, USA, 1976; Volume 1.
5. Gibeaux, S.; Thomachot‐Schneider, C.; Eyssautier‐Chuine, S.; Marin, B.; Vázquez, P. Simulation of acid weathering on natural and artificial building stones according to the current atmospheric SO2/NOx rate.
Environ. Earth Sci. 2018, 77, 327. 6. Oruc, O.; Dincer, I. Environmental impact assessment of using various fuels in a thermal power plant. Int. J. Glob. Warm. 2019, 18, 191–205. 7. Carnell, E.; Vieno, M.; Vardoulakis, S.; Beck, R.; Heaviside, C.; Tomlinson, S.; Dragosits, U.; Heal, M.; Reis, S. Modelling public health improvements as a result of air pollution control policies in the UK over four decades—1970 to 2010. Environ. Res. Lett. 2019, doi:10.1088/1748‐9326/ab1542. 8. Amsalu, E.; Guo, Y.; Li, H.; Wang, T.; Liu, Y.; Wang, A.; Liu, X.; Tao, L.; Luo, Y.; Zhang, F.; et al. Short‐term effect of ambient sulfur dioxide (SO2) on cause‐specific cardiovascular hospital admission in Beijing, China: A time series study. Atmos. Environ. 2019, 208, 74–81. 9. Wang, H.; Yuan, B.; Hao, R.; Zhao, Y.; Wang, X. A critical review on the method of simultaneous removal of multi‐air‐pollutant in flue gas. Chem. Eng. J. 2019, 378, 122155. 10. Tao, L.; Wang, X.; Ning, P.; Wang, L.; Fan, W. Removing sulfur dioxide from smelting flue and increasing resource utilization of copper tailing through the liquid catalytic oxidation. Fuel Process. Technol. 2019, 192, 36–44. 11. Iliuta, I.; Iliuta, M.C. Modeling of SO2 seawater scrubbing in countercurrent packed‐bed columns with high performance packings. Sep. Purif. Technol. 2019, 226, 162–180, doi:10.1016/j.seppur.2019.05.078.
12. He, J.; Zhang, J.; Shang, H. Dynamic modelling and simulation of the sulphur dioxide converter in an industrial smelter. Can. J. Chem. Eng. 2019, 97, 1838–1847.
13. Nurrohim, A.; Sakugawa, H. Fuel‐based inventory of NOx and SO2 emissions from motor vehicles in the
Hiroshima Prefecture, Japan. Appl. Energy 2005, 80, 291–305.
14. Ma, X.; Kaneko, T.; Tashimo, T.; Yoshida,T.; Kato,K. Use of Limestone for SO2 Removal from Flue Gas in the Semidry FGD Process with a Powder‐Particle Spouted Bed; Chem. Eng. Sci. 2000, 55, 4643–4652,
doi:10.1016/S0009‐2509(00)00090‐7.
15. Moeini, M.; Hatamipour, M.S. Flue Gas Desulfurization by a Powder‐Particle Spouted Bed. Chem. Eng.
Technol. 2008, 31, 71–82.
16. Backhurst, J.R.; Sinnott, R.K.; Richardson, J.F. Coulson & Richardson Chemical Engineering; Butterworth‐ Heinemann: Oxford, UK, 2001; pp. 105–107.
17. Selmeczi, J.G.; Stewart, D.A. Flue gas desulfurization/The Dravo Corp. Thiosorbic flue gas desulfurization process. Chem. Eng. Prog. 1978, 74, 2.
18. Benson, L. Development and Commercialization of the Thiosorbic Lime Wet Scrubbing Process for Flue Gas Desulfurization. In Lime for Environmental Uses, ed. A. Gutshick, West Conshohocken, PA: ASTM
19. Gutschick, K. Lime for Environmental Uses: A Symposium Sponsored by ASTM Committee C‐7 on Lime, Los
Angeles, CA, 25 June 1985; 1987.
20. Cunic, D.; Lunt, R. Profiles in Flue Gas Desulphurization; American Institute of Chemical Engineers: New York, NY, USA, 1994.
21. Medellin, P.M.; Weger, E.; Dudukovic, M.P. Removal of SO2 and NOxfrom Simulated Flue Gases by
Alkalized Alumina in a Radial Flow Fixed Bed. Ind. Eng. Chem. Process. Des. Dev. 1978, 17, 528–536. 22. Hao, R.; Wang, X.; Mao, X.; Tian, B.; Zhao, Y.; Yuan, B.; Tao, Z.; Shen, Y. An integrated dual‐reactor system
for simultaneous removal of SO2 and NO: Factors assessment, reaction mechanism and application
prospect. Fuel 2018, 220, 240–247. 23. Park, H.‐W.; Uhm, S. Various technologies for simultaneous removal of NO and SO from flue gas. Appl. Chem. Eng. 2017, 28, 607–618. 24. Ar, I.; Balci, S. Sulfation reaction between SO2 and limestone: Application of deactivation model. Chem. Eng. Process. Process Intensif. 2002, 41, 179–188. 25. Baege, R.; Sauer, H. Recent Developments in CFB‐FGD Technology; VGB PowerTech: Essen, Germany, 2000. 26. Basfar, A.; Fageeha, O.; Kunnummal, N.; Al‐Ghamdi, S.; Chmielewski, A.G.; Licki, J.; Pawelec, A.; Tymiński, B.; Zimek, Z. Electron beam flue gas treatment (EBFGT) technology for simultaneous removal of SO2 and NOx from combustion of liquid fuels. Fuel 2008, 87, 1446–1452. 27. Licki, J.; Chmielewski, A.; Iller, E.; Zimek, Z.; Mazurek, J.; Sobolewski, L. Electron‐beam flue‐gas treatment for multicomponent air‐pollution control. Appl. Energy 2003, 75, 145–154. 28. Zwolińska, E.; Gogulancea, V.; Sun, Y.; Lavric, V.; Chmielewski, A. A kinetic sensitivity analysis for the SO2 and NOx removal using the electron beam technology. Radiat. Phys. Chem. 2017, 138, 29–36.
29. Toftegaard, M.; Brix, J.; Jensen, P.; Glarborg, P.; Jensen, A.D. Oxy‐fuel combustion of solid fuels. Prog.
Energy Combust. Sci. 2010, 36, 581–625.
30. Chen, L.; Wang, C.; Si, T.; Anthony, E.J. Modelling the simultaneous calcination/sulfation behavior of limestone under circulating fluidized bed combustion conditions. Fuel 2019, 257, 116072.
31. Mahmoudi, S.; Chan, C.W.; Brems, A.; Seville, J.; Baeyens, J. Solids flow diagram of a CFB riser using Geldart B‐type powders. Particuology 2012, 10, 51–61.
32. Van Caneghem, J.; Brems, A.; Lievens, P.; Block, C.; Billen, P.; Vermeulen, I.; Dewil, R.; Baeyens, J.; Vandecasteele, C. Fluidized bed waste incinerators: Design, operational and environmental issues. Prog. Energy Combust. Sci. 2012, 38, 551–582. 33. Van De Velden, M.; Baeyens, J.; Dougan, B.; McMurdo, A. Investigation of operational parameters for an industrial CFB combustor of coal, biomass and sludge. China Particuol. 2007, 5, 247–254. 34. Yi, J.; Sauer, H.; Leuschke, F.; Baege, R. What is possible to achieve on flue gas cleaning using the CFB technology. In Proceedings of the 8th International Conference on CFB, Hangzhou, China, 10–13 May 2005. 35. Hollett, G.T. Dry removal of SO/sub 2: Application to industrial coal‐fired boilers. Proc. Annu. Meet. Air Pollut. Control Assoc. 1979, June 25‐29. 36. Sauer, H.; Porter, D.E. Dry Removal of Gaseous Pollutants from Flue Gases with the Circulating Fluid Bed Scrubber; Report C479/022, IMechE, London, 20th Oct. 1994.
37. Hansen, S.K.; Toher, J.; Lanois, G.; Sauer, H. High Efficiency, Dry Flue Gas SOx and Combined SOx/NOx
Removal Experience with the Lurgi Circulating Fluid Bed Dry Scrubber‐a new economical retrofit option for U.S. utilities for acid rain remediation; International Power Generation Conference, San Diego, CA, USA, 1991. 38. Leuschke, F.; Bleckwehl, S. Ratschow, L.; Werther, J. Flue gas desulphurization in a circulating fluidized bed: Investigation after 10 years of successful commercial operation at the facility of Pilsen/Cz. In: Werther W., Nowak W., Wirth K‐E., Hartge E.U. (Eds), 9th International Conference on Circulating Fluidized Beds, Hamburg, TuTech Innovation GmbH Germany, 2008, 943‐948. 39. Mahmoudi, S.; Seville, J.; Baeyens, J. The residence time distribution and mixing of the gas phase in the riser of a circulating fluidized bed. Powder Technol. 2010, 203, 322–330. 40. Zhang, H.; Kong, W.; Tan, T.; Gilles, F.; Baeyens, J. Experiments support an improved model for particle transport in fluidized beds. Sci. Rep. 2017, 7, 10178. 41. Chan, C.; Seville, J.P.K.; Parker, D.J.; Baeyens, J. Particle velocities and their residence time distribution in the riser of a CFB. Powder Technol. 2010, doi:10.1016/j.powtec.2010.05.008.
42. Dewil, R.; Baeyens, J.; Caerts, B. CFB cyclones at high temperature: Operational results and design assessment. Particuology 2008, 6, 149–156.
43. Zhang, H.; Degrève, J.; Baeyens, J.; Wu, S.‐Y. Powder attrition in gas fluidized beds. Powder Technol. 2016,
287, 1–11.
44. Mahmoudi, S.; Baeyens, J.; Seville, J. The solids flow in the CFB‐riser quantified by single radioactive particle tracking. Powder Technol. 2011, 211, 135–143. 45. Han, K.; Lu, C.; Cheng, S.; Zhao, G.; Wang, Y.; Zhao, J. Effect of characteristics of calcium‐based sorbents on the sulfation kinetics. Fuel 2005, 84, 1933–1939. 46. Hartman, M.; Svoboda, K.; Trnka, O.; Veselý, V. Reaction of sulphur dioxide with magnesia in a fluidised bed. Chem. Eng. Sci. 1988, 43, 2045–2050. 47. Kunii, D.; Levenspiel, O. Fluidization Engineering; Butterworth‐ Heinemann: Newton, MA, 1991. 48. Benitez, J. Process Engineering and Design for Air Pollution Control; Prentice Hall: Englewood Cliffs, NJ, USA, 1993; Volume 8.
49. Li, J.; Wang, L. Concentration distributions during mass transfer in circulating fluidized beds. In Proceedings of the 7th International Conference on Circulating Fluidized Beds, Niagara Falls, Ontario, Canada, 5–8 May 2002.
50. Zevenhoven, R.; Järvinen, M. Particle/Turbulence Interactions, Mass Transfer and Gas/Solid Chemistry in a CFBC Riser. Flow Turbul. Combust 2001, 67, 107–124.
51. Gunn, D. Transfer of heat or mass to particles in fixed and fluidised beds. Int. J. Heat Mass Transf. 1978, 21, 467–476.
52. Van De Velden, M.; Baeyens, J.; Brems, A.; Janssens, B.; Dewil, R. Fundamentals, kinetics and endothermicity of the biomass pyrolysis reaction. Renew. Energy 2010, 35, 232–242. 53. Fuertes, A.B.; Velasco, G.; Fuente, E.; Alvarez, T. Study of the direct sulfation of limestone particles at high CO2 partial pressures. Fuel Process. Technol. 1994, 38, 181–192. 54. Zhong, Q. Direct sulfation reaction of SO2 with calcium carbonate. Thermochim. Acta 1995, 260, 125–136. 55. Hajaligol, M.R.; Longwell, J.P.; Sarofim, A.F. Analysis and Modeling of the Direct Sulfation of CaCO2. Ind. Eng. Chem. Res. 1988, doi:10.1021/ie00084a002. 56. Iisa, K.; Hupa, M.; Yrjas, P. Product layer diffusion in the sulphation of calcium carbonate. Symp. Combust. 1992, 24, 1349–1356. 57. Liu, H.; Katagiri, S.; Kaneko, U.; Okazaki, K. Sulfation behavior of limestone under high CO2 concentration in O2/CO2 coal combustion. Fuel 2000, 79, 945–953. 58. Qiu, K.; Lindqvist, O. Direct sulfation of limestone at elevated pressures. Chem. Eng. Sci. 2000, 55, 3091– 3100. 59. Zevenhoven, R.; Yrjas, P.; Hupa, M. Sulfur dioxide capture under PFBC conditions: The influence of sorbent particle structure. Fuel 1998, 77, 285–292. 60. Snow, M.J.H.; Longwell, J.P.; Sarofim, A.F. Direct sulfation of calcium carbonate. Ind. Eng. Chem. Res. 1988, 27, 268–273.
61. Simons, G.A.; Rawlins, W.T. Reaction of Sulfur Dioxide and Hydrogen Sulfide with Porous Calcined Limestone. Ind. Eng. Chem. Process. Des. Dev. 1980, 19, 565–572.
62. Borgwardt, R.H. Kinetics of the Reaction of SO2 with Calcined Limestone. Environ. Sci. Technol. 1970,
doi:10.1021/es60036a001.
63. Zhang, H.; Degrève, J.; Dewil, R.; Baeyens, J. Operation Diagram of Circulating Fluidized Beds (CFBs).
Procedia Eng. 2015, 102, 1092–1103.
64. Zhang, H.; Degrève, J.; Baeyens, J.; Dewil, R. The Voidage in a CFB Riser as Function of Solids Flux and Gas Velocity. Procedia Eng. 2015, 102, 1112–1122.
© 2019 by the authors. Licensee MDPI, Basel, Switzerland. This article is an open access article distributed under the terms and conditions of the Creative Commons Attribution (CC BY) license (http://creativecommons.org/licenses/by/4.0/).